1
Dipartimento per la Innovazione nei sistemi Biologici,
Agroalimentari e Forestali (DIBAF)
(AGR/15)
PhD Course in Food Biotechnology – XXVI
thCycle
PhD THESIS TITLE
NOVEL LAGER BEER CLARIFICATION
AND STABILISATION PROCESS
USING CERAMIC TUBULAR
MICROFILTRATION MEMBRANES
TUTOR
PhD STUDENT
Prof. Mauro Moresi
Alessio Cimini
Ph.D. Program Coordinator
Prof. Marco Esti
2
Contents
ABSTRACT ... 6 RIASSUNTO ... 6 EXTENDED ABSTRACT ... 7 INTRODUCTION ... 12CHAPTER 1: The State of the Art on Beer Production, Quality and Environmental Impact ... 17
1.1 – BEER PRODUCTION, CONSUMPTION AND CONSUMER ... 18
1.2 – BEER QUALITY PARAMETERS AND ANALYSIS ... 22
1.2.1 Haze ... 23
Biological haze ... 23
Non-biological haze ... 24
Other hazes ... 29
Haze measurement ... 29
Prediction assessment of haze stability in beer ... 30
1.2.2 Flavor (oxidation and light) ... 31
Prediction of flavor stability ... 33
1.2.3 Foam (stability and gushing) ... 33
Foam measurement ... 36
1.2.4 Color ... 38
1.2.5 Viscosity ... 40
Parameter ... 41
1.3 BEER PRODUCTION AND CONVENTIONAL FINISHING OPERATIONS ... 42
1.3.1 Filtration techniques ... 45
Primary filtration ... 46
Trap filtration ... 46
Fine/final filtration ... 47
3
The main problems associated to diatomaceous earth use ... 53
Alternative filter-aids ... 53
1.3.3 Stabilization techniques ... 54
Cold stabilization ... 55
Pasteurization ... 56
Effect of pasteurization on beer quality ... 57
1.4 – CROSS-FLOW MICROFILTRATION MEMBRANES ... 57
1.4.1 Microfiltration membrane ... 59
Hollow-fiber membranes ... 59
Ceramic membranes ... 60
1.4.2 Cross-flow microfiltration in brewing processes ... 61
Loss reduction ... 63
Cold sterilization of clarified beer ... 64
Clarification of rough beer ... 65
1.4.3 CFMF parameters ... 67
Effect of fouling ... 67
Effect of membrane pore size ... 72
Effect of TMPD ... 73
Effect of superficial velocity ... 74
Flux enhancement techniques ... 75
Back-flushing ... 76
1.4.4 Filtration Modelling ... 78
1.5 - ENVIRONMENTAL IMPACT OF BREWING ... 85
1.5.1 Material consumption ... 87
1.5.2 Energy and heat consumption... 88
1.5.3 Water Consumption ... 90
1.5.4 Wastewaters ... 92
1.5.5 Solid Wastes and By-products ... 93
4
CHAPTER 2 Materials and methods ... 99
2.1 Raw Materials... 100
Rough beer A………. 100
Rough beer B………..100
Rough beer C………..100
2.2 Equipment and experimental procedure ... 101
2.3 Beer pretreatment and stabilization procedure ... 104
2.4 Analyica methods... 2.5 Statistical anlysis of data ... CHAPTER 3 Results and Discussions ... 108
3.1 ROUGH BEER A-ASSESSMENT THE OPTIMAL OPERATING CONDITIONS FOR CFMF ... 109
…. 3.1.1 Effect of TMPD and Vs on permeation flux ... 109
3.1.2 Effect of membrane pore size ... 109
3.1.3 Effect of beer turbidity ... 124
3.1.4 Assessment of the prevailing membrane fouling mechanism………...120.
3.1.5 Validation test under CO2 backflushing ... 135
3.2 VALIDATION OF THE OPTIMAL CFMF OPERATING CONDITION USING ROUGH BEER B AND ASSESSMENT OF THE BEER STABILIZATION USING PVPP ... ………109
3.2.1 Further validation of CFMF using pretreated rough beer B……….129
3.2.2 Cold stabilization of beer………..134
Kinetics of total polyphenol removal using regenerable PVPP………134
Simultaneous stabilization and crossflow microfiltration of EC-pretreated beer ………135
Separate stabilization and crossflow microfiltration of EC-pretreated beer ………..137
3.3 FINAL VALIDATION TEST FOR THE COMBINED STABILIZATION AND COSSFLOW MICROFILTRATION OF AN ROUGH PALE LAGER ………...140
3.3.1 Beer stabilization using regenerable PVPP………...…..143
3.4 ECONOMIC FEASIBILITY AND ENVIRONMENTAL IMPACT OF THE NOVEL CLARIFICATION AND STABILIZATION PROCESS………147
3.5 FINAL PROCEDURE FOR A NOVEL CLARIFICATION AND STABILIZATION PROCESS USING CFMF MEMBRANE ………..153
5
CONCLUSIONS………155
NOMENCLATURE………...158
REFERENCES………..161
6
ABSTRACT
Novel Lager Beer Clarification and Stabilisation Process
Using Ceramic Tubular Microfiltration Membranes
This PhD thesis dealt with the development of a novel combined system for lager beer clarification and stabilization using ceramic tubular microfiltration membranes to avoid the safety and environmental problems associated with the use and disposal of conventional filter-aids and to minimise the environmental impact of the current industrial beer downstream processing. The optimal operating conditions for this system were assessed on a bench-top plant, appropriately designed. The data obtained allowed the determination of the the predominant fouling mechanism and its reduction through appropriate centrifugal and enzymatic pretreatments on rough beer. The assessment of the operating cost of this novel procedure, as well as its environmental impact on climate change, was finally carried out by referring to an industrial brewery capacity.
Key words: CO2 backflushing; Carbon Footprint; ceramic tubular membranes; clarification;
fouling mechanisms; lager beer; microfiltration; optimal operating conditions; permeation flux; stabilization.
RIASSUNTO
Nuovo processo per chiarificare e stabilizzare la birra lager tramite membrane ceramiche tubolari di microfiltrazione
Questa tesi di dottorato ha riguardato lo sviluppo di un nuovo sistema per chiarificare e stabilizzare la birra lager, che prevede l’impiego di membrane tubolari ceramiche sia per evitare i problemi ambientali e di sicurezza associati all’uso ed allo smaltimento di farine fossili, sia per ridurre l’impatto ambientale dei processi industriali di finitura della birra. Le condizioni operative ottimali per questo sistema sono state determinate in un impianto da banco specificatamente progettato.
I risultati ottenuti hanno permesso di determinare e minimizzare il prevalente meccanismo di sporcamento, utilizzando opportuni pretrattamenti (centrifugazione e trattamento enzimatico) sulla birra torbida, si sono studiati anche i costi operativi e l’impatto ambientale per un ipotetico impianto di chirificazione e stabilizzazione di birra lager industriale
Parole chiave: birra lager; chiarificazione; condizioni operative ottimali; controlavaggio con CO2;
flusso di permeazione; impronta del carbonio; meccanismi di sporcamento; membrane tubolari ceramiche; microfiltrazione; stabilizzazione.
7 EXTENDED ABSTRACT
Novel Lager Beer Clarification and Stabilisation Process
Using Ceramic Tubular Microfiltration Membranes
1. Introduction
In accordance with the PhD thesis project previously described (Cimini, 2011), this oral communication reports the main results of the following four activities directed to:
A1) Assess the optimal operating conditions (i.e., feed superficial velocity, vS; transmembrane pressure
difference, TMP; membrane porosity; CO2 backflushing strategy) for the Cross Flow Microfiltration
(CFMF) process of rough beers obtained from commercial hopped-malt extracts using a bench-top plant, appropriately designed and equipped with ceramic tubular membrane modules, as well as their main beer characteristics accordingly to EBC (2010).
A2) Validate the above optimal operating conditions in terms of the average permeation flux (Jv,av) and
colloidal stability of microfiltered beer at 0 °C by using rough malt beers obtained in the pilot-scale brewery by the Italian Brewing Research Centre (CERB, Perugia, Italy), and a pale lager produced in an industrial brewery (Birra Peroni Spa, RM, IT) as such or after a few preliminary treatments. A3) Assess the fouling mechanisms for beer CFMF on the basis of the main dead-end filtration models. A4) Develop a novel combined system for clarifying and stabilizing lager beer at a commercial chill haze
of 0.6 EBC unit and assess the specific operating costs and global warming potential.
2. State of the Art
The clarification and pasteurization of rough beer are the final and most important processing steps in order to obtain a bright and microbiologically stable beer with no temporary haze after cold storage and/or serving temperatures. Green beer is currently filtered in presence of filter-aids (mainly diatomaceous earth, DE, or kieselguhr) and polyvinylpolypyrrolidone (PVPP) and then pasteurized. Since the crystalline silica present in DE is regarded as a cause of lung disease, DE use and recovery for either recycling or sludge disposal are not only problematic, but also expensive, DE sludge disposal costs being €170/Mg (Fillaudeau et al, 2006).
CFMF appears to be the only alternative to get rid of filter-aid disposal problems, reduce beer losses, enhance solid-handling capacity, and replace heat pasteurisation. Unfortunately, membrane fouling limits the average permeation flux (Jv,av) to about one fifth of that (250-500 L m-2 h-1) achievable with powder
filters (Buttrick, 2007). Moreover, unsatisfactory separation properties are responsible for some negative quality aspects, uncertainty in productivity, and large flux/quality variations among different beer brands as filtered on the same membrane system. Thus, more than 85% of all brewers still perform beer clarification with DE (Fillaudeau et al, 2007).
There is however a great deal of interest for this technique. Three commercial CFMF systems using hydrophilic, polyethersulphone (PES) membranes, with porosity of 0.45-0.65 m and hollow-fibre (Norit and Pall) or flat-sheet (Alfa Laval) modules, are currently available for beer clarification. In particular, both Pall and Alfa Laval processes rely on a pre-centrifugation step to remove yeast cells and larger aggregates, and thus minimise membrane fouling.
The main environmental issues associated with brewing include material, water and energy consumption, as well as waste production. Brewery processes are intensive users not only of both electrical and thermal energy, but also of good-quality water, their consumption being 8-12 kWh, 100-200 MJ and 4-7 hL per hL of beer produced, respectively (Olajire, 2012). Additionally, wastewater generation ranges from 1 to 5% of total beer production. Several studies have been so far carried out to check for the environmental impact generated through the entire life cycle of some types of beer (Cordella et al, 2008; Koroneos et al, 2005; Talve, 2001). Certification of the environmental performance of lager beer packed in disposable 33-cL glass bottles, 25-L steel kegs, or 20-L plastic drums was recently reported (EPD, 2011). The greenhouse gas (GHG) emissions due to the production process represented 15-18% of the overall ones, those associated to the upstream agriculture production or downstream processes, when including glass bottle production or steel keg distribution, being the greatest ones (Cordella et al, 2008; Koroneos et al, 2005; Talve, 2001).
8
2. Materials and Methods
Three different types of beer were used in this work. The rough beer labelled A was produced in the laboratory-scale, that labelled B, in the pilot-scale brewery at CERB (Perugia, Italy) and finally that labelled C at the brewery plant of Birra Peroni (Roma, Italy). Rough beer A and B were produced in 25-L lots from worts (density: 1.045 kg L-1) obtained by diluting hopped-malt extracts (Pils, Brewferm, Beverlo,
B) with tap water at 80 °C or by mashing 100% pils malt (Durst-Malz, Bruchsal-Heidelsheim, Bruchsal, D) and hopping with traditional bitter Hallertau Magnum hop pellets. Fermentation was started by adding 11.5 g of dry yeast of type Safale S-04 or Saflager W-34/70 (Fermentis, Marcq-en-Barœul, F), respectively. The corresponding fermentation temperature was kept constant at 20 or 12 °C for about 4 or 10 days, then was gradually lowered to 15 or 2 - 4 °C over the following 4 days. After racking, all rough beers were stored in stainless-steel maturation vessels and kept at 4 °C for about 15 or 30 days, respectively. The optimal operating conditions for beer clarification via CFMF were assessed using rough beer A as such, and were confirmed using rough beer B, as such or after pretreatments. Some samples were clarified using a laboratory centrifuge (Beckman mod. J2-21) at 6000xg and less than 4 °C for 10 min, once collected in 0.3-L plastic bottles. Others were mashed by adding 0.15 m0.3-L of a commercial Beerzym PENTA preparation (Erbslöh Geisenheim AG, Geisenheim, Germany) per L of rough beer at 4 °C for 24 h to degrade almost all the pentosans and -glucans present, and then centrifuged as reported above.
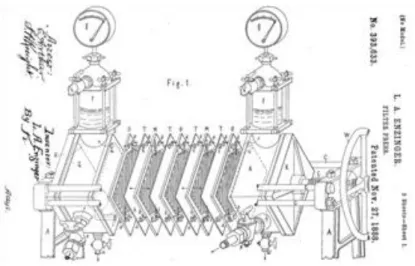
Beer clarification was carried out using a typical temperature- and pressure-controlled bench-top CFMF plant, appropriately designed and assembled (Fig. 1). It was equipped with ceramic tubular membrane modules (US Filter, Warrendale, PA, USA) with 6-mm inside diameter, 500-mm length, 94.2-cm2 effective
membrane surface area, and porosity of 0.4, 0.8, or 1.2 m. As suggested by Gan et al (1999), membrane cleaning was sequentially carried out by caustic and oxidation, and acidic cleanings. The water permeability at 20.0±0.1 °C for the 0.4-, 0.8-, or 1.2-m membrane module was 521±37, 773±17, or 1716±44 L m-2 h-1 bar-1 (r2 =0.99), respectively. A stainless steel Lowara centrifugal pump (Montecchio
Maggiore, I) was piloted using a 0.75 kW electric motor via a frequency inverter Commander SK (Control Techniques, Powys, UK). Feed and retentate pressure and flow rates were monitored using digital and analogical pressure and flow rate sensors.
Figure 1 Photograph of the bench-top CFMF plant used in this work. Equipment identification items: D, tank; E1, plate heat exchanger; FI, flow meter; G1, centrifugal pump; K, balance; MM, CFMF membrane module; PC, personal computer; PD, soft instrument panel; PI, manometer; TI, temperature indicator; VF, frequency inverter.
0 30 60 90 0 1 2 3 4 5 TMP [bar] Jv ,s s [L m -2 h -1 ]
Figure 2 Effect of TMP on the quasi steady-state
permeation flux (Jv,ss) of rough beer A samples with
turbidity >7 EBC unit at vS= 6 m s-1 and 10 °C using
ceramic tubular modules of different porosity: , 0.4
m; , 0.8 m;
9 The permeate flow rates were assessed via electronic balances K1 and K2, both connected to a PC. Total recycle runs were carried out at 10 °C by varying TMP and vS in the ranges of 1-5 bar, and 2-6 m/s,
respectively. Membrane cleaning with CO2 backflushing was periodically carried out at a backflush
pressure difference between the permeate and retentate sides of +3 bar for 2 min. The green beers and permeates were assayed for pH; density; viscosity; turbidity or haze (H) at 20 or 0 °C; colour; β-glucans, real or original extract, ethanol content, and total polyphenol concentration (Analityca EBC, 2010).
3. Results and Discussion
3.1 Assessment the Optimal Operating Conditions for CFMF of Rough Beer A
Previously (Cimini, 2012; Cimini and Moresi, 2013), the CFMF performance of samples of green beer A with initial turbidity of 1.1-12.0 EBC unit was studied in the bench-top plant, equipped with the 0.8-m membrane module, at 10 °C by varying vS and TMP in the ranges of 2-6 m s-1, and 0.96-4.73 bar,
respectively. In all conditions tested and independently of beer turbidity, the instantaneous permeation flux (Jv) showed a drastic reduction and tended to a quasi steady-state value (Jv,ss) after about 1 h. By
operating at TMP=3.73 bar, vS=6 m s-1, and turbidity of 1 or 4 EBC unit, an average permeation flux of
258 or 199 L m-2 h-1 was respectively achieved, thanks to periodic CO
2 back-flushing.
The effectiveness of such operating conditions was established with samples of rough beer A at hazes of 1.1-1.27 or >7 EBC unit using the above three membrane modules at 10 °C and TMP values progressively increasing from ~1 to 5 bar under a constant vS of 2, 4 or 6 m s-1. As the porosity was
increased from 0.4 to 1.2 m, Jv,ss exhibited an increasing limiting permeation flux for TMP>2 bar at vS=2
m s-1 or for TMP3-4 bar for v
S=4-6 m s-1 (see for instance Fig. 2). In terms of beer quality, the smaller
the pore size the higher the membrane retention for density and colour was found, whereas that for haze and viscosity was about constant. Despite its smaller Jv,ss, the 0.8-m module was selected owing to its
greater haze retention with just 6% reduction in the permeate colour against the 18% reduction obtained with the 0.4-m module, as well as to a presumed higher microorganism retention versus the 1.2-m module. Such a choice will be further validated (see below).
3.2 Establishment the Optimal Operating Conditions for CFMF of Rough Beer B
The effectiveness of the aforementioned operating conditions (TMP=3.74 bar, vS=6 m s-1, T=10 °C) for
the 0.8-m membrane module was further tested with rough beer B, as such or after a few pretreatments. Also in this case, the permeation flux reached the Jv,ss value after ~1 h whatever the beer turbidity (Cimini
et al, 2013). For H ranging from 0 to 2-3 EBC unit, Jv,ss drastically reduced and tended to an asymptotical
value of 91±8 L m-2 h-1 for H>7 EBC unit. Figure 3A compares the time course of the experimental
permeation fluxes (Jv) under periodic CO2 backflushing.
A B
Figure 3 Time course of (A) the permeation flux (Jv) and (B) overall hydraulic resistance (RT) under constant TMP (3.74 bar), vS (6 m/s), T (10 °C) and periodic CO2 back-flushing when using rough beer B samples as such (, 18 EBC unit), precentrifuged (, 1.5 EBC unit) or after enzymatical and centrifugal pretreatments (, 0.9 EBC unit). The horizontal broken line refer to the clean membrane hydraulic resistance (Rm).
0 500 1000 1500 2000 2500 0 100 200 300 Time [min] J v [ L m -2 h -1 ] 1.0E+11 1.0E+12 1.0E+13 1.0E+14 0 100 200 300 Time [min] R T [ m -1 ]
10 Thanks to the removal of most of suspended matter, the centrifugation step resulted in ~50 or 75% increase in Jv,ss (13713 L m-2 h- 1) or Jv,av (205 L m-2 h-1). The use of the enzyme preparation lowered the -glucan content from ~140 to 1.3 mg L-1, this avoiding gel layer formation or adsorption of finer
aggregates within the membrane pores. The observed Jv,ss (29430 L m-2 h-1) or Jv,av (336 L m-2 h-1)
values were more than two or three fold higher than those detected after the only centrifugation
Like the great majority of DE-filtered beers, those submitted to CFMF even at 0 °C still retained the soluble haze precursors responsible for post-filtration hazes. These are generally adsorbed with PVPP, alone or combined with selected carrageenan or silica xerogel (Rehmanji et al, 2005), or with agarose beads (Taylor et al, 2006).
As the permeates of beer B had been cooled to 0 °C, their chill haze ranged from 1.5 to 7.6 EBC unit. To obtain a brilliant, chill-proof and microbiologically stable beer, ready-to-be aseptically packaged, samples of beer B, after enzymatic mashing and centrifuging, were added with 0.3 or 0.5 g L-1 of regenerable
PVPP (size: 50-250 m) and fed to the CFMF module. Their initial total polyphenol content (224-297 mg L-1) was reduced by 20 or 40% and the permeate turbidity at 0 °C to 0.74 or 0.6 EBC unit, respectively;
but Jv,av fell to 84±4 L m-2 h-1
3.3 Assessment of the Main Membrane Fouling Mechanisms
To discriminate the membrane fouling mechanisms, the time course of the overall resistance (RT) to
filtrate flow was assessed in accordance with Darcy’s law (Bolton et al, 2006). As shown in Figure 3B, during the CFMF of rough beer B the overall resistance was definitively greater than that of clean membrane [Rm = (4.70.1) x 1011 m-1]. The pre-centrifugation step not only reduced the growth rate of
RT, but also approximately halved its maximum value to 0.88x10¹³ m-1. The enzymatic pre-treatment
further reduced RT to ~0.41x10¹³ m-1. Moreover, CO2 backflushing lowered RT to (5.2-8.1)x1011 m-1,
these values being quite near to Rm. In all cases, the time course of RT exhibited a downward concavity,
this being typical of intermediate blocking or external fouling due to cake filtration. According to Cimini et al (2014), the time course of the experimental filtrate volumes collected during constant TMP operations was satisfactorily reconstructed by using the cake fouling model (Bolton et al, 2006). This fouling mechanism congruently explained the efficacy of CO2 backwashing to restore the original
permeation flux.
3.4 Final validation tests for the combined stabilization and crossflow microfiltration of an industrial rough pale lager
Different lots of a pale lager, produced in the industrial brewery Birra Peroni (Rome, Italy), were used to confirm the optimal operating conditions previously established. A sequential clarification, PVPP stabilization and CFMF process was assessed using this industrial rough lager beer, as such or pre-centrifuged (C) to remove yeast cells and larger aggregates.
Contrary to previous testing on a malt-based rough beer containing as much as 140-250 mg L-1 of glucan (Cimini et al., 2013ab; 2014), the rough pale lager under study contained as little as (16.8±0.9) mg of -glucan L-1. In the circumstances, the β-glucanase and pentosanase pretreatment previously used
appeared to be useless. It was possible to limit the fouling contribution of yeast cells and aggregates during beer CFMF by the sequential steps of centrifuging, PVPP stabilization and cartridge filtration. In fact, the resulting average value of the permeation flux was about (337±1) L m-2 h-1 thanks to the periodic
CO2 backflushing. To assess the economic feasibility of this novel CFMF process with respect to the
conventional powder filters (DEF) when using single-use (SU) or regenerable (R) PVPP, a rough-grade feasibility study was carried out by referring to an industrial plant with an annual production capacity of about 3x10⁶ hL of lager beer, based on three shifts per day, 300 days per year. The use of regenerable
PVPP resulted to be beneficial whatever the filtration procedure used. Nevertheless, the use of CFMF together with regenerable PVPP reduced not only the overall beer clarification and stabilization costs (Co)
by ~36%, that is from €0.32 to €0.12/hL; but also the overall environmental impact by ~27%, that is from 2.25 to 0.60 kg CO2e/hL. The CFMF in conjunction with single use PVPP resulted in the minimum global
11 3.5 A novel beer clarification and stabilization process using CFMF membrane
To minimise the fouling contribution of yeast cells, aggregates and polysaccharides during CFMF and maximize the effectiveness of PVPP stabilization and regeneration, the process flow sheet shown in Fig. 4 was outlined.The same cylindro-conical tank D1 used to ferment the wort allows the yeast to settle to its bottom at the end of fermentation so as to be collected in tank D4. By feeding the rough beer to the centrifuge C1, a yeast cream is recovered and conveyed to D4, while the centrifuged beer is fed to tank D2. A thick slurry of regenerable PVPP is then added at a rate of 20 to 50 g per hL by a proportioning pump. An inert gas (CO2 or N2) is also sparged to ensure thorough dispersion and minimum O2 pick-up.
Figure 4 Schematic diagram of the novel lager beer clarification and stabilisation process using tubular ceramic microfiltration membranes developed in this work. Equipment identification items: C, centrifuge; D1, fermentation and maturation uni-tank; D2, PVPP treatment tank; D3, PVPP dosing tank; D4, yeast tank; D5, recovered beer tank; D6, PVPP slurry tank; D7, tank for cleansing solutions; MM1, CFMF membrane module for beer clarification; MM2, CFMF membrane module for beer recovery from yeast or PVPP slurry or for PVPP regeneration. Product, by-product and ancillary identification lines: Beer, ▬; Yeast, ; PVPP, - - - -. After a contact time of 24-48 h at ~0 °C, spent PVPP-polyphenol complexes are primarily removed by settling and accumulated in tank D6. Stabilized beer is pumped to the CFMF module MM1 (pore size: 0.8 or 1.2 µm). By setting the aforementioned operating variables, it is expected an average permeation flux of ~200 L m-2 h-1, and a bright, stabilised permeate ready for aseptically packaging with no
supplementary pasteurization step.
Another CFMF system MM2, equipped with ceramic tubular membrane modules too, is used to recover sequentially not only the remaining beer from either yeast or PVPP slurry, while its corresponding retentate is recirculated through tank D4 or D6; but also to regenerate used PVPP (Gopal and Rehmanji, 2000).
4. Conclusions and Future Perspectives
A combined clarification and PVPP stabilisation procedure using 0.8-m ceramic tubular membrane modules was developed and tested on a bench-top plant scale. By avoiding DE disposal problems and heat pasteurisation, and minimising beer losses, such a novel process appeared to be not only a reliable alternative to conventional powder filters in terms on the average permeation flux, but also a cost-effective one capable of mitigating the related life cycle GHG emissions. By referring to an industrial plant capacity of 2x10⁶ hL of lager beer, the estimated overall costs and global warming potential for
lager beer clarification and stabilization were about 30% smaller than those associated with the current industrial DE-filtration and regenerable PVPP stabilisation procedures.
12
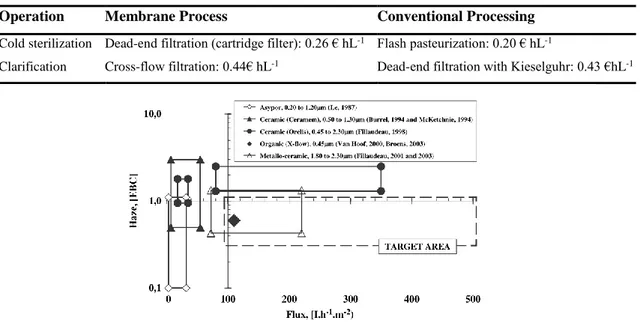
13
Beer clarification, stabilization, and pasteurization are the final and most important processing steps in order to obtain a bright and microbiologically stable beer with no temporary haze after cold storage and/or at serving temperatures.
Beer haze may be of the biological or non-biological type. The former is due the growth of either bacteria or wild yeasts, while the latter depends on some polypeptides and polyphenols originating from barley and hops that give rise to flocs responsible for the so called chill or permanent haze provided that it disappears or is persistent at room temperature (McMurrough et al. 1992; Siebert et al. 1996).
The conventional beer clarification process employs filter presses or pressure vessel filters, which are commonly pre-coated with filter aids in the form of porous particles, mainly of diatomaceous earth (DE or kieselguhr), but also of perlite, cellulose or active carbon, which play an important role not only in acting as a second filtration barrier, but also in adsorbing the chill haze components (Buttrick, 2007). This procedure has been successfully used for decades in beer filtration, but use of this material, as well as disposal of spent filter sludge, needs ensuring safe working conditions, having the World Health Organization ascertained that the crystalline silica present in DE causes lung disease. Thus, DE sludge disposal is currently the main cost (ca. € 170 per ton of DE purchased) of beer filtration (Fillaudeau et al. 2006; Knirsch et al. 1999).
Alternatively, a single step method based on cross-flow microfiltration (CFMF) might be used. The first research applying CFMF in the brewing industry dates back to the early 1980s (Gir & Leeder, 1992). Since then, this topic has been an area of intense research in order to get rid of filter-aid handling and disposal problems (Freeman & McKechinie, 1995), reduce beer losses (Lee, 1987), handle high suspended solid liquors, and replace heat pasteurization (Czekaj et al. 2000; Fillaudeau et al. 2006). Unfortunately, membrane fouling limits the average permeation flux (Jv,av) to about one
fifth of that (250-500 L m-2 h-1) practically achievable with powder filters (Buttrick, 2007; Fillaudeau et al., 2006). Moreover, unsatisfactory separation properties result in poor beer quality and uncertain productivity, especially when different beer brands are filtered on the same membrane system. Thus, nearly 99% of all brewers still perform beer clarification with DE (Anonymous, 2007).
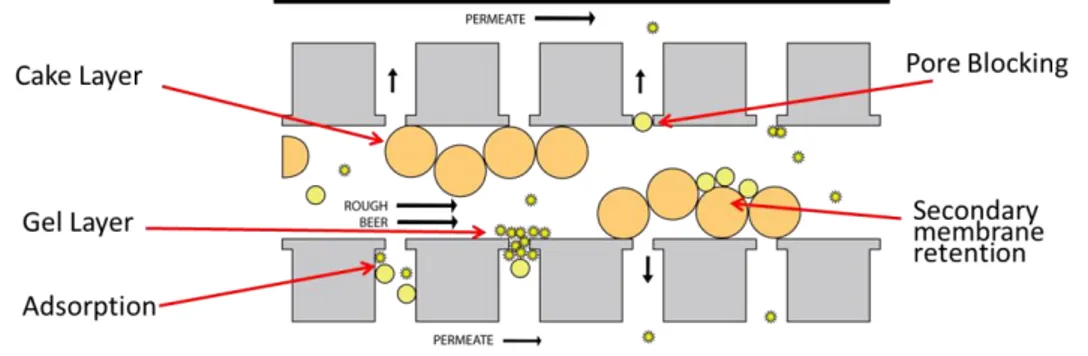
Beer is a complex fluid, with multiple compounds (i.e., yeast cells, proteins, polysaccharides and polyphenols) leading to different kinds of fouling. Generally
14
speaking, yeast cells tend to form a cake layer over the membrane surface, the thickness of which being controlled by the beer crossflow velocity. The internal fouling of membranes is attributed to arabinoxylans, -glucans, and hydrophilic (haze-forming) proteins and polyphenols (Gan et al. 1997, 2001; Taylor et al. 2001) as they penetrate inside the membrane itself and are adsorbed onto the membrane pore walls, this leading to pore constriction or blocking. The polysaccharides may also form complexes with proteins or gels (Güell and Davis, 1996), these entrapping other macromolecules or aggregates either in the cake layer or inside the membrane itself. Also, the complex interactions between fouling molecules and membrane material should be taken into account (Czekaj et al. 2000). Yeast cells may sometimes play an antifouling role by forming a less compact deposit at the membrane surface that acts as a secondary membrane, the latter retaining protein aggregates and protecting the membrane itself against internal fouling (El Rayes et al. 2011; Guëll et al. 1999). Whereas the cake layer and some of the aggregates accumulated within the porous membrane structure can be removed by short-term back-flushes, most of the proteins and aggregates adsorbed onto or inside the membrane are only removable by acid and/or alkaline cleaning enriched with oxidative agents (Gan et al, 1999).
Whilst the mechanisms of fouling and flux decline in beer microfiltration are currently better understood (Blanpain-Avet et al. 1999; Burrell et al. 1994; Gan et al., 1997; van der Sman et al. 2012), there is no systematic analysis of the dynamic and inter-dependent relationships between permeate quality, flux and membrane fouling.
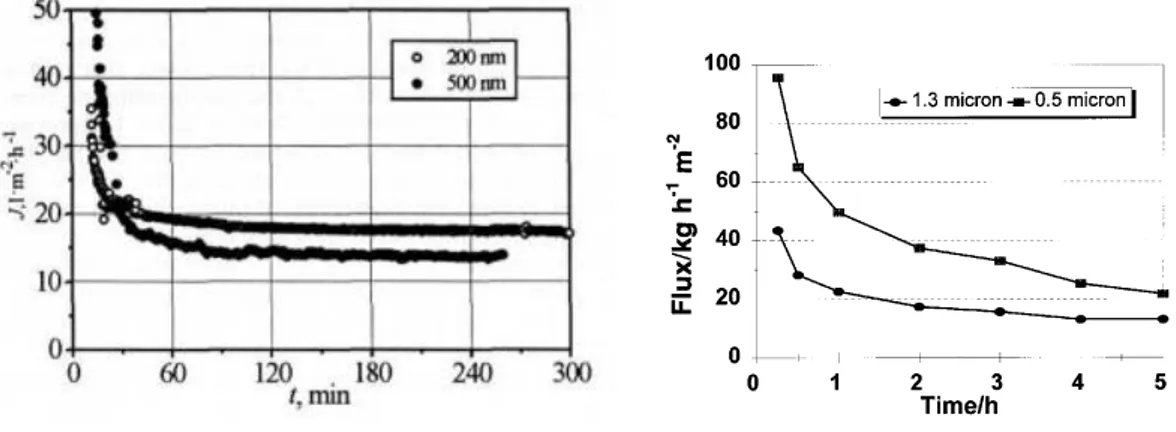
Membrane porosity affects not only the permeation flux (Stopka et al. 2000), but also the head retention values (Gan et al. 1997). By increasing the transmembrane pressure difference (TMPD), the beer permeation flux increases, but not proportionally (Thomassen et al. 2005). Feed superficial velocities of 0.87 - 7.2 m s-1 exerted a strong effect on the reversible external membrane resistance (Filladeau & Lalande, 1998). Generally, membrane fouling dramatically reduces the flux to far below the critical steady-state flux of 100 L m-2 h-1 (Filladeau et al. 2006). There is also detectable change in the beer quality after filtration (e.g., retention of flavor-active constituents and decrease in foam stability).
Several hydrodynamic techniques, using fluid instabilities (such as co-current mode, pulsating flow, periodic stop of TMPD, periodic back-flush or back-shock
15
process, generation of Dean or Taylor vortices, introduction of turbulence promoters as baffle channel or stamped membrane), two-phase flow (gas-liquid, liquid-solid), or rotating and vibrating filtration devices, have been so far investigated with poor results (Blanpain-Avet et al. 1999; Fillaudeau et al. 2007; Gan et al. 1997; Kuiper et al. 2002). To increase the permeate flux, a back-flushing with permeate was employed (Gan et al. 2001; Sondhi & Bhave, 2001) and a 10-h average flux of 22 kg m-2 h-1 was achieved. Nevertheless, the industrial plants using CFMF do not rely yet on such complex dynamic filtration technologies. In fact, at the Heineken brewery in Zoeterwoude (NL) about 10 m3 h-1 of rough beer are filtered through 0.45-m polyethersulphone (PES)
hollow-fiber (HF) modules accordingly to the so called Norit process at 0 °C, 2 m s-1 crossflow velocity, and TMPD up to 1.6 bar (Noordman et al. 2001). By applying 10-min periods of back-flushing every 2 h during filtration, the permeation flux was kept at 100 L m-2 h-1, while the beer permeated accomplished the EBC standards in terms of
turbidity near to 0.6 EBC unit, bitterness, total extract, color, and protein content. Nowadays, besides the above Norit process that makes use of a cylindro-conical tank to allow yeast to settle to its bottom before recirculating the rough beer through the CFMF modules, two other combined beer filtration processes, consisting of a high-performance centrifuge and 0.65-m PES, HF (Pall) or flat-sheet (Alfa Laval) membrane modules, are commercially available (Buttrick, 2007). It is still unclear whether the centrifugation stage is effectively convenient to minimize membrane fouling by yeast cells and larger aggregates, especially because of its quite high additional investment and operation costs.
Thus, the complexity of beer clarification makes the optimal performance of CFMF still far away to be assessed.
In synthesis, the main aims of this PhD thesis were:
A1) to assess the optimal operating conditions (i.e., feed superficial velocity, vS;
transmembrane pressure difference, TMPD; membrane porosity; CO2
backflushing strategy, BF) for the Cross Flow Microfiltration (CFMF) process of rough beers obtained from commercial hopped-malt extracts by using a bench-top plant, appropriately designed and equipped with ceramic tubular membrane modules, as well as the main beer characteristics accordingly to Analityca EBC (2010);
16
A2) to validate the above optimal operating conditions in terms of the average permeation flux (Jv,av) and colloidal stability of microfiltered beer at 0 °C by using
either rough malt beers obtained in the pilot-scale brewery by the Italian Brewing Research Centre (CERB, Perugia, Italy), or pale lagers obtained in the industrial brewery of Birra Peroni (Roma, Italy) as such or after a few pretreatments including centrifugation with or without enzymatic hydrolysis of the constitutive gel forming polysaccharides;
A3) to assess the main fouling mechanisms of rough beer CFMF by referring to the most important classical dead-end filtration models;
A4) to develop a novel combined system for clarifying and stabilizing rough lager beers at a commercial chill haze of 0.6 EBC unit and assessment of the operating costs and carbon footprint of a functional unit of 1 hL of microfiltered lager beer.
17
CHAPTER 1:
The State of the Art on Beer Production,
Quality and Environmental Impact
18
1.1 – BEER PRODUCTION, CONSUMPTION AND CONSUMER
Beer is the alcoholic beverage mostly consumed in the world. It is a very popular drink, not only because of its low alcohol content, but also for the extensive marketing and promotion activities carried out by multinational companies in almost every country in the world.
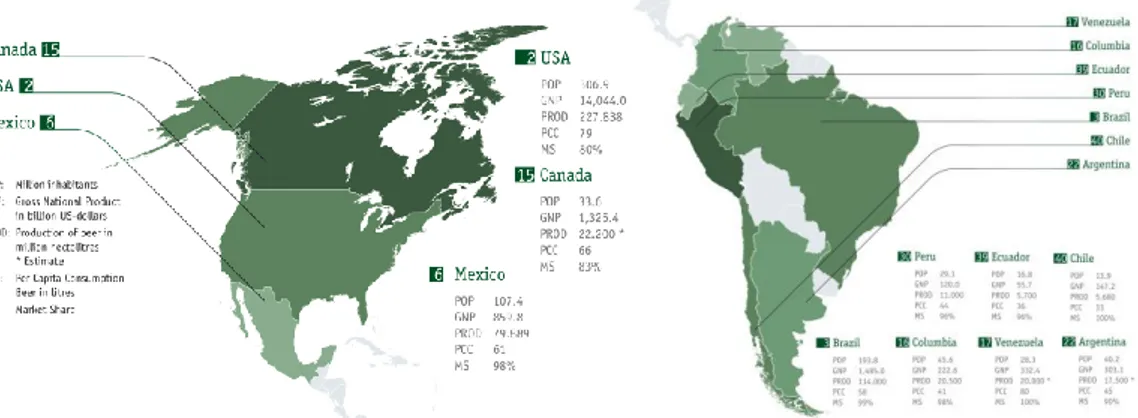
In the food industry, the brewing sector holds a strategic economic position, the annual world beer production having exceeded 1.8 billion hL in 2010 (Barth-Haas Group and Germain Hansmaennel, 2010)
Figure 1.1 Beer production in the North, Central and South America. (Haas Group and Germain Hansmaennel, 2010)
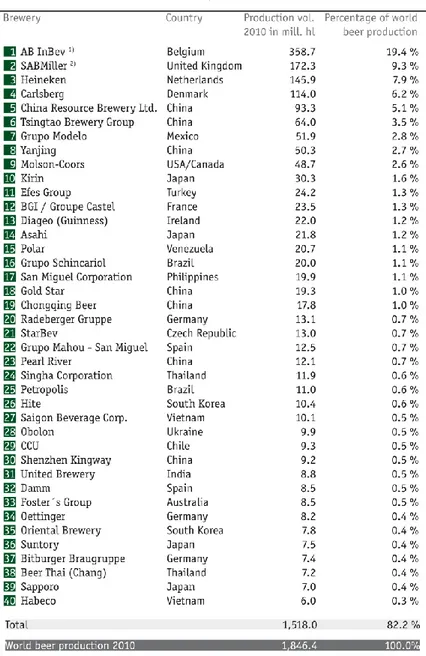
In spite of the general economic and financial crisis, in 2008 the worldwide beer market marked a growth of 1.6%, quite a half of the average growth rate of about 3% per year of previous years. In 2009, the global volumes of beer production and consumption were about at the same levels of the previous year. In 2010, the latest Barth Reports indicated a slight recovery in the world production of beer to 1.846 billion hL (Table 1), while the average per capita consumption was around 27 L/year.
According to the latest report Global Beer Market Trends (www.canadean.com), the worldwide beer market will grow until 2015 at an average annual rate of around 2.8%. However, global data mask large regional differences. In Asia, beer consumption is growing in a more accelerated way than in other continents. Asia has just conquered the world leadership with approx. 630 million hL produced, although per capita consumption is at the level of 15 L/year.
19
The top 10 brewing nations represented one third of the world population, but two thirds of global production of beer. The first nation is China, that produced 448 million hL of beer in 2010, with a per capita consumption of only 33 L/year, and just passed the historical primacy of the U.S. market.
According to the Global Beer Market Trends, the Chinese beer market is expected to reach 573 million hL by 2015, this representing over one quarter of all beer consumption in the world. Over the past 10 years, China has more than doubled the production and consumption of beer.
The U.S. market with 228 million hl of production in 2010 occupies the second place in the ranking of the world brewing nations.
Table 1.1 The 40 largest brewing groups in the world as of December, 31st,2010 (Haas Group and
Germain Hansmaennel, 2010)
20 Figure 1.2 Beer production in Asia, Africa and Australasia (Bath Report 2010-11)
Europe has lost its historical primacy in the production and consumption of beer. Just 5 years ago, Europe was the first continent in the world in terms of beer production. Now, it is back in the third place after Asia and America. In the European context, in the 2010 there was a confirm of the general downward trend, that began in 2008 (-1.4% compared to 2007) and worsened in 2009 (-4.4% compared to 2008) with a production of almost 387 million hL, down by –1.2% compared to the previous year.
Germany has maintained its historical primacy in beer production and consumption till 2007. Now, it is second in the ranking of European beer producing countries, with an annual production below 100 million hL. Russia is producing about 103 million hL of beer and is the fourth largest brewing capacity in the world.
Figure 1.3 Beer production in Europe (Haas Group and Germain Hansmaennel, 2010)
21
In 2010, the United Kingdom produced 45 million hL of beer and occupied the eighth place in the world and the third one in the European Union. Poland (34 million hL) and Spain (33 million hL) were on the fourth and fifth places in the European Union, respectively. The emerging Ukraine produces more than 30 million hL, followed by Holland (25 million hL), Belgium (18 million hL) and finally the Czech Republic (17 million hL).
The countries that traditionally consume the greatest amounts of beer in Europe are: Czech Republic (134 L/pro capita/year), Germany (107.4 L) and Austria (106 L) (Assobirra, 2011). The per capita consumption of beer in France and Italy, is quite lower (29 L/yr).
Italy is at the tenth place among the European beer-producing nations. Regarding beer consumption, the Italian per capita consumption declined from 31.1 L/yr in 2007 to 29.4 L/yr in 2008 and to 28 L/yr in 2009, but slightly increased to 28.6 L/yr in 2010. About three Italian adults out of four (72.4%), that is about 36 million people, consider themselves beer drinkers, while the 79.5% of all claims to drink wine. This is in contrast with the European beer consumption: after the peak of 2007, when the European per capita beer consumption exceeded 80 L/yr, it reduced by 12.6% to 69.9 L/yr. In 2010 in Italy both beer production (+0.3% compared to 2009) and per capita consumption increased (+2.1%). By comparing the performance of the Italian brewing sector with the European one, more than 350 production facilities (16 of which being industrial plants) and more than 1,500 differents brands can be accounted for. This involves an overall occupation, including related industries, of almost 150,000 people, thanks also to an increasing export, that nearly doubled in five years. The Italian brewing industry has thus shown some signs of recovery, confirming its role as a major player in the national economy: almost 13 million hL of beer products, just under 2 million hL of beer exported, 1 billion Euros spent on the purchase of goods and services, 4 billion Euros of revenue for state finances (Assobirra, 2011).
22
1.2 – BEER QUALITY PARAMETERS AND ANALYSIS
A number of scientific organizations carry out collaborative tests to specify the brewing analytical methods so as to confer them an official status. These organizations include:
American Society of Brewing Chemists (ASBC),
Brewery Convention of Japan (BCOJ),
European Brewery Convention (EBC),
Institute of Brewing and Distilling (IBD),
Mitteleuropaeische Brautechnische Analysenkommission (Central European
Brewing Technology Analysis Commission) (MEBAK).
The product quality attributes that consumers can directly perceive are the following:
flavor (odor, taste) and appearance (color, haze, and foam). These are frequently
assessed by sensory panels, but often also by analytical measurements, these being more precise, accurate and reproducible than panel results.
The required characteristics of a beer for sale depend upon the consumer being targeted and can be readily defined as in Fig. 1.4. However, it is product consistency and stability, that will be needed to retain brand loyalty.
Fig 1.4. Quality attributes of beer.
The main beer parameters to be measured and controlled to ensure the quality (and brewhouse efficiency) targets are listed in Table 1.2.
23 Table 1.2. Main beer analysis methods as extracted from Analytica (2010).
ANALYSIS METHOD
Specific Gravity of beer Pyknometer
Colour of beer Spectrophotometric
pH of Beer pH meter
Viscosity of Beer Glass Capillary Viscosimeter
Haze in beer Haze meters
Glucans Enzymatic
Alcohol in beer Distillation
Alcohol in beer Enzymatic method
OG, Original, Real, Apparent Extract Densimetric and distillation
Shelf-life of beer Haze formation
Alcohol Chill haze in Beer Test Chapon
Foam stability Rudin Test
1.2.1 Haze
A clear packaged beer will lost its original brilliance after prolonged storage time, especially if it is kept under not optimal temperature. Beer marketing asks for more stable beers, to exert all possible options about sales and promotion without worry on stability and product.
Beer hazes are of the biological type or non-biological one. Turbidity of beer could have no effect on the sensorial quality. Infection of bright beer with either bacteria or wild yeasts will produce a biological haze due to the growth of the invading organisms, that makes the beer usually sour and unacceptable. Today, biological infection is fairly rare owing to the use of pasteurization and sterile filtration. However, after a length of time, sterile beers develop a non-biological haze. The rate of development of such hazes determines the shelf-life of bottled and canned beers. Before beer shows any haze at room temperature (20 °C), it may form a chill haze if cooled to 0 °C, that re-dissolves at 20 °C unless it remains, thus resulting in the so called permanent haze. Chill hazes are obviously more problematic with lager beers, being served at 4 °C, than with ales.
Biological haze
Biological haze is caused by microbial contamination and is avoidable with care and use of best practice procedures. Providentially, beer is an inhospitable environment for
24
microbial growth. It has a low pH (in the range of 3.8–4.5), ethanol is present in a range of concentrations of 3–6% (v/v), there is a limited range of nutrients, hop acids are present, the environment is anaerobic and the liquid is carbonated. Most potential contaminants originate from raw materials. Barley can contain Fusarium species that can release mycotoxins or cause gushing (that is, the phenomenon provoking the spontaneous formation of a great number of fine bubbles within the volume of beer that quickly ascend and flows out of the bottle, immediately after its opening).
Barley can also carry bacteria, which may supply nitrosamines and cause filtration problems. Thus, contaminants can cause flavor deterioration, turbidity and potential health problems. Most breweries pasteurize beer to ensure stability, but with good hygiene and efficient filtration the use of this expensive and potentially damaging process can be reduced. In modern brewing, non-biological haze is the key problem.
Non-biological haze
The non-biological haze isolated from beer has a complex composition: Proteins : 57%
Polyphenolic substances: 29% Carbohydrates: 12% Minerals: 2%
There are three important types of non-biological haze:
Chill haze
Permanent haze
Other hazes
Chill haze becomes visible when the beer is cold to below 0 °C, but it will disappear when beer is warmed to room temperature. Chill haze is formed from polypeptides and polyphenols, but unlike permanent haze (which is insoluble) it is due to a soluble complex involving non-covalent bonds (Siebert et al., 1996). It will precipitate at low temperatures and form particles of 0.1–1 μm diameter. This will re-dissolve quickly if temperature rises. Chill haze can be partly removed from beer by filtration before packaging, provided that the beer is kept cold.
Permanent haze initially forms in the same manner as chill haze. However, the soluble complexes soon convert to insoluble complexes owing to the formation of covalent
25
bonds that will not dissolve after heating. The particle size is larger than that observed in chill haze, ranging from 1 to 10 μm diameter. The reactions are catalyzed by oxygen and metal ions and the amount of haze increases over time. The reaction is closely related to the amounts of haze-active polypeptides and polyphenols present (McMurrough et al., 1992). Indeed, it has been known for years that beer proteins and polyphenols are responsible for both colloidal and foam stability. Beer contains 300– 800 mg/L of raw proteins. Most of them are in the form of polypeptides with a molecular size of 5 to 100 kDa. Beer polypeptides originate primarily from barley. Much protein is broken down during malting into polypeptides and free amino nitrogen (FAN) or single amino acids by the activity of proteolytic enzymes. Only a small amount of protein is involved in beer haze: as little as 2 mg/l of protein is sufficient to cause a haze of 1 EBC (Chapon, 1994).
Polyphenols in beer originate from barley and hops. Polyphenols have been identified as having at least two roles in beer. Certain species are known to be responsible firstly for colloidal instability through binding with proteins, and secondly for flavor stability by protecting against oxidation (Whittle et al., 1999). The chill haze isolated from three different breweries was between 1.4 and 8.1 mg/L, while the permanent haze accounted for 6.6-14.6 mg/L (Carrington et al., 1972).
Beer contains from 100 to 300 mg/L of polyphenols (McMurrough and O’Rourke, 1997). These are also referred to as tannin, although not all polyphenols have the ability to tan animal skins. Two types are present in beer, the first group are derivatives of hydroxybenzoic and hydroxycinnamic acids, the second group are the flavanols and their derivatives (Hough et al., 1982). Flavanols account for around 10% of total beer polyphenols, and this group includes the species related to colloidal instability. During mash boiling, polyphenols will precipitate with protein. After boiling more polyphenols are lost in cold break, and later in cold conditioning. Catechin, epicatechin, and complexed flavanoids are responsible for haze formation. Two dimers have been particularly associated with haze formation, that is procyanidin B3 (catechin-catechin) and prodelphinidin B3 (gallocatechin-catechin), their structures being shown in Fig. 1.5. These are referred to as proanthocyanidins (also known to brewers as anthocyanogens) and originate from both barley and hops.
26 Figure 1.5 Structure of the main beer flavanol monomers and dimers (Siebert and Lynn, 1998).
The exact mechanism by which flavanoids bind to proteins and cause haze is uncertain. It has been proposed that the simple dimeric flavanols are too small to cause haze on their own and must polymerize into larger molecules (oligomers) before they are large enough to cause haze.
P and T refer to proteins and tannins, respectvly
Protein binding is due to the number and position of the hydroxyl groups (-OH) on the flavanoid aromatic rings. Thus, rings with only one -OH group are almost inactive, those with two are more active, especially when they are adjacent (vicinal), rings with three groups are even more active (Siebert and Lynn, 1997). In this way, prodelphinidin B3 is more haze-active than procyanidin B3 since gallocatechin has three vicinal -OH groups, while catechin just two ones (Fig. 1.5). Gallotannins, such as tannic acid, have eight or nine gallic acid units, each with three vicinal OH groups, connected to a glucose unit (Siebert and Lynn, 1998).
27 Figure 1.6 Haze formation in beer (Siebert et al. 1996b).
Siebert et al. (1996b) proposed a model for haze formation. Each polyphenol has two binding sites and each polypeptide has three binding sites. The greatest amount of haze will occur when the number of polyphenol binding sites is equal to the number of polypeptide binding sites. If there were more polypeptides than polyphenols, as in beer (Siebert et al, 1996b), two polypeptides could be joined, but it would be unlikely that any further binding could occur due to the shortage of polyphenols. If there was more polyphenol than polypeptide, all the polypeptide binding sites would be filled with polyphenols, but again there would be little chance of further binding due to the shortage of protein.
The protein-polyphenol complexes are initially too small to scatter light; thus, some kind of reaction has to take place with the precursors before haze can form. Siebert (1999) proposed two pathways. Firstly, simple flavanoids polymerize to form tannins, which then combine with protein and grow to produce haze. Secondly, already complex phenolics are oxidized; then, these active phenols combine with protein and grow to produce haze (Fig. 1.6). The second pathway is supported by the finding that labeled oxygen in beer headspace was found to be incorporated in beer haze.
28 Figure 1.7 Interaction model of haze formation in beer (Siebert et al., 1996a).
Raw materials are the source of haze precursors. In order to reduce the haze, some action can be taken on raw materials. Malt must be of good quality, in good condition and have a sufficient level of amylolytic enzymes. It is not certain if nitrogen modification of malt is related to protein stability. The use of adjuncts, such as syrup, rice and maize grits, dilutes haze-causing substances. Although haze-causing proteins are not significantly reduced, adjuncts derived from barley and wheat may increase the level of haze precursors. Wheat also increases the level of pentosans, but is good for foam stability. Malt with no proanthocyanidins (haze-causing polyphenols) is available. There are also some practical production issues to reduce the formation of haze in the final production: lower mash pH causes polyphenol precipitation, which is desirable as it removes haze precursors. Long run-offs extract more polyphenols, especially if the pH is allowed to rise. Excessive use of lauter rakes is as undesirable as sparging at too high a temperature. Shear damage as a result of transfer by piping and pumping, etc. should be avoided as this can contribute to haze. A good boil with agitation and turbulence is essential as it removes substances that could survive into the beer. Kettle fining removes substances that precipitate out of solution during wort cooling after boiling. Much protein is removed from wort as trub during boiling (hot break) and
29
during wort cooling (cold break). Apart from some loss of haze precursors in the cold break, little occurs during fermentation.
Cold conditioning is an important step of the process. Traditional brewing methods involved long maturation periods at 0-1 °C. Beer should be chilled as cold as possible without freezing to ensure precipitation of particulate matter. Filtration should be carried out at 0–2 °C after cold conditioning to allow particulates to settle. The beer should not be warm up at this stage to avoid chill haze particle dissociation and haze precursors release (Chapon, 1994).
Other hazes
These can result from substances different from proteins or polyphenols originating from raw materials, yeast, or process aids. Common constituents of such hazes are polysaccharides, such as glucans, mannans, starch and pentosans. The presence of β-glucan in beer causes filtration problems, as well as haze formation. These can be solved by using β-glucanase. Unfortunately, this practice is forbidden in some countries, like Germany in accordance with Reinheitsgebot law. In Italy, such a practice is allowed by the Ministerial Decree D.M. 19.11.1996 n° 68.
Haze was found to increase with increasing molecular mass and concentration of the added material. Shear stress, pH, maltose and ethanol also influenced haze formation. Haze caused by high-molecular mass β-glucans cannot be reduced by filtration or cold-conditioning.
Also oxalate, generally called beer stone, cause haze. It may form if the oxalic acid present in malt is not precipitated in the brew house because of low calcium levels.
Haze measurement
When light is passed through a suspension of a colored precipitate and the amount of reflection is negligible, the light absorption gives a measure of the turbidity according to Lambert’s law. With white precipitates, such as beer haze, much of the light is reflected so it is measured the light reflected at a given angle to the incident light. Most of the commercial instruments in use today take measurements at 90° to the incident light. The wavelength of the incident light also varies between instruments (350-860 nm). Even if the EBC, IoB, and ASBC refer turbidity measurements to the same primary haze
30
standard (i.e., formazin, obtained by reacting hydrazine sulfate with hexamethylenetetramine), the scales adopted are different (Fig. 1.8):
10.000 ASBC Formazin Turbidity units = 145 EBC Formazin haze units
1 EBC haze unit = 69 ASBC haze units
Figure 1.8 Comparison of haze scales (Analitica-EBC, 2010).
In most cases, visual assessment of beer haze correlates well with instrument readings for light scattered at 90°. However, some beers appearing bright to the eye give substantial meter readings and are said to contain invisible or pseudo haze. Such pseudo hazes are not observed with instruments using 13° forward light scattering.
Prediction assessment of haze stability in beer
A range of tests has been developed to assess the effectiveness of treatments. In general, there are two types of test available, that is the forcing or precipitative tests.
Forcing tests involve storing beer at elevated temperatures in an attempt to speed up the natural ageing process, that would occur if the beer were stored at room temperature. Thus, many months of storage can be reduced to a few days. Such tests are also known as accelerated ageing.
In precipitative tests, the chill haze is forced out on particular beer condition. Different brewing companies have their own preferred temperatures and incubation times with haze being measured before and after incubation. These procedures do not generally correlate with the results of actual shelf-life (Chapon, 1994), but are widely used as an indicator of beer stability or as a way of comparing different stabilizing products or dosing rates.
31
Colloidal shelf-life may be defined as the length of time before a beer displays a haze value of 2.5 °EBC (or 175 °ASBC) at 0 °C. There are two main types of tests: hot/cold cycling tests and precipitation tests (Lewis and Bamforth, 2007).
Hot/cold cycling tests
This test can be carried out in different way, just keeping the beer at 37 °C (1 week at this temperature is equivalent to 1 month of normal storage at 18 °C), or using different cycles of storage:
-at 60 °C for 2 days followed by storage at -2 °C for 1 day: (a single complete cycle is retained as equivalent to 6 weeks of normal storage),
-alternating 24-h cycles at 30 °C and 0 °C, a single complete hot/cold cycle approximating one month of normal storage.
Precipitation Tests
In the alcohol-chilling test (Chapon, 1994), ethanol is added to lower the beer temperature to -8 °C and chill haze is forced out within a total test time of 40 min. This test predicts only chill haze. Alternatively, haze-active proteins can be precipitated by the addition of tannic acid. Gallotannin can be replaced by a solution of saturated ammonium sulfate, and hence it is named as the SASPL test. In the first case, the amount of light scatter caused by a standard addition of tannic acid is measured. In the second, the number of milliliters of (NH4)2SO4 added to cause a measurable increase in
turbidity is recorded. The higher the salt needed to precipitate protein the lower the amount of precipitable protein in beer is. By using the polyvinylpyrrolidone monomer (PVP) as precipitant, tannoids can be quantified.
1.2.2 Flavor (oxidation and light)
The factors determining flavor robustness in beer are extremely complex, a myriad of chemical species combining to determine the rich complexity of beer aroma and taste. For the sake of simplicity, the first change in flavor is a perceptible decline in bitterness, and the beer may be perceived as harsh. There will also be a decline in fruity/estery and floral notes. Some beers will develop a ribes (blackcurrant buds, cat urine) aroma and most beers are claimed to develop a wet paper or cardboard character. Bready, sweet, toffee-like, honey, earthy, straw, hay, woody, winey and sherry-like are all notes that have been reported. Moreover, it is not entirely clear why displaying a pronounced age
32
character necessarily meet with disfavor in the marketplace. Stephenson and Bamforth (2002) also demonstrated that branding was of major significance in beer; however, when a given brand is identified there is a definite preference for the fresh version of that beer.
Achieving flavor stability is a major challenge, especially because the brewer cannot control what happens to the beer between packaging and consumption. As many as 600-700 substances contributing to beer flavor can be detected by the human taste and olfactory system, some at extremely low concentrations.
The extent to which a foodstuff, such as beer, will age in the marketplace can be described by resorting to the empirical formula given by Singh and Cadwallader (2003):
rQ = φ(Ci ,Ej)
where rQ is the rate of quality deterioration, that depends on Ci , a generic compositional
factor (e.g., content of reactive species, catalysts, inhibitors, pH, etc.), and Ej a generic
environmental factor (e.g., temperature, light, mechanical stress).
Although such a formula makes no attempt to weight the various parameters, it is clear that a change in any one of them will impact flavor stability. Among the environmental factors, oxygen concentration is the most extensively studied. Its concentration in wort and beer increases with the partial pressure of oxygen above the liquid level, but reduces with increasing temperature and strength of the wort and beer. Oxygen is much more soluble (seven to eightfold) in organic solvents than in water. This has seldom been taken into consideration when considering oxidation in brewing systems. The oxygen concentration in a localized lipid environment (e.g. mash and trub particles) may be somewhat greater than in the bulk aqueous phase. Bamforth and Parsons (1985) firstly drew attention to the role of active oxygen species rather than ground-state oxygen in potentiating flavor damage in beer. The principle basis for the toxicity of oxygen is via its conversion to reactive free-radical forms, or reactive oxygen species (ROS), as they are often now collectively termed, because not all damaging species produced from oxygen are radicals.
On the route from barley to a beer in the customer’s hand, apart from oxygen, the most dramatic impact on flavor stability is due to the temperature of beer storage. If the beer
33
temperature is raised by 10 °C, the rate of reactions, including those responsible for staling, increased from two- to three-fold.
Many flavor active compounds, present in uninfected beer, are capable of changing their levels during storage in the final package.
Prediction of flavor stability
Several researchers have developed forced ageing procedures. Typical regimes consist of holding beer at 60 °C for 24 h, 37 °C for 3 weeks, or 30 °C for 4 weeks prior to evaluation by tasting. These regimes are said to be good mimics for storage at 18 °C for 6 months. Another procedure involves shaking beer (to simulate transport, this factor being insufficiently considered in the context of flavor stability) and 4 days of storage at 40 °C. It is claimed that this is equivalent to storage at 20 °C for 3 to 4 months.
The main criticism to these accelerated regimes is that the flavors obtained at the higher temperatures are quite different to those developing during natural storage. As an alternative to tasting, some have advocated the chemical monitoring of species produced in forced ageing techniques. Thiobarbituric acid (TBA) has been used to measure carbonyl species produced on forced ageing, but TBA is not a very specific agent and preferentially reacts with malondialdehyde (HOCH=CH-CHO), that is but one of the breakdown products from unsaturated fatty acids. Another breakdown product is ethylene, which has also been cited as an indicator of staling potential. Other species are sometimes measured directly as indices of staling. Notable amongst these is furfural, which is not believed to directly contribute to staling per se, but it is felt that it is a good yardstick for oxidation. Others advocate the measurement of radicals by the application of Electron Spin Resonance technology (ESR). The endogenous antioxidant (EA) value is the time taken before an ESR signal is developed in an ageing test; the longer the lag, the greater the antioxidant potential of the sample.
1.2.3 Foam (stability and gushing)
Upon pouring a beer into a glass, the drinker will make judgments on the acceptability of the product, based solely on what his or her eyes are seeing. The presentation of the beer in the glass in terms of its foam head, clarity/brilliance and color are an anticipation for the perceptive drinker. Foam is perhaps one of the most appealing beer qualities. In
34
fact, the foam acts as an efficient gas exchange surface pitching aromas towards the drinker’s olfactory sensors. Foam is also tactile to the lips and impacts mouthfeel through its stability and its structure (bubble size).
The beer foam quality is based on the interaction of various beer components. To understand the principles of beer foam physics, many authors have enucleated the following fundamental but interrelated events (Bamforth et al, 2008)
● Bubble formation and size ● Drainage
● Creaming (bubble rise or beading) ● Coalescence
● Disproportionation
Even if beer is supersaturated with carbon dioxide, bubbles will not form spontaneously unless nucleation occurs (Fig. 1.9), promoted by a particle, fiber or scratch in the glass or the dispense mode, be that tap or bottle. These nucleation sites should ideally be small to create smaller bubbles that create a foam appealing to the drinker (Bamforth, 2004).
Figure 1.9 Schematic representation of the bubble formation sequence, (Ronteltap et al. 1991)
The factors governing the size of bubble that is generated in nucleation are described by
1/3 m b ρ g 2 γ R 3 R (1.1)
where Rb and Rm are the radii of bubble and nucleation site (m), γ is the surface tension
(N m-1), ρ the beer density (kg m-3), and g the acceleration due to gravity (9.8 m s-2) The radius of the nucleation site is very significant, but surface tension and density are less important.
35
Upon its formation, foam is usually termed to be wet. The excess beer in the foam rapidly drains by gravity to produce a dry foam. In the dry foam, continued beer drainage by gravity and suction along the Plateau borders (Fig. 1.10) weakens the bubble film, eventually leading to bubble collapse.
Ronteltap et al. (1991) observed that the counteracting forces to drainage are viscosity of the beer, capillary effects and beer surface viscosity. The influence of beer viscosity is consistent with beer foam, this being more stable at lower temperatures. This explanation was more recently simplified to conclude that surface viscosity as opposed to bulk viscosity was most important (Bamforth, 2004). In practice, this interpretation appears to be confirmed by the observation that polysaccharides, such as β -glucans, increasing bulk viscosity have a negligible influence on beer foam stability (Lusk et al., 2001a).
Figure 1.10 Schematic representation of foam drainage. (Prins and Marle, 1999)
Creaming or beading is defined as the formation of a dense foam, which should ideally be sustained for the duration of consumption (Bamforth, 2004). The nucleation activity, surface tension, beer density and CO2 content determine the level of creaming.
Accepting the central role of a nucleation site, it was found that CO2 content was the
most influential variable because the typical ranges for surface tension and density are usually not large enough to affect creaming.
an0 = 3.11 C + 0.0962 – 218 + 216 (1.2)
where a0n is the initial nucleation activity, γ and ρ are the beer surface tension and
density, and C is the volumetric carbon dioxide content (vol. CO2 /vol. beer).
Foam coalescence is defined as the merger between two bubbles caused by the rupture of the film between the bubbles to produce a larger, less stable and less appealing