SCUOLA DI DOTTORATO DI RICERCA Scienze e Biotecnologie dei Sistemi Agrari e Forestali e delle Produzioni Alimentari
Agrometeorologia ed Ecofisiologia dei Sistemi Agrari e Forestali
Ciclo XXVIII
A trait-based approach for forest ecology and
management
Tools for theoretical and applied ecology
Dr. José María Costa Saura
Direttore della Scuola: Prof. Antonello Cannas
Referente di Indirizzo: Prof. Donatella Spano
Docente Guida: Tutor:
Prof. Donatella Spano Dr. Simone Mereu
Table of contents
Abstract ... 5 Riassunto ... 6 Resumen ... 7 Key Abbreviations ... 8 Chapter 1. Introduction ... 9 A General Overview ... 9Objectives and Thesis Structure ... 14
Bibliography ... 16
Chapter 2. Background theory and methods ... 22
Trait-Based Ecology ... 22
Species Distribution Models ... 28
Remote Sensing ... 32
Climate Change Modeling ... 37
Bibliography ... 40
Chapter 3. Specific leaf area and hydraulic traits explain niche segregation along an aridity gradient in Mediterranean woody species ... 51
Abstract ... 51
Introduction ... 52
Materials and Methods ... 55
Results ... 59
Discussion ... 65
Conclusions ... 69
Bibliography ... 70
Chapter 4. Functionally diverse forest stabilize productivity against inter-annual
climatic variability ... 90
Abstract ... 90
Introduction ... 91
Materials and Methods ... 94
Results ... 98
Discussion ... 103
Conclusions ... 105
Bilbiography ... 106
Supporting Information ... 112
Chapter 5. Environmental filtering drives community specific leaf area in the Mediterranean and predicts changes under future climatic conditions ... 114
Abstract ... 114
Introduction ... 115
Materials and Methods ... 118
Results ... 121 Discussion ... 133 Conclusions ... 135 Bibliography ... 136 Supporting Information ... 141 General Conclusions ... 146 Acknowledgments ... 148
Abstract
Global change threats affecting forests require better understanding of mechanisms driving species environmental responses, but also species effects on ecosystems, to identify optimal management strategies for safeguarding the services they provide. Thus, this thesis serves on trait ecology and tools as Species Distribution Modelling, Remote Sensing, and Climate Change Modelling to explore ecological concepts that prove useful for determining specific management actions. Specifically we hypothesised about three main aspects: 1) the capacity of several traits to explain the characteristics of species niche in the Mediterranean; 2) the influence of trait diversity on the temporal stability of forest productivity in Temperate and Boreal zones; and 3) current and future effects of climate on the mean traits of Mediterranean forest communities. Forest inventories from Spain and Quebec (eastern Canada) were used to obtain species distribution and community composition whereas species traits values were retrieved from the literature. Main results showed that: 1) Specific Leaf Area (SLA) can be used to accurately represent species aridity limits in the Mediterranean; 2) trait diversity provides stability in Temperate forests; and 3) climate change may reduce SLA values of forest communities suggesting notable impacts on ecosystem functioning in the Mediterranean. The thesis suggests that management strategies should be based on trait ecology in order to best adapt to global change.
Riassunto
Le minacce del cambiamento globale sulle foreste richiedono una migliore comprensione dei meccanismi attraverso i quali le specie rispondono ai cambiamenti ambientali e influiscono sulle funzione ecosistemiche, permettendo di mettere in pratica delle strategie di gestione migliori per salvaguardare i servizi che loro forniscono. In questa tesi vengono utilizzati la trait ecology (cioè una ecologia basata sugli attributi funzionale delle piante) e tools come Species Distribution Modelling (Modelli di Distribuzione di Specie), Remote Sensing (Telerilevamento), e Climate Change Modelling (Modelli di Cambiamento Climatico) per esplorare dei concetti ecologici che servono per determinare le azioni specifiche di gestione forestale. Tre sono gli aspetti principali presi in esame: 1) la capacità di diversi tratti funzionali per spiegare le caratteristiche della nicchia in specie del Mediterraneo; 2) l‟influenza della diversità di tratti funzionali sulla stabilità temporale nella produttività delle foreste Temperate e Boreali; e 3) gli effetti attuali e futuri del clima sui tratti funzionali medi delle comunità forestali nel Mediterraneo. Gli inventari forestali della Spagna e del Quebec (est del Canada) sono stati utilizzati per ricavare la distribuzione geografica delle specie e la composizione delle comunità, mentre i valori dei tratti funzionali per ogni specie sono stati ricavati dalla letteratura scientifica. I risultati principali della tesi mostrarono che: 1) l‟area specifica fogliare (Specific Leaf Area, SLA) potrebbe essere utilizzata per rappresentare accuratamente i limiti massimi di aridità che le specie del Mediterraneo possono tollerare; 2) la diversità funzionale procura stabilità nella produttività delle foreste Temperate; e 3) il cambiamento climatico può ridurre i valori medi di SLA nelle comunità forestali del Mediterraneo, influenzando notevolemente le funzioni ecosistemiche. I risultati di questa tesi suggeriscono che, per un migliore adattamento al cambiamento globale, le strategie di gestione forestale devono essere basate su la trait ecology.
Resumen
Las amenazas del cambio global sobre los bosques requieren una mejor compresión de los mecanismos a través de los cuales las especies responden a cambios ambientales, y que a su vez influyen sobre los ecosistemas, con el objetivo de aplicar estrategias de gestión óptimas que permitan salvaguardar los servicios que estos proveen. El presente trabajo se sirve de la “trait ecology” (es decir una ecología basada sobre los rasgos funcionales de las plantas) y de herramientas como Species distribution Modelling (Modelos de Distribución de Especie), Remote Sensing (Teledetección), y Climate Change Modelling (Modelos de Cambio Climático) para explorar conceptos ecológicos que son útilies para determinar acciones concretas de gestión forestal. En esta tesis se ha hipotizado sobre tres aspectos principales: 1) sobre la capacidad de ciertos rasgos funcionales para explicar las características de nicho en especies forestales del Mediterráneo; 2) la influencia de la diversidad funcional sobre la estabilidad temporal de la productividad en comunidades forestales, tanto en zonas Templadas como Boreales; y 3) los efectos actuales y futuros del clima sobre los valores medios de los atributos funcionales en las comunidades forestales del Mediterráneo. Los datos del Invenatário Forestal Español y del Quebec (Este de Canada) fueron utilizados para obtener la distribución geográfica de las especies de estudio así como para determinar la composición de especies de las comunidades forestales. En cambio los valores de los rasgos funcionales de las especies fueron adquiridos a través de la literatura científica. Los resultados principales de la tesis han mostrado que: 1) El área específica foliar (Specific Leaf Area, SLA) puede ser utilizada para representar la máxima aridez que las especies en el Mediterráneo pueden tolerar; 2) la diversidad funcional proporciona estabilidad temporal en la productividad de los bosques Templados; y que 3) el cambio climático podría reducir los valores medio de SLA en las comunidad forestales del Mediterráneo sugiriendo notables impactos en el funcionamiento de los ecosistemas de esta región. Los resultados de la tesis muestran que para una mejor adaptación al cambio global las estrategias de gestión forestal pueden basarse en la “trait ecology”.
Key Abbreviations
AMT Annual Mean Temperature AP Annual Precipitation CV Coefficient Variation
CWM Community Weighted Mean EVI Enhanced Vegetation Index FD Functional Diversity
FT Functional Traits
Nmass Nitrogen leaf content per unit of mass
PLC50 The water potential at which 50% of hydraulic conductivity is lost
RCP Representative Concentration Pathways SDM Species Distribution Models
SLA Specific Leaf Area SM Safety Margin WD Wood Density
Chapter 1. Introduction
A General Overview
Forests benefits on humans are numerous and range from direct, tangible and traded products to indirect, less palpable and not marketed services (Bartczak et al., 2014). For instance, wood, cork, mushrooms, and resin are some examples of direct goods provided by forest, instead carbon store and sequestration, hydrological regulation, biodiversity conservation, soil protection, recreational services and cultural heritage represent those “less quantifiable” forest externalities from which humans also benefit (Bartczak et al., 2014). In addition, forests also provide work to 54 million people across the world, contribute to the shelter of 1.3 billion people, accounts for the 27% of the primary energy supply in Africa and about 90 million people in Europe and North America use energy coming from forests for domestic heating (FAO, 2014).
However, despite all those benefits, consequences of human activities as land use change, air pollution, and climate change are predicted to cause losses in biodiversity, and losses or deterioration of a number of services provided by forests (Liang et al., 2015). Indeed, deforestation is found to cause habitat alterations in terms of quality, amount and spatial configuration, which directly influence population vital rates (Hansen et al., 2001). Even so, forest area has decreased approximately 66 million ha during the period 1990-2005 (Lindquist et al., 2012) and the rate of loss has increased from 9.5 million ha year-1 in the decade 1990-2000 to 13.5 million ha year-1 in the period 2000-2005 (Fig.1.1).
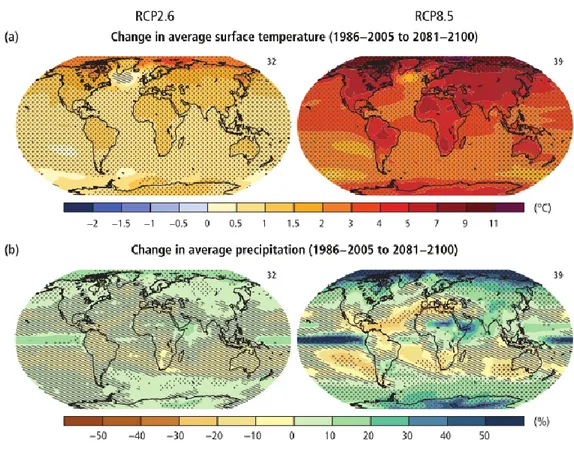
At the same time, because of human activities pre-industrial era greenhouse gas emissions have increased and reached the highest known atmospheric concentrations at least in the past 800,000 years (IPCC, 2014). Their consequences haven been already observed, and the period from 1993 to 2012 was warmest in the last 1,400 years (IPCC, 2014). In addition, nine of the ten warmest years have occurred since year 2000 (Hansen et al., 2010). Thus, models projected under different climatic scenarios predict an increase of global surface temperature (Fig.1.2) at the end of the 21st century from 0.3º
to 4.8ºC for 2.6 and 8.5 RCP scenarios, respectively (IPCC, 2014). Extreme events, (droughts, heat waves, storms) are also projected to increase in frequency while their magnitude has already increased in some areas by three to five standard deviations beyond historical averages (Hansen et al., 2013). Both extreme events and changes in climatic means have the potential to modify species distribution, forest age structure and species composition (Bakkenes et al., 2002; Thuiller et al., 2005), increase fire risk (Piñol et al., 1998) and pest attacks (Volney and Fleming, 2000), and consequently impact on ecosystem functioning (Chapin et al., 2000; Grimm et al., 2013).
Figure 1.1: Annual change in forest area by region (from FAO 2010)
Species mechanisms to respond to climatic changes involve acclimatization and phenotypic plasticity, adaptation, and migration (Bussotti et al., 2014): failure in these mechanism likely implies extinction (Thomas et al., 2004). Phenotypic plasticity (i.e. the diversity of phenotypes expressed by single genotype) allows fast and plastic response to environmental changes which is basic to plant acclimatization (Nicotra et al., 2010). However, plasticity is not equal for all traits and it “saturates” at specific limits (Chevin et al., 2010). Adaptation instead, reflects new genotype selection
according to the new environmental conditions but it is also constrained by genetic variability and genetic correlation among traits (i.e. two traits can be adaptive but negative genetically related, Etterson and Shaw, 2001). Migration, which refers to species geographical displacements, depends both on species dispersal ability and biotic interactions (Aitken et al., 2008). Thus, is not clear which mechanism will prevail under the great amount of different situations. Numerous studies analyzed the possible impacts of climate change on species distribution. For instance, Benito Garzón et al., (2009) studying Iberian tree species observed higher risks on Mountainous and Temperate species which are genetically different from central Europe populations, which suggest potential losses on genetic diversity. Thuiller et al., (2005) studying 1350 plant species from Europe also observed high threatens for Mountainous regions and predicted greatest changes in the transition between the Mediterranean and Euro-Siberian regions. Accordingly to projected changes in species distributions, species composition it is also expected to change (Walther, 2010). Bakkenes et al., (2002) predicted for large areas of Europe that more than 50% of the species composition will be formed by new species, and Frenette-Dussault et al., (2013) for Morocco steppes predicted changes from ruderal to stress-tolerant sub-shrubs species. Changes in species composition will likely lead to changes in ecosystem processes since species via their attributes mediate the energy and element fluxes on ecosystems (Chapin et al., 2000). Indeed, studies based on dynamic global vegetation models (DGVM) project reductions in net ecosystem production because of changes on vegetation types (Cramer et al., 2001). Despite the importance of DGVM for assess climate change impacts on ecosystem functioning, drawbacks due to functional simplifications of communities and coarse resolutions limit their use. Indeed, different studies suggest a trait-based approach for scaling up from community composition to ecosystem functions in order to best predict the consequences of global change (Chapin, 2003; Díaz and Lavorel, 2007; Suding et al., 2008).
Thus, these frameworks rely on trait based ecology which is promoting an exciting new research approach to classical questions in ecology and a promising tool to study the effect of climate change on forests and the services that they provide (Lavorel, 2013). Trait ecology is based on functional traits (FT), which are species-specific
characteristics (morphological, structural, physiological) that reflect the eco-physiology of the species and its ecological strategy (Violle et al., 2007). The great advantage of traits based ecology is that it unleashes the analysis from the species level and sets the ecological distance among species along a continuous axis represented by the value of one trait or a multidimensional space represented by multiple traits. Additionally, all the emerging links between one or multiple traits with specific eco-physiological process are giving a great contribution to the current trend towards a predictive ecology (Enquist et al., 2015) allowing to reduce uncertainties around the effects of global change on ecosystems. For instance, a trait-based approach proves useful to identify which plant attributes determine species environmental limits, that allow to predict changes in species composition and consequently their effects on ecosystem functioning. Indeed, trait ecology is required for forest management in order to deal with the challenges posed by climate change (Bussotti et al., 2014). For instance in restoration plans, the selection of appropriate species genotypes and provenances are suggested to be done according to the identification and quantification of those traits providing adaptation to future climatic conditions (Bussotti et al., 2014). Silvicultural strategies are also suggested to be oriented to improve competition of species with future suitable traits in order to accommodate changes adaptively (Millar et al., 2007). In addition to those adaptation actions, mitigation efforts can be improved with “trait-based silvicultural treatments” (i.e. managing species abundances to promote trait diversity and specific traits values) in order to increase carbon store and sequestration (Diaz et al., 2009; Ruiz-Benito et al., 2014).
Finally, it is noted that social awareness demands that scientists and public authorities unify efforts to halt the loss of biodiversity and to develop forest management policies oriented towards an optimization of ecosystem services while safeguarding from the effects of climate change. Indeed, a number of European policies and directives promote better understanding of ecological process for determining proper adaptation actions. For instance, i) The European Commission's White Paper „Adapting to climate change – Towards a European framework for action‟ (2009) recommends member states to include the development of methods, models and data sets to increase the predictive capacity to assess the cost and benefits of adaptation options; and ii) The EU Green
Paper on “Forest Protection and Information in the EU: Preparing forests for climate change” (EFI, 2010) states that “Safeguarding forest multi-functionality requires balanced management approaches based on adequate forest information”. Thus, this thesis explores the potentialities of trait-based ecology for understanding different ecological process that prove useful for forest management under this changing world.
Figure 1.2: Change in average surface temperature (a) and in average precipitation (b) based on multi-model mean projections for 2081–2100 relative to 1986–2005 under the RCP2.6 (left) and RCP8.5 (right) scenarios (from IPCC 2014).
Objectives and Thesis Structure
The main objective of this thesis is to integrate trait based ecology with well stabilised tools (i.e. Species Distribution Modelling, Remote Sensing, and Climate Change Modelling, see chapter 2 for a general overview of these tools) in order to investigate the role of plant functional traits on different ecological aspects that closely link with the environmental response and functioning of forests. Thus, this thesis through its three research works, explores different ecological theories to provide forest managers new instruments and background information for dealing with the challenges posed by global change.
The first research work, addressed in chapter 3, serves on Species Distribution Models (SDM) to determine how specific functional traits (FT) shape species niche in the Mediterranean. Despite the great number of literature addressing general patterns of trait variability across environmental gradients (Cornwell and Ackerly, 2009; Reich et al., 2003; Wright et al., 2005), little is known about how FT determine the different characteristics of species niche, e.g. species climatic limits or climatic optimums (but see Stahl et al., 2014). Thus based on environmental filtering theory (Keddy, 1992), we explore if traits associated with drought adaptation can explain those niche characteristics related with aridity (i.e. the arid limits of species and their optimal values). In addition, it was studied if those niche predictions can be improved combining different traits. The study allow forest managers to identify which traits determine species arid limits providing useful information for species selection in restoration plans and climate change adaptation actions.
The second research work, addressed in chapter 4, uses remote sensing data to assess if communities with a higher diversity in traits are more temporal stable in terms of productivity (i.e. stable against climate fluctuations). Despite accumulated evidence on biodiversity positive effects on forest productivity (Paquette and Messier, 2011; Ruiz-Benito et al., 2014), much less evidence exists regarding its effect on forest stability. Indeed, studies have been focalized on grass communities (Cardinale et al., 2013; Hector et al., 2010; Tilman, 1996) and only Jucker et al., (2014) explored those effects on forests. In addition, the diversity effect has been traditionally tested using species
richness or broad functional characterization of communities (i.e. into categorical plant functional types) which not account for the potential effect of species differences in trait values (i.e. a continuous axis of functioning). Thus, for Temperate and Boreal forests we assess the biodiversity-stability effect (i.e. the insurance hypothesis, Yachi and Loreau, 1999) controlling simultaneously the influence of potential confounding factors such as dominant trait values within communities and climatic effects. The approach used in this study is easily applicable on other regions and provides foresters an approach to orient silvicultural strategies for dealing with climatic fluctuations induced by global change.
Finally, the third research work which is addressed in chapter 5, presents a novel approach based on environmental filtering theory (Keddy, 1992; Weiher and Keddy, 1995) for assessing climate change impacts on the functional structure of woody plant communities in the Mediterranean. The study stress the hypothesis that dominant trait values of communities (i.e. community weighted mean trait, CWM) will change in future because of new environmental conditions (i.e. climate change) suggesting important changes in ecosystem functioning. The approach overcomes drawbacks of others approaches as functional simplifications (Scheiter et al., 2013) or assumptions on variations in species pools (Frenette-Dussault et al., 2013). Thus, this study provides forest managers an approach to identify major risk zones predicting the magnitude of change in CWM values which proves useful to orient forest management practices in order to adapt to climate change.
Bibliography
Aitken, S.N., Yeaman, S., Holliday, J. a., Wang, T., & Curtis-McLane, S. 2008. Adaptation, migration or extirpation: climate change outcomes for tree populations. Evolutionary Applications 1: 95–111.
Bakkenes, M., Alkemade, J.R.M., Ihle, F., Leemans, R., & Latour, J.B. 2002. Assessing effects of forecasted climate change on the diversity and distribution of European higher plants for 2050. Global Change Biology 8: 390–407.
Bartczak, A., Giergiczny, M., Jacobsen, Jette Bredahl Mavsar, R., Mäntymaa, E., Ovaskainen, V., Varela, E., Pettenella, D., Thorsen, B.J., Tyrväinen, L., Vedel, S.E., & Wunder, S. 2014. The Provision of Forest Ecosystem Services: Quantifying
and valuing non-marketed ecosystem services (B. J. Thorsen, R. Mavsar, L.
Tyrvainen, I. Prokofieva, & A. Stenger, Eds.). EFI, Joensuu, FI.
Benito Garzón, M., Sánchez de Dios, R., & Sainz Ollero, H. 2009. Effects of climate change on the distribution of Iberian tree species. Applied Vegetation Science 11: 169–178.
Bussotti, F., Pollastrini, M., Holland, V., & Bruggemann, W. 2014. Functional traits and adaptive capacity of European forests to climate change. Environmental and
Experimental Botany 111: 91–113.
Cardinale, B.J., Gross, K., Fritschie, K., Flombaum, P., Fox, J.W., Rixen, C., Van Ruijven, J., Reich, P.B., Scherer-Lorenzen, M., & Wilsey, B.J. 2013. Biodiversity simultaneously enhances the production and stability of community biomass, but the effects are independent. Ecology 94: 1697–1707.
Chapin, F.S. 2003. Effects of plant traits on ecosystem and regional processes: A conceptual framework for predicting the consequences of global change. Annals of
Botany 91: 455–463.
Chapin, F.S., Zavaleta, E.S., Eviner, V.T., Naylor, R.L., Vitousek, P.M., Reynolds, H.L., Hooper, D.U., Lavorel, S., Sala, O.E., Hobbie, S.E., Mack, M.C., & Díaz, S. 2000. Consequences of changing biodiversity. Nature 405: 234–42.
Chevin, L.M., Lande, R., & Mace, G.M. 2010. Adaptation, plasticity, and extinction in a changing environment: Towards a predictive theory. Plos Biology 8: 1–8.
Commission of the European Communites. 2009. White Paper. Adapting to climate
change: Towards a European framework action. Brussels,BE.
Cornwell, W.K., & Ackerly, D.D. 2009. Community Assembly and Shifts in Plant Trait Distributions across an Environmental Gradient in Coastal California. Ecological
Monographs 79: 109–126.
Cramer, W., Bondeau, A., Woodward, F.I., Prentice, I.C., Betts, R. a., Brovkin, V., Cox, P.M., Fisher, V., Foley, J. a., Friend, A.D., Kucharik, C., Lomas, M.R., Ramankutty, N., Sitch, S., Smith, B., White, A., & Young-Molling, C. 2001. Global response of terrestrial ecosystem structure and function to CO2 and climate change: Results from six dynamic global vegetation models. Global Change
Biology 7: 357–373.
Diaz, S., Hector, A., & Wardle, D. a. 2009. Biodiversity in forest carbon sequestration initiatives : not just a side benefit. Environmental Sustainability 1: 55–60.
Díaz, S., & Lavorel, S. 2007. Incorporating plant functional diversity effects in ecosystem service assessments. Proceedings of the National Academy of Sciences 104: 20684–20689.
EFI. 2010. Green Paper Forest Protection and Information in the EU : Preparing
forests for climate change. Joensuu, FI.
Enquist, B.J., Norberg, J., Bonser, S.P., Violle, C., Webb, C.T., Henderson, A., Sloat, L.L., & Savage, V.M. 2015. Scaling from Traits to Ecosystems: Developing a General Trait Driver Theory via Integrating Trait-Based and Metabolic Scaling Theories. In Pawar, Woodward, & Dell (eds.), Advances in Ecological Research.
Trait-Based Ecology - From Structure to Function, pp. 249–317. Elsevier Ltd.
Etterson, J.R., & Shaw, R.G. 2001. Constraint to adaptive evolution in response to global warming. Science 294: 151–154.
forest. Rome, IT.
Frenette-Dussault, C., Shipley, B., Meziane, D., & Hingrat, Y. 2013. Trait-based climate change predictions of plant community structure in arid steppes. Journal of
Ecology 101: 484–492.
Grimm, N.B., Chapin, F.S., Bierwagen, B., Gonzalez, P., Groffman, P.M., Luo, Y., Melton, F., Nadelhoffer, K., Pairis, A., Raymond, P. a., Schimel, J., & Williamson, C.E. 2013. The impacts of climate change on ecosystem structure and function.
Frontiers in Ecology and the Environment 11: 474–482.
Hansen, A.J., Neilson, R.P., Dale, V.H., Flather, C.H., Iverson, L.R., Currie, D.J., Shafer, S., Cook, R., & Bartlein, P.J. 2001. Global Change in Forests: Responses of Species, Communities, and Biomes. BioScience 51: 765–779.
Hansen, M.C., Potapov, P. V, Moore, R., Hancher, M., Turubanova, S. a, Tyukavina, A., Thau, D., Stehman, S. V, Goetz, S.J., Loveland, T.R., Kommareddy, A., Egorov, A., Chini, L., Justice, C.O., & Townshend, J.R.G. 2013. High-resolution global maps of 21st-century forest cover change. Science 342: 850–853.
Hansen, J., Ruedy, R., Sato, M., & Lo, K. 2010. Global surface temperature change.
Reviews of Geophysics 48: 1–29.
Hector, A., Hautier, Y., Saner, P., Wacker, L., Bagchi, R., Scherer-Lorenzen, M., Sphen, E.M., Bazeley-White, E., Weilenmann, M., Caldeira, M.C., Dimitrakopoulus, P.G., Finn, J.A., Huss-Danell, K., Jumpponen, A., Mulder, C.P.H., Palmborg, C., Pereira, J., Siamantziouras, A.S.D., Terry, A.C., Troumbis, A.Y., Schmid, B., & Loreau, M. 2010. General stabilizing effects of plant diversity on grassland productivity through population asynchrony and overyielding.
Ecology 91: 2213–2220.
IPCC. 2014. Climate Change 2014: Synthesis Report. Contribution of Working Groups
I, II and III to the Fifth Assessment Report of the Intergovernmental Panel on Climate Change (Team Core Writing, R. K. Pachauri, & L. A. Meyer, Eds.).
Geneva, CH.
diversity on aboveground wood production in forest ecosystems: linking patterns and processes. Ecology Letters 17: 1560–1569.
Keddy, P. 1992. Assembly and response rules: two goals for predictive community ecology. Journal of Vegetation Science 3: 157–164.
Lavorel, S. 2013. Plant functional effects on ecosystem services. Journal of Ecology 101: 4–8.
Liang, J., Watson, J. V., Zhou, M., & Lei, X. 2015. Effects of productivity on biodiversity in forest ecosystems across the United States and China. Conservation
Biology. doi: 10.1111/cobi.12636
Lindquist, E.J., D‟Annunzio, R., Gerrand, A., MacDicken, K., Achard, F., Beuchle, R., Brink, A., Eva, H.D., Mayaux, P., San-Miguel-Ayanz, J., & Stibig, H.-J. 2012.
Global forest land-use change 1990-2005. Rome, IT.
Millar, C.I., Stephenson, N.L., & Stephens, S.L. 2007. Climate change and forest of the future: Managing in the face of uncertanity. Ecological Applications 17: 2145– 2151.
Nicotra, A.B., Atkin, O.K., Bonser, S.P., Davidson, a. M., Finnegan, E.J., Mathesius, U., Poot, P., Purugganan, M.D., Richards, C.L., Valladares, F., & van Kleunen, M. 2010. Plant phenotypic plasticity in a changing climate. Trends in Plant Science 15: 684–692.
Paquette, A., & Messier, C. 2011. The effect of biodiversity on tree productivity: from temperate to boreal forests. Global Ecology and Biogeography 20: 170–180.
Piñol, J., Terradas, J., & Lloret, F. 1998. Climate warming, wildfire hazard, and wildfire occurrence in coastal eastern Spain. Climatic Change 38: 345–357.
Reich, P., Wright, I., Cavender-Bares, J., Craine, J.M., Oleksyn, J., Westoby, M., & Walters, M. 2003. The evolution of plant functional variation: traits, spectra, and strategies. International Journal of Plant Sciences 164: 143–164.
Ruiz-Benito, P., Gómez-Aparicio, L., Paquette, A., Messier, C., Kattge, J., & Zavala, M.A. 2014. Diversity increases carbon storage and tree productivity in Spanish
forests. Global Ecology and Biogeography 23: 311–322.
Scheiter, S., Langan, L., & Higgins, S. 2013. Next generation dynamic global vegetation models: learning from community ecology. New Phytologist 198: 957– 969.
Stahl, U., Reu, B., & Wirth, C. 2014. Predicting species ‟ range limits from functional traits for the tree flora of North America. Proceedings of the National Academy of
Sciences of the United States of America 111: 13739–13744.
Suding, K.N., Lavorel, S., Chapin, F.S., Cornelissen, J.H.C., Díaz, S., Garnier, E., Goldberg, D., Hooper, D.U., Jackson, S.T., & Navas, M.L. 2008. Scaling environmental change through the community-level: A trait-based response-and-effect framework for plants. Global Change Biology 14: 1125–1140.
Thomas, C.D., Cameron, A., Green, R.E., Bakkenes, M., Beaumont, L.J., Collingham, Y.C., Erasmus, B.F.N., De Siqueira, M.F., Grainger, A., Hannah, L., Hughes, L., Huntley, B., Van Jaarsveld, A.S., Midgley, G.F., Miles, L., Ortega-Huerta, M.A., Peterson, A.T., Phillips, O.L., & Williams, S.E. 2004. Extinction risk from climate change. Nature 427: 145–148.
Thuiller, W., Lavorel, S., Araújo, M.B., Sykes, M.T., & Prentice, I.C. 2005. Climate change threats to plant diversity in Europe. Proceedings of the National Academy
of Sciences of the United States of America 102: 8245–8250.
Tilman, D. 1996. Biodiversity: population versus ecosystem stability. Ecology 77: 350– 363.
Violle, C., Navas, M.L., Vile, D., Kazakou, E., Fortunel, C., Hummel, I., & Garnier, E. 2007. Let the concept of trait be functional! Oikos 116: 882–892.
Volney, W.J. a, & Fleming, R. a. 2000. Climate change and impacts of boreal forest insects. Agriculture, Ecosystems & Environment 82: 283–294.
Walther, G.R. 2010. Community and ecosystem responses to recent climate change.
Philosophical Transactions of the Royal Society B: Biological Sciences 365: 2019–
Weiher, E., & Keddy, P. 1995. Assembly rules, null models, and trait dispersion: new questions from old patterns. Oikos 74: 159–164.
Wright, I.J., Reich, P.B., Cornelissen, J.H.C., Falster, D.S., Groom, P.K., Hikosaka, K., Lee, W., Lusk, C.H., Niinemets, Ü., Oleksyn, J., Osada, N., Poorter, H., Warton, D.I., & Westoby, M. 2005. Modulation of leaf economic traits and trait relationships by climate. Global Ecology and Biogeography 14: 411–421.
Yachi, S., & Loreau, M. 1999. Biodiversity and ecosystem productivity in a fluctuating environment: the insurance hypothesis. Proceedings of the National Academy of
Chapter 2. Background theory and methods
Trait-Based Ecology
Functional traits (FT) are species-specific characteristics (morphological, physiological and phenological) that reflect the ecological strategy of species but also its effects on ecosystems (Violle et al. 2007). The great advantage of traits based ecology is that it unleashes the analysis from the species level and sets the ecological distance among species along a continuous axis represented by the value of one trait (or in a multidimensional space when multiple traits are used). Additionally, since FT are proxies of eco-physiological processes, there use allows to identify the underlying biological mechanisms reducing the hidden uncertainty of empirical models and favouring the current trends towards a more predictive ecology (Enquist et al. 2015).
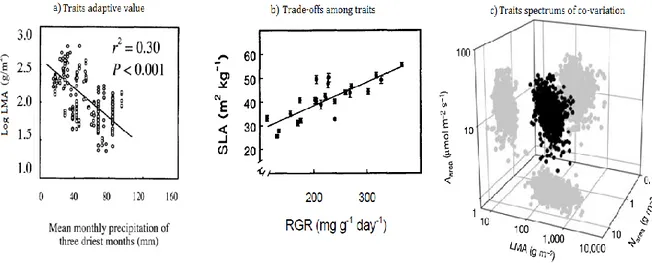
FT represent plant “decisions” on where to allocate resources with consequences in terms of growth and survival (Fig. 2.1 and Table 2.1, Reich, 2014). For instance, species with low Specific Leaf Area (i.e. low leaf area per unit of mass, SLA) are common in harsh environments (e.g. dry or cold, Niinemets, 2001; Reich et al., 2003; Wright et al., 2005). Low SLA values (i.e. expensive leaves, Villar and Merino, 2001) are associated with tissue reinforcement which prevents cell damages during dry events enhancing plant performances in arid environments (Poorter et al. 2009; Micco & Aronne 2012). PLC50 (i.e. the water potential at which 50% of hydraulic conductivity is lost) is also a trait usually correlated with precipitations (Maherali et al. 2004; Choat et al. 2012), indeed, species with low PLC50 have great xylem cavitation resistance which is an advantage in arid environments.
However, plant investment in one trait is often not independent from investment in other traits resulting in trade-offs among traits and their functions (Fig. 2.1). For instance, species with low SLA (i.e. species investing in expensive stress adapted leaves) are also found to have low relative growth rates suggesting a trade-off between fast growth and stress resistance (Poorter 1989). Instead, greater cavitation resistance (i.e. low PLC50) is associated with low hydraulic conductance suggesting a trade-off
among hydraulic dysfunction resistance and efficiency (Hacke & Sperry 2001; Nardini et al. 2012). In addition, multiple traits can also vary simultaneously evidencing single axis of traits co-variation. For instance, the best know example is the “worldwide leaf economic spectrum” (Wright et al. 2004) which shows the co-variation at global scale of SLA, leaf nitrogen content (Nmass), leaf photosynthetic capacity (Amass), and leaf
life-span (LLS), which represents a trade-off among the “construction and maintenance costs of leaves, and duration of photosynthetic returns from those investments” (Westoby et al. 2013). The existence of a “worldwide wood economic spectrum” has been also suggested, which relates traits as wood density, PLC50, conduit diameter and size, hydraulic conductivity and the modulus of elasticity and rupture of wood (Chave et al. 2009). However the same authors suggested that more empirical support is needed to evidence trade-offs among hydraulic efficiency, cavitation resistance and mechanical resistance.
Figure 2.1: Correlations within traits and environment. a) Leaf Mass Area (LMA, i.e. 1/SLA) increased with site aridity (from Niinemets, 2001), b) trade-offs among SLA and species relative growth rate (RGR, from Poorter and Remkes, 1990), and c) the worldwide correlations among leafs traits (from Wright et al., 2004).
The co-variation among traits may be due to causal links. For instance, Amass co-varies
photosynthetic enzymes on leaves (i.e. Nmass, Reich et al., 1999). Instead, PLC50
co-varies with conduit wall strength since cavitation resistance depends (among other factors) on conduit implosion resistance (Hacke et al. 2001). Nevertheless, co-variation may be observed even if traits are mechanistically and/or physiological independent because different combinations of traits may be adopted by species to maximize their performance in a given environmental condition (Maire et al. 2013). Thus, despite leaf and hydraulic traits can represent independent trait dimensions (Brodribb et al. 2003; Li et al. 2015), their coordination under drought conditions might improve fitness (Manzoni 2014). Indeed, Markesteijn et al., (2011) in tropical dry forest observed that species with greatest xylem cavitation resistance had also lowest leaf turgor loss point and great modulus of elasticity (i.e. great leaf wilting resistance).
FT are also seen as species mechanisms through which they influence ecosystems (Table 2.1). Since specific traits directly represent resource processing at plant level (e.g. light, carbon and nitrogen) they directly mediate energy and material fluxes on ecosystems (Chapin et al. 2000; Garnier et al. 2004). Indeed, Garnier et al., (2004) showed how leaf traits (i.e. SLA, Nmass and leaf dry matter content) correlated with net
primary productivity, litter decomposition rate, and soil carbon and nitrogen content in grass communities. Lavorel et al., (2011) also observed that several traits influenced different ecosystem properties in the French Alps. Thus, a trait-based approach proves useful for scaling up from species organs to ecosystems functions (Chapin 2003; Díaz & Lavorel 2007; Suding et al. 2008).
Indeed, functional characterization of communities (i.e. how traits are distributed within communities) has been used to assess trait effects on ecosystems. The most common index for functional characterization of plant communities is the community weighted mean (CWM, Lepš et al., 2011). CWM is the averaged trait value weighted by species relative abundances within a community. CWM is closely related with the mass ratio hypothesis which states that dominant traits in a community are the main contributors of different ecosystem functions (Grime 1998). Grime, (1998) suggested that since dominants account for the highest proportion of biomass in the community, they also determine in an “overwhelming extent” some ecosystem functions as primary
production. Indeed, the study of Garnier et al., (2004) showed how strongly dominant traits influence ecosystem functioning and Mokany et al., (2008) and Májeková et al., (2014) also evidenced this “identity effect” on functions as productivity and stability, respectively.
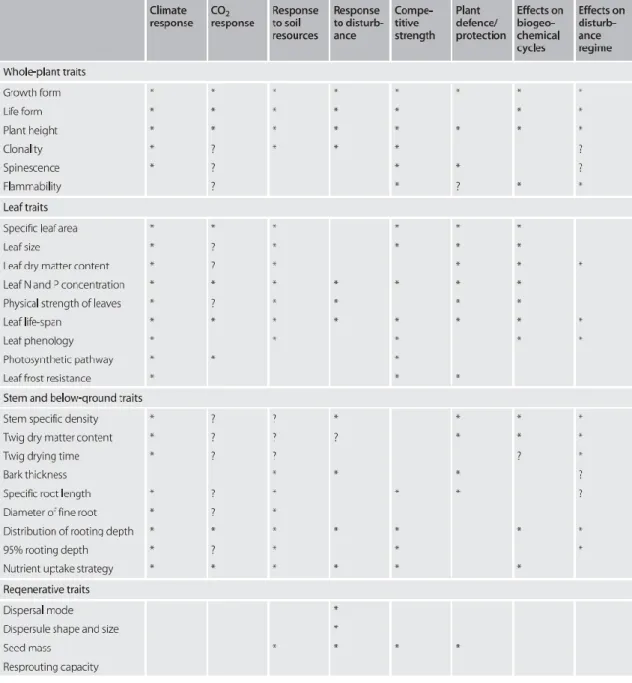
Table 2.1: Association of plant traits with plant responses, competition, protection and effects on ecosystem process (from Lavorel et al., 2007)
However, diversity it is also pointed to play an important role in ecosystem functioning (Hooper et al. 2005). Two key mechanism, complementarity (Tilman 1997) and selection effects (Loreau & Hector 2001), are invoked for explaining the positive effects of diversity on ecosystem functions. Complementarity influences ecosystem processes in two ways: by favorably shaping species interactions and by increasing resource use efficiency as a result of niche partitioning. Indeed, mixing tree species with contrasting ecological strategies can therefore increase annual wood production by alleviating competitive inhibition among neighboring trees (Potvin & Gotelli 2008; Pretzsch & Schu 2009; Gómez-Aparicio et al. 2011), and by allowing diverse forest patches to use a greater portion of available resources and growing space (Morin et al. 2011; Brassard et al. 2013; Vilà et al. 2013; Tobner et al. 2014). However, at higher diversity levels there is also a higher chance of including highly productive species, thus the positive effect of diversity may be confounded by the inclusion of a highly productive species that drives the ecosystem function (i.e. the selection effect).
Thus, functional diversity indexes instead of species richness “per se” are recently used for testing the long-standing hypothesis of a positive relationship between Biodiversity and Ecosystem Functions (since it accounts for differences on species attributes that may mediate ecosystem functioning). Functional diversity refers to the kind, range, and relative abundance of functional traits present in a given community. Metrics to capture aspects of functional diversity are numerous (Table 2.2) including: functional richness, evenness, divergence, Rao‟s quadratic entropy, and dispersion (Laliberté & Legendre 2010; Mouchet et al. 2010). Functional richness represents the range of trait values inside a community (the minimum convex hull in a multi-trait space) but its drawback relies on not providing information about how trait space is filled. Instead, functional evenness and divergence account for this aspect, and represent the regularity (i.e. evenness) and the spread (i.e. divergence) of abundances along this space, respectively (Villéger et al. 2008). However, since those indexes have limitations as dealing with both quantitative and qualitative data, and with missing values, Laliberté and Legendre (2010) proposed a new index called functional dispersion (FDis). FDis, which is closely related with Rao‟s quadratic entropy, represents species mean distance from the multi-trait space centroid. Indeed, FDis is currently one of the most common used as diversity
metric in BEF. For instance, Paquette and Messier, (2011) and Ruiz-Benito et al.,(2014) used FDis to detect the positive effects of functional diversity on forest productivity.
Table 2.2: dij: is the dissimilarity between species i and j. S: species richness. N: the number of
functional units. pi the relative abundance of species i. x: trait values. dG: mean distance to the
center of gravity. Δd: sum of abundance-weighted deviances. PEW: partial weighted evenness. i’: branch presence/absence row vector. h2: branch length vector. zi: the distance of species i from the
Species Distribution Models
Species Distribution Models (SDM) are numerical models “that relate species distribution data (occurrence or abundance at known locations) with information on the environmental and/or spatial characteristics of those locations” (Elith & Leathwick 2009). Thus, SDM allow to analyze theoretical and practical issues relating species and environment (Higgins et al. 2012). For instance, SDM has been used to test the effect of extreme events on species distributions (Zimmermann et al. 2009), assess facilitative mechanisms among species (Pellissier et al. 2010), or evaluate potential impacts of climate change on species distribution, vegetation types, and diversity (Thuiller et al. 2005; Thuiller et al. 2006; Thuiller et al. 2011). The First study relating species distribution and environment dates back to 1924, when Johnston studied the invasive spread capacity of cactus species in Australia (reference in Guisan and Thuiller, 2005). However, was during the 80‟s when this “discipline” started to growth mainly due to developments on computational and statistical sciences. Latterly, in the turn of century, greatest improvements were carried out on theoretical and technical related issues as clarifications over the niche concept or implementation of new statistical methods (see reviews from Guisan & Zimmerman 2000; Guisan & Thuiller 2005; Elith & Leathwick 2009; Zimmermann et al. 2010).
SDM have been also referred as “ecological niche models”, “habitat suitability models”, or “predictive distribution models”, mainly due to different interpretations of what is being modeled and what they are predicting, i.e. if SDM represent species niche or simply species potential distributions (Franklin, 2009). However, it is recognized that SDM are strongly linked with Hutchinson definition of species niche (Araujo & Guisan 2006). Hutchinson, (1957) defined the fundamental niche of species as a hypervolume representing the „n’ environmental dimensions in which species can exist (accordingly to Grinnell 1917). Nevertheless, Hutchinson also distinguished the realized niche, i.e. the restricted part of the fundamental niche because of distributional constrains imposed by biotic interactions (Fig. 2.2). Thus, since SDM are based on the realized distribution of species (i.e. after overcoming biotic and abiotic filters), SDM are commonly
interpreted as a representation of species realized niche (Franklin, 2009; Guisan and Zimmerman, 2000).
Figure 2.2: The niche concept. Hutchinson defined the fundamental niche as a hypervolume representing the „n’ environmental dimensions in which species can exist (in these example it is represented over three dimensions). He also distinguished the realized niche, i.e. the restricted part of the fundamental niche because of distributional constrains imposed by biotic interactions.
The modeling procedure can be dived into different steps (see Guisan and Zimmerman, 2000 for further details). Conceptual formulation is the first step and sets the underlying theories, assumptions and factors controlling species distribution. Their consideration is necessary for an appropriate model design and proper interpretation of results. For instance, assumptions on species pseudo-equilibrium with the environment (Araújo et al. 2005) and theories regarding general patterns constraining species range limits (Brown et al. 1996) should be considerate for an appropriate geographical and physiological interpretation of SDM.
Following steps are data collection and algorithm selection which also should be in agreement with the purpose of the model (Austin 2007). Data used should cover an appropriate area extent (at least the whole species environmental range) and the resolution or work scale should be adequate enough to detect the underlying ecological process (Franklin 2009). For instance, coarse resolutions and “un-sampled”
environmental gradients might not allow detecting species environmental responses. Instead, the selection of statistical model is important since it conditions the kind of relationship among species and environment (e.g. if it is linear, quadratic, or asymmetric). Traditionally, it was considerate that species response to a resource gradient was bell shaped (it was assumed that competition constrained the range but not the optima), however, theoretical and applied studies had showed that species responses may take numerous forms (e.g. skewed or even bimodal, Fig. 2.3, Austin & Smith 1990). Thus, it is suggested that statistical algorithms used in SDM should not constrain species environmental responses to specific shape (specially without explicit theoretical justification, Austin 2007).
Figure 2.3: Species environmental responses modulated by biotic interactions. Species fundamental responses (dotted line) could have different realized shapes depending on how other species affect it. A) Traditional assumption suggesting that the optimum is not affected by biotic interactions; B) and C) bimodal and unimodal realized responses with alterations on species physiological optimum (adapted from Austin and smith 1990).
Different algorithms are used to fit SDM, for instance regression based models (e.g. Generalized Linear and Additive Models), classification techniques (e.g. Classification and Regression Trees), environmental envelopes (e.g. BIOCLIM) or machine learning approaches (e.g. MAXENT, Artificial Neural Networks, Boosted Regression Trees and Random Forests). These techniques differ in several aspects (see Franklin 2009 for more deep insights) but the main difference relies on how the relationships among species and environment is “structured” (Fig. 2.4). Indeed, the complexity of the algorithms has conditioned their use in ecology. For instance, despite machine learning
techniques might outperform traditional methods (Elith et al. 2006), their “black box” nature has promote more comprehensive techniques as regression methods since they easily allow to understand how species relates with environment (Elith & Leathwick 2009).
Figure 2.4: Representation of how different algorithms structure the relationships among species and environment. A) Envelope models create a “bioclimatic surface” which envelopes the conditions over which species can be found; B) regression models fit an equation relating the probability to find a species based on environmental data; C) classification techniques create “conditional trees” which classify locations as a presence or absence according to their environmental values; D) Machine learning techniques (e.g. neuronal networks), create hidden cause-effect relationships among variables as consequence of a learning process.
The last steps for building SDM are model calibration (i.e. parameters estimation) and evaluation. Since is not common to have independent datasets to use for each step (despite it will be the most optimal practice, Fielding & Bell 1997), usually data are split into calibration and evaluation datasets to avoid the overestimations problems
caused when using the same dataset for both tasks. However if the dataset is not large enough, other techniques like Jack-Knife, cross-validation, or bootstrapping, which are based on the stability of the model, are considered more approapirate (for further details see Guisan and Zimmerman, 2000). The most common parameters used for evaluate the accuracy of SDM are the Area Under the Curve (AUC) and Kappa statistic (Elith & Leathwick 2009). Both methods depend on the confusion matrix, i.e. a contingency table with the correct predicted and wrong predicted presence, and correct predicted and wrong predicted absence. However, Kappa is a threshold dependent method and thus it explicitly needs to set a probability threshold to transform occurrence probability into presence and absence (see Valverde-Jimenez & Lobo 2007 for different methods) . Instead, AUC is a method which provides a single measure of overall accuracy without depending upon a particular threshold (Fielding & Bell 1997). Both methods have their own drawbacks since their performance depend on data characteristics. For instance, since Kappa is influenced by species prevalence (i.e. the ratio among presence and absences), its performance might depend on the method used to set the threshold (Valverde-Jimenez & Lobo 2007). Instead, AUC largely depends on the extent of analysis (i.e. higher AUC scores are obtained increasing the geographical extent outside species environmental domain, Lobo et al. 2008). Thus, it is usually recommended to jointly use different evaluation parameters to assess the accuracy of SDM (see suggestions in Fielding and Bell, 1997).
Remote Sensing
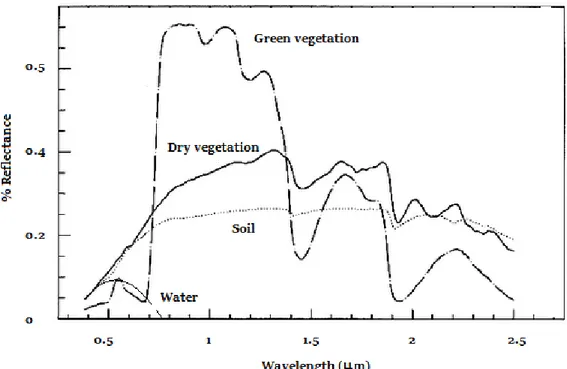
Remote sensing is referred to the acquisition of electromagnetic signals from satellite or airborne sensors, which allows inferring information about land properties (Turner et al. 2003). Remote sensing is based on “objects” spectral properties to absorb, transmit and reflect different wavelengths of the electromagnetic spectrum. Thus, since “objects” like vegetation, water and soil differ on their spectral response (Fig. 2.5), remote sensing proves useful for study different aspects of natural earth systems. The use of remote sensing for vegetation analysis dates back to 2nd World War when color infrared films were used to detected vegetation health (Ustin and Gamon, 2010). However, was in the 70‟s when the global digital imagery begun thanks to the first land observing satellite,
the Earth Resources Technology Satellite (ERTS 1, later renamed LANDSAT, Ustin & Gamon 2010). Since that moment, developments on sensors characteristics, advances in informatics, launching of new satellites, and a better understanding of objects spectral behaviors have allowed to globally and routinely monitor ecosystems.
The main characteristics of satellite sensors that condition analysis are spatial, temporal and spectral resolutions. Spatial resolutions of sensors characterize the landscape levels of analysis, with the highest resolution (< 1 m) able to identify individual tree plants and lowest resolution (e.g. 1km) to infer information at ecosystem level. Temporal resolution identifies vegetation under different aspects, wherein with monthly image detections is possible to observe seasonal changes in phenology, while image detection over the years reveal longer term changes associated with anthropic activities (land use changes) or climate trends. Instead, spectral resolution refers to the number of bands discriminated by the sensor which allow to detect, in the case of hyperspectral sensors, subtle difference among objects proving useful information for assessing species composition (Wang et al. 2010).
Plants spectral response is characterized by the absorption at the visible region of the light spectrum (mostly on blue and red, and less on the green portion of spectrum) while reflecting most of the light in the near infrared (750-1400 nm, Fig. 2.5). The absorption in the visible is due to chlorophylls and carotenoids located in the palisaded parenchyma whereas reflection is consequence of spongy parenchyma structure (cell wall air interfaces), which allows reflecting the excess of energy that arrives via the near infrared region (Jensen 2000). However, stress conditions (e.g. drought, cold, or pathogens) might lead to reductions on chlorophyll content and changes on spongy parenchyma structure resulting on changes in plant spectral responses. Thus, these changes allow the identification of stress effects on plant performance.
Equations note: L is the background adjustment coefficient for near infrared (NIR) and red radiant transfer through the canopy; C1 and C2 are the aerosol correction coefficients for red and
blue bands, respectively; and G is a gain scaling factor. The coefficients adopted by MODIS are L=1, C1=6, C2=7.5, and G=2.5.
A great number of vegetation indexes have been developed using combinations of reflectance values at different wavelengths allowing stress effects to be monitored. Among these indexes, the most widely used is the Normalized Difference Vegetation Index (NDVI). NDVI is the normalized difference between near infrared and the visible reflectance (equation 1). However, some limitations have been observed in the NDVI (i.e. saturates at well vegetated areas and it does not consider background effects on reflectance, Gao et al., 2000). Thus, new indexes, like the Enhanced Vegetation Index (EVI) or Soil-Adjusted Vegetation Index (SAVI), have been suggested for monitoring
vegetation as they overcome some of the limitations of NDVI. EVI, which also uses information on the blue band to remove atmospheric and soil influences (equation 2), has been proved to be more sensitive to canopy variations than NVDI or SAVI (Huete et al. 2002; Jiang et al. 2008).
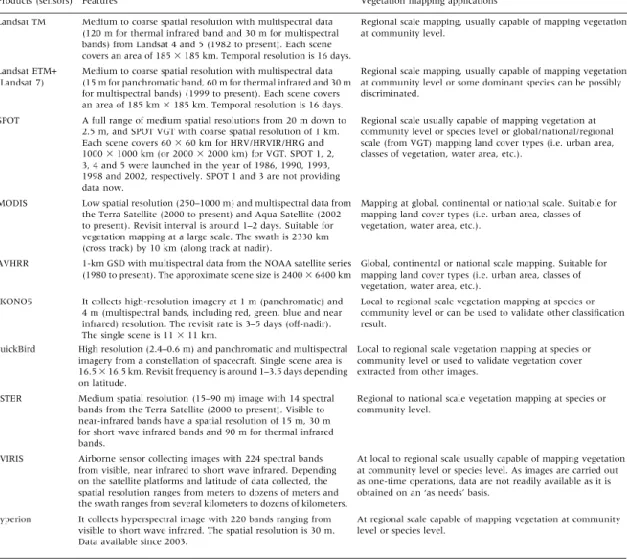
Vegetation indexes are provided by different sensors having different characteristics (i.e. in spatial and spectral resolution, temporal series and to be or not free of charge; see Table 2.3 for a summary of some characteristics of different sensors and Xie et al., 2008 for further details). Thus, the scope and availability of economic resources determines which sensor to use. For instance, MODIS provides data at a resolution of 250-500 m but from the year 2000, however AVHRR, can provide data from 1980 but at coarse resolution (1000 m). Instead LANDAST can supply data at great resolution (30 m), but data availability may be limited by weather conditions especially on tropical/subtropical areas where cloud conditions may be persistent over long periods and rare satellite passes (once every 16 days) limits acquisition of cloud-free data. On the other hand, options like SPOT or IKONOS had very fine resolution but also the disadvantage of being relatively expensive.
Different studies have demonstrated the scientific utility of these products comparing data retrieved by sensors with both field biophysical and top-of-canopy reflectance measures (Huete et al. 2002; Dong et al. 2003; Fensholt et al. 2009). For instance, NDVI and EVI from MODIS showed great correspondence with top-of canopy reflectance in different biomes (Huete et al. 2002). In addition, Dong et al., (2003) in Boreal and Temperate forest observed that NDVI accurately represented forest biomass across different spatial and temporal scales. Thus, vegetation index retrieved from remote sensing has been proved useful to study different vegetation aspects as phenology, diversity, productivity and for monitoring trends (Pettorelli et al. 2014). For instance, Gaitán et al., (2014) used inter-annual differences on the yearly cumulated NVDI to assess species richness effect on ecosystem functioning. Instead Huesca et al., (2015) using also MODIS data, assessed the functional behavior of different forest types.
Table 2.3: Main features of image products from the different sensors products (from Xie et al. 2008).
Climate Change Modeling
Climate change modeling refers to the projection of Global Circulation Models (GCM) into different future scenarios (i.e. into different human development paths), which allows to predict how socio-economic human activities will affect climate (IPCC 2014) and the different process with which it closely links (Cramer et al. 2001). Despite greenhouse gasses (GHG) effects on climate was early notice by Svante Arrhenius in 1896, the implementation of warming predictions started only during 70‟s (Bodansky 1992). However, from that moment and thanks to great developments on computer science, models have increased their complexity (i.e. including more process affecting energy transfer) and feasibility at high spatial and temporal resolutions improving the confidence of their results (Treut et al. 2007).
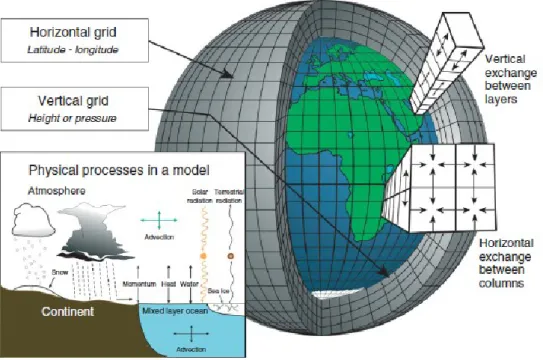
GCM are based on mathematical equations, regulating climate, hydrology and bio-geochemical cycles, and representing physical laws that govern the state (i.e. conservation of the mass, energy and momentum, and gases kinetics) of atmosphere, landforms and oceans. GCM use a three dimensional grid over the globe with several vertical layers in the atmosphere and oceans to calculate vertical and horizontal mass and energy exchanges based on those equations (Fig. 2.6; Edwards 2011). Climatic models are typically classified as Atmosphere-Ocean General Circulation Models (AOGCM) or Earth System Models (ESM), which differ in complexity and computational cost. ESM expand AOGCM, since they can include biogeochemical cycles. Both AOGCM and ESM provide hourly, daily and monthly climate data at a spatial resolution varying between 100 and 600 km. In order to provide more information at a finer scale for climate impact assessment, these models are usually downscaled using three main methods: Dynamic downscaling (Regional Circulation Models, RCM), Statistical downscaling and simple methods (e.g. Delta method). RCM typically “re-model” general circulation models for a regional extent at higher resolution, whereas statistical methods derive from empirical relations the regional spatial trends of climate as function of key climate variables at global level. Instead, simple methods like the Delta method, create a smoothed surface of change on climate
based on anomalies and then applies to high-resolution baseline climates (i.e. WorldClim).
Figure 2.6: Schematic representation of a Global Circulation Model (From Edwards 2011)
In order to assess how socio-economic human activities will affect climate, GCM are projected into different future scenarios (i.e. as input data). Scenarios refer to different future trends on socio-economic development (e.g. population growth, economic activity, or technology) that will affect climate trough GHG emissions and atmospheric concentrations, air pollutant emissions and land use (IPCC 2014). From SA90 (used in the 1st IPCC report), passing through IS92 and SRES (used in the 2nd and 3rd-4th IPCC reports, respectively), different scenarios have been specified in order to adapt to the new specificities of climatic models and for exploring different approaches on how to reach specific climate change targets. Thus, the advantage of the current RCP scenarios (i.e. the Representative Concentration Pathways) is that allow to assess how different combinations on social, economic and technological circumstances are compatible with a specific pathway or temperature target but at the same time allow climatic modelers to
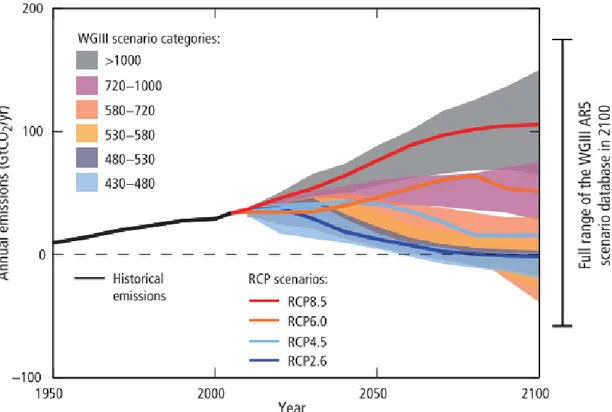
continue to assess the effect of radiative forces on climate and ecosystems (van Vuuren et al. 2011). The new four RCP cover a wide range of GHG concentration (and radiative forcing) trajectories noticed in the scientific literature (Fig 2.7). For instance, RCP 2.6 represents a future scenario where efforts have been done to reduce emissions and content temperature increase below preindustrial era. Instead, RCP 4.5 (associated to SRES B1) and 6.0 (associated to SRES B2) represent intermediate scenario whereas RCP 8.5 (associated to SRES A1F1) represents continuity on high GHG emissions.
Figure 2.7: Emissions of carbon dioxide (CO2)for the different Representative Concentration
Pathways (RCP) and the associated categories from the Working Group III (WGIII, i.e. cumulative anthropogenic CO2 emissions predicted; from IPCC 2014).
Since different climate models have been used to predict climatic changes contradictory results were caused as model uncertainties, by the reliability different assumptions taken by models (e.g. clouds, Cess et al., 1989). Thus, in order to intercompare model predictions the Coupled Model Intercomparison Project (CMIP) was established (Taylor et al. 2012). CMIP, which it is at its 5th phase, set a standardized protocol for explaining the mechanism responsible for model differences on climatic projections (i.e. why
different models give different output in response to the same input data). Models projections from different GCM used in the CMIP5 and downscaled with the Delta method at 1 km resolution are freely available at WorldClim website (http://www.worldclim.org/), specifying monthly average over 2045-2065 period of precipitation, minimum and maximum temperature. Thus, climatic data from CMIP allow to assess uncertainties on climate change impacts in vegetation and ecosystem dynamics, e.g. Yu et al., (2014) evaluated vegetation responses joining dynamic vegetation models and CMIP climatic predictions.
Bibliography
Araujo, M.B., & Guisan, A. 2006. Five ( or so ) challenges for species distribution modelling. Journal of Biogeography 33: 1677–1688.
Araújo, M., Pearson, R., & Rahbek, C. 2005. Equilibrium of species‟ distribution with climate. Ecography 28: 693–695.
Austin, M. 2007. Species distribution models and ecological theory: A critical assessment and some possible new approaches. Ecological Modelling 200: 1–19.
Austin, M., & Smith, T. 1989. A new model for the continuum concept. Vegetatio 83: 35–47.
Bodansky, D. 1992. History of the global change regime. In Luterbacher, U. & Sprinz, D.F. (eds.), International Relations and Global Climate Change, pp. 23–39. The MIT Press, Massachusetts, USA.
Brassard, B.W., Chen, H.Y.H., Cavard, X., Laganiere, J., Reich, P.B., Bergeron, Y., Pare, D., & Yuan, Z. 2013. Tree species diversity increases fi ne root productivity through increased soil volume fi lling. Journal of Ecology 101: 210–219.
Brodribb, T.J., Holbrook, N.M., Edwards, E.J., & Gutiérrez, M. V. 2003. Relations between stomatal closure, leaf turgor and xylem vulnerability in eight tropical dry forest trees. Plant, Cell and Environment 26: 443–450.
Brown, J.H., Stevens, G.C., & Kaufman, D.M. 1996. The geographic range: size, shape, boundaries, and internal structure. Annual Review of Ecology and Systematics 27: 597–623.
Cess, R.D., Potter, G.L., Blanchet, J.P., Boer, G.J., Ghan, S.J., Kiehl, J.T., LE Treut, H., Li, Z.X., Liang, X.Z., Mitchell, J.F., Morcrette, J.J., Randall, D. a, Riches, M.R., Roeckner, E., Schlese, U., Slingo, A., Taylor, K.E., Washington, W.M., Wetherald, R.T., & Yagai, I. 1989. Interpretation of cloud-climate feedback as produced by 14 atmospheric general circulation models. Science 245: 513–516.
Chapin, F.S. 2003. Effects of plant traits on ecosystem and regional processes: A conceptual framework for predicting the consequences of global change. Annals of
Botany 91: 455–463.
Chapin, F.S., Zavaleta, E.S., Eviner, V.T., Naylor, R.L., Vitousek, P.M., Reynolds, H.L., Hooper, D.U., Lavorel, S., Sala, O.E., Hobbie, S.E., Mack, M.C., & Díaz, S. 2000. Consequences of changing biodiversity. Nature 405: 234–42.
Chave, J., Coomes, D., & Jansen, S. 2009. Towards a worldwide wood economics spectrum. Ecology Letters 12: 351–66.
Choat, B., Jansen, S., Brodribb, T.J., Cochard, H., Delzon, S., Bhaskar, R., Bucci, S.J., Feild, T.S., Gleason, S.M., Hacke, U.G., Jacobsen, A.L., Lens, F., Maherali, H., Martínez-Vilalta, J., Mayr, S., Mencuccini, M., Mitchell, P.J., Nardini, A., Pittermann, J., Pratt, R.B., Sperry, J.S., Westoby, M., Wright, I.J., & Zanne, A.E. 2012. Global convergence in the vulnerability of forests to drought. Nature 491: 752–5.
Cramer, W., Bondeau, A., Woodward, F.I., Prentice, I.C., Betts, R. a., Brovkin, V., Cox, P.M., Fisher, V., Foley, J. a., Friend, A.D., Kucharik, C., Lomas, M.R., Ramankutty, N., Sitch, S., Smith, B., White, A., & Young-Molling, C. 2001. Global response of terrestrial ecosystem structure and function to CO2 and climate change: Results from six dynamic global vegetation models. Global Change
Biology 7: 357–373.