RETAILER
FOR DURABLE GOODS MARKET IN
ROMANIA.
Received: August 18, 2013
The durable goods market in Romania has many features thanks to simultaneously: acquisition way, structure of households, retailers on this market, banking policies as regards providing consumption loans („loans with identity card only”), mac
tacit supporting in relation to banking policies etc. These characteristics are found in the low endowment with durable goods of households in Romania, and that generate features of the acquisition process, the decision taking proces
consumer relationships. This paper covers the last aspect, being used a representative urban sample of 300 households, the following methods being used for data processing:
bivariate, ANOVA, Wilcoxon
that to provide new results referring to retailer
goods market in Romania, that confirm or infirm the foreign research results. Keywords: Durable goods; Romanian market
Statistical methods; Retailers;
1. Introduction
In the author’s previous research have been published results related to the durable goods market in Romania (using numerous stati
being a completion with new results about this topic. Following the previous research, it has resulted that the durable goods market in Romania has many
simultaneously:
• To purchase durable goods, consumers in Romania use the following criteria and information sources (Gabor
smallest influence having the provided
• Acquisition way used by Romanian consumers (p influences etc.) according to
• Significant differences statistically as regards endowment with durable goods across counties, development regions and nationally (
• Information sources used by Romanian consumers in purchasing durable goods vary according to their age (
RETAILER – CONSUMER RELATIONSHIPS
FOR DURABLE GOODS MARKET IN
ROMANIA. A MULTIMETHOD ANALYSIS
MANUELA ROZALIA GABOR
Petru Maior University of Tirgu Mures, RomaniaAccepted: April 14, 2014 Online Published:
Abstract
The durable goods market in Romania has many features thanks to simultaneously: acquisition way, structure of households, retailers on this market, banking policies as regards providing consumption loans („loans with identity card only”), macroeconomic policies of tacit supporting in relation to banking policies etc. These characteristics are found in the low endowment with durable goods of households in Romania, and that generate features of the acquisition process, the decision taking process of durable goods and implicitly of retailer consumer relationships. This paper covers the last aspect, being used a representative urban sample of 300 households, the following methods being used for data processing:
bivariate, ANOVA, Wilcoxon test, Cronbach alpha, split – half, the goal of this paper being that to provide new results referring to retailer – consumer relationships for the durable goods market in Romania, that confirm or infirm the foreign research results.
Romanian market; Socio-demographic variables Consumers.
In the author’s previous research have been published results related to the durable goods market in Romania (using numerous statistical methods), concerning this market,
being a completion with new results about this topic. Following the previous research, it has durable goods market in Romania has many features
ble goods, consumers in Romania use the following criteria and Gabor et al., 2009): price, promotions, brand of the product smallest influence having the provided after sales service;
Acquisition way used by Romanian consumers (period, location, promotional influences etc.) according to Gabor (2011a; 2012a, 2012b, 2013);
Significant differences statistically as regards endowment with durable goods across development regions and nationally (Gabor et al., 2011);
on sources used by Romanian consumers in purchasing durable goods vary according to their age (Gabor et al. , 2011b) ;
CONSUMER RELATIONSHIPS
FOR DURABLE GOODS MARKET IN
A MULTIMETHOD ANALYSIS
MANUELA ROZALIA GABOR
Petru Maior University of Tirgu Mures, RomaniaOnline Published: May 21, 2014
The durable goods market in Romania has many features thanks to simultaneously: acquisition way, structure of households, retailers on this market, banking policies as regards roeconomic policies of tacit supporting in relation to banking policies etc. These characteristics are found in the low endowment with durable goods of households in Romania, and that generate features of the s of durable goods and implicitly of retailer – consumer relationships. This paper covers the last aspect, being used a representative urban sample of 300 households, the following methods being used for data processing: χ2 test half, the goal of this paper being consumer relationships for the durable goods market in Romania, that confirm or infirm the foreign research results..
demographic variables; Households;
In the author’s previous research have been published results related to the durable goods concerning this market, this paper being a completion with new results about this topic. Following the previous research, it has
features thanks to
ble goods, consumers in Romania use the following criteria and
price, promotions, brand of the product, the
eriod, location, promotional Significant differences statistically as regards endowment with durable goods across on sources used by Romanian consumers in purchasing durable goods vary
• Socio-demographic characteristics that best discriminate this preference for foreign brands being the income and studies of the household head (Gabor et. al, 2011) ;
• Households in Romania, from urbane environment, are still endowed with black and white TV (14.3%) and non-automatic washing machines (27%) or very old or second hand goods (25%) (Gabor , 2013) ;
• Romanian consumers are not sensitive to variables related to brand of durable goods,
name of shop or design of product but are strongly influenced by their price (Gabor ,
2012a) ;
• Structure of households and families that represent these households respectively, and implicitly characteristics of the head of their households (Gabor , 2012a);
• Buying power is very low in Romania (Our income is enough for a decent living, but
we cannot afford buying some more expensive goods) (Gabor , 2013);
• 42% of urban households have loans or credits (Gabor , 2013). To these aspects are added those related to economy and standard of living related to households in Romania, respectively;
• Banking policies in Romania as regards providing consumption loans ("loans with identity card only”) in order to rise the accession extent of these types of loans with direct implications on the increase of buying durable goods and therefore, standard of living and quality of life concerning households in Romania, ranked at the bottom of the list of EU member countries concerning this indicator;
• Macroeconomic policies of tacit supporting in relation to the banking policies described above;
• Compared to the other EU Member Countries 1 (according to statistical data supplied by Eurostat), Romania occupies the first place within classification concerning the
lack of some durable goods (washing machine, landline and mobile telephone, color
TV, personal computer , car) due to the lack of financial resources.
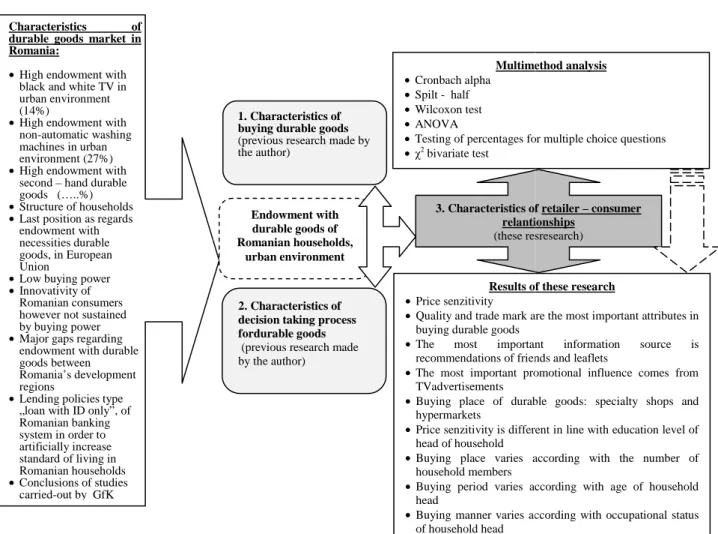
Starting from the above mentioned, the conceptual frame of this paper is summarized in figure 1.
This paper has research as aim, by means of statistical methods, the relation between Romanian consumers of durable goods and retailers that operate on this market. The objectives of this paper, embodied in the research hypotheses are summarized in Table 1 in the following paragraph. We mention that these results are a completion and are based on the author’s previous research being the first in the specialty literature that provide results – achieved by applying the multimethod analysis – about this market.
In order to achieve the objectives of empirical research it has been used a representative sample made of 300 households in Tirgu Mures municipality, selected through a double sampling scheme to provide the sample representativeness. It has been used a questionnaire managed by a sampling operator, data being gathered in May 2011. For data processing the following statistical methods have been used: χ2 test bivariate, ANOVA, Wilcoxon test, Cronbach alpha, split – half, multiple feedback data processing.
We shall present further a brief description of the main research carried-out in order to characterize the durable goods market, mentioning that international literature has no many research papers in this respect. Then we present – separately for each statistical method used – the main results of this research, section followed by future research directions and conclusions.
Figure 1 – Conceptual framework of the paper
2. Literature review
In the foreign literature the first research with regard to this market is since 1979, when Kasulis, Lusch & Stafford were anticipating that, from a high number of reasons (including a high population – in the ’80s –
fastest segment of consumer market in the ’80s. emphasized that:
1. Middle population will show various purchase models of durable goods
2. Order of purchase the second TV or car in the same household var to the quality of the buyer as being the owner or the tenant of his house.
The authors also suggest to study this issue in different geographical areas in the future (as it is one of variables that influences this purchase
2011) and also take into consideration variables such as,
was considered in this research, this being reflected by variables such as:
obtained in a household and household he household head).
Modeling of relation between value, usefulness and holding of durable goods was studied and approached by Corfman, Lehmann
sampling on a sample of 735respondents for discretionary goods.
Characteristics of durable goods market in Romania:
•High endowment with
black and white TV in urban environment (14%)
•High endowment with
non-automatic washing machines in urban environment (27%)
•High endowment with
second – hand durable goods (…..%)
•Structure of households
•Last position as regards
endowment with necessities durable goods, in European Union
•Low buying power
•Innovativity of
Romanian consumers however not sustained by buying power
•Major gaps regarding
endowment with durable goods between Romania’s development regions
•Lending policies type
„loan with ID only”, of Romanian banking system in order to artificially increase standard of living in Romanian households •Conclusions of studies carried-out by GfK Romania referitoare la
Conceptual framework of the paper
reign literature the first research with regard to this market is since 1979, when Stafford were anticipating that, from a high number of reasons (including a
– with age between 18 – 34 years) the durable good
fastest segment of consumer market in the ’80s. The conclusions of the three authors
Middle population will show various purchase models of durable goods Order of purchase the second TV or car in the same household var to the quality of the buyer as being the owner or the tenant of his house.
The authors also suggest to study this issue in different geographical areas in the future (as it is one of variables that influences this purchase – see the case of Romania
) and also take into consideration variables such as, social class of consumers
was considered in this research, this being reflected by variables such as: net monthly income
obtained in a household and household head, level of education and occupational status of
Modeling of relation between value, usefulness and holding of durable goods was studied Corfman, Lehmann & Narayanan (1991) by means of a convenience of 735respondents for discretionary goods. They started in building up
Endowment with durable goods of Romanian households,
urban environment 1. Characteristics of buying durable goods
(previous research made by the author)
2. Characteristics of decision taking process fordurable goods
(previous research made by the author) 3. Characteristics of relantionships (these resresearch) Multimethod analysis •Cronbach alpha •Spilt - half •Wilcoxon test •ANOVA
•Testing of percentages for multiple choice questions
•χ2 bivariate test
Results of these research
•Price senzitivity
•Quality and trade mark are the most important attributes in
buying durable goods
•The most important information source is
recommendations of friends and leaflets
•The most important promotional i
TVadvertisements
•Buying place of durable goods: specialty shops and
hypermarkets
•Price senzitivity is different in line with education level of
head of household
•Buying place varies according with the number of
household members
•Buying period varies according with age of household
head
•Buying manner varies according with occupational status
of household head
reign literature the first research with regard to this market is since 1979, when Stafford were anticipating that, from a high number of reasons (including a 34 years) the durable goods will be the The conclusions of the three authors
Middle population will show various purchase models of durable goods, and Order of purchase the second TV or car in the same household varies according to the quality of the buyer as being the owner or the tenant of his house.
The authors also suggest to study this issue in different geographical areas in the future f Romania: Gabor et al.
social class of consumers (this aspect net monthly income ad, level of education and occupational status of
Modeling of relation between value, usefulness and holding of durable goods was studied Narayanan (1991) by means of a convenience They started in building up
3. Characteristics of retailer – consumer relantionships
(these resresearch)
Multimethod analysis
Testing of percentages for multiple choice questions
Results of these research
Quality and trade mark are the most important attributes in
The most important information source is
recommendations of friends and leaflets
The most important promotional influence comes from Buying place of durable goods: specialty shops and Price senzitivity is different in line with education level of Buying place varies according with the number of period varies according with age of household Buying manner varies according with occupational status
assumptions for their research from the standard microeconomic theory that suggests that
budget allocation of households is carried-out according to: size of consumer budget and usefulness of validity as regards items provided by their price. They concluded that, when choosing durable goods, consumers cannot purchase dissimilar products and cannot compare objective or concrete objectives. Their selections are usually the result of comparisons carried-out more at abstract level and involves evaluation of products based on their ability to meet the basic values of consumers. They invalidated the assumption that the order of
purchasing durable goods is uniform in population, revealing there are differences according to the social class and the quality to be – or not – owners of endowed house. The consumption patterns carried-out by these authors showed the connection between combination of preferences, price information and budget restrictions for the household buying decision, but these patterns are not consistent for the basic utilities of durable goods, too. The two structural equations that have been tested and used in the pattern are:
• Endowment with durable goods = f (usefulness, income, age)
• Usefulness = f (values of consumers, endowment with durable goods)
The authors used as stimuli, discretionary durable goods in five categories: house entertainment, sport and exercises, pets, habits and luxury, and as processing methods of data collected by sampling, factor analysis and group analysis.
The issue of purchasing durable goods „on credit” was approached in 1993 by that analyzed this „tendency” (called „consumer durable revolution”) in the ’20s. The author considered that this type of credit (with direct illustration for car credits) was „created” not to help the consumer but, on the contrary, for the producers’ success and their marketing strategies. If we carry out an analogy with the Romanian market in the surveyed period, what was considered luxury durable goods in the ’20s 2, in Romania, as regards category of these goods, necessity goods were „placed” or purchased by credit (considered in the European Union as being part in the „basic” endowment of a household), for instance: double glazing, refrigerator, air conditioning etc. The author noticed that, after the Second World War (another analogy with Romania would be December 1989 when it shifted from the centralized economy in the communist period to the market economy) the consumption behavior of households has changed. The author noticed that one of the important reasons leading to this change is provided by rising of advertising made to durable goods3that has as direct result –
and instant – rising of sales as regards durable goods. The final, general conclusion from this study is that the „consumer durable revolution” in the ’20s, brought major changes not only to validity of credit (consumption) but to also advertising and that these changes were not the implicit results of intended endeavor of the market and affected – dramatically – consumption costs of households.
In the durable goods industry there is still a global feature namely: country where a product is designed is not the same with the country it produces, aspects related to the impact
of country of design and the country of manufacture over perceptions of durable goods consumers was studied in 2006 by Hamzaoui & Merunka, the two authors suggesting an empiric pattern based on the „of fit” concept of this bi – national quality of the durable goods, dividing the concept of country of origin (COO – country of origin) and tests the influence of country of design (COD – country of design) and country of manufacture (COM
– country of manufacture) over the evaluation of bi-national durable goods consumer. The paper providing important contributions and new insights to the judges of a consumer concerning the perception of quality for bi-national durable goods.
research of authors Seitz, Razauk
purchase of durable goods, singularized on air conditioning systems
dedicated – and useful – to producers and dealers of these durable g
based on sampling on a random sample of 140 subjects. The surveyed variables were:
to which the price to be paid for this durable goods influences the brand about this product is searched and demographic
research emphasized that, for this durable,
characteristic criterium in selecting the product
order of their importance): friends and family, websites of producers, leaflets of producers (but not type „golden pages”),
information sources in exchange are influenced by merchants when taking the buying decision as it helps them redefine their selection criteria and therefore choose that air conditioning system that reaches their purpose.
The issues of modeling the durable goods market have been approached in various senses, thus in 2010, Guiltian approached
durables, the results of his research (practically a „stocktaking” of topic in specialty literature)
emphasizing as replacement reasons: their usefulness in conjunction with the depreciation
rate and the discount rate of
durable goods may result in their total or part replacement thus resulting the „desire of something new” or waiting the validity of some new benefits
scientifically established presumption that replacement decision is based on the rational choice but – according to behavior research
of decision costs and is required by variable situations of replacement and motivations. However, the results of Guiltian’s study
taken into consideration as a decision maker of the purchase and replacement of a durable good, in our study this decision belongs to household as a decision maker r
household head, studies in specialty literature emphasizing this significant aspect, that the purchase decision for a durable good respectively is taken within the household and not individually.
Maintaining the expanded rate in the last survey, in 2011, Liberali, Gruca
effect of sensitivity(senzitation) to price and habituation over the purchase of durable goods
emphasizing that product performances represent the key of consumer motivation to purchase discretionary goods for replacing a durable good, the consumer considering only those goods that provide additional performances compared to that they already have. Research conclusion is that, producers should provide products having a much higher performance with every new generation of products launched on the market when price sensitivity goes down every new purchase. The originality of this study consists in the fact that authors cons
experienced consumers, the issue for the market in Romania is that existence
some experienced consumers, considering that, households have adopted quite recently the replacement trend and endowment of household with new durable go
purchasing of second-hand durable goods (still valid on the car market as it goes on worldwide). This aspect of additional performances concerning a commodity launched on the market was also approached by Zhao, Meyer
are often attracted by new versions of durable goods that provide additional elements; even if these new elements are never used (
Starting from the results published in the professional literature, fo
worded the following hypotheses and for whose testing we will use various statistical methods, the testing methods being mentioned for each hypothesis (
research of authors Seitz, Razauk & Wells about the importance of brand equity over the
purchase of durable goods, singularized on air conditioning systems
to producers and dealers of these durable goods, data being collected based on sampling on a random sample of 140 subjects. The surveyed variables were:
to which the price to be paid for this durable goods influences the brand,
about this product is searched and demographic characteristics. Therefore the results of
research emphasized that, for this durable, brand is a proof of product quality
in selecting the product and as information sources
friends and family, websites of producers, leaflets of producers
(but not type „golden pages”), sellers and catalogues type„ golden pages” are not used as
information sources in exchange are influenced by merchants when taking the buying helps them redefine their selection criteria and therefore choose that air conditioning system that reaches their purpose.
issues of modeling the durable goods market have been approached in various
, thus in 2010, Guiltian approached the aspects of replacement decision of these , the results of his research (practically a „stocktaking” of topic in specialty literature)
replacement reasons: their usefulness in conjunction with the depreciation consumers, deterioration of intrinsic performances concerning durable goods may result in their total or part replacement thus resulting the „desire of something new” or waiting the validity of some new benefits. Guiltian starts from the
tablished presumption that replacement decision is based on the rational according to behavior research – and on psychological costs, frequent distortions of decision costs and is required by variable situations of replacement and motivations. However, the results of Guiltian’s study should be adapted as the final consumer has been taken into consideration as a decision maker of the purchase and replacement of a durable good, in our study this decision belongs to household as a decision maker r
household head, studies in specialty literature emphasizing this significant aspect, that the purchase decision for a durable good respectively is taken within the household and not expanded rate in the last years concerning the durable goods market survey, in 2011, Liberali, Gruca & Nique published the results of their research regarding
effect of sensitivity(senzitation) to price and habituation over the purchase of durable goods
t performances represent the key of consumer motivation to purchase discretionary goods for replacing a durable good, the consumer considering only those goods that provide additional performances compared to that they already have. Research conclusion that, producers should provide products having a much higher performance with every new generation of products launched on the market when price sensitivity goes down every new purchase. The originality of this study consists in the fact that authors cons
, the issue for the market in Romania is that existence
some experienced consumers, considering that, households have adopted quite recently the replacement trend and endowment of household with new durable goods, trend that followed hand durable goods (still valid on the car market as it goes on worldwide). This aspect of additional performances concerning a commodity launched on the market was also approached by Zhao, Meyer & Han in 2005 who emphasized that
are often attracted by new versions of durable goods that provide additional elements; even if these new elements are never used (have no real usefulness).
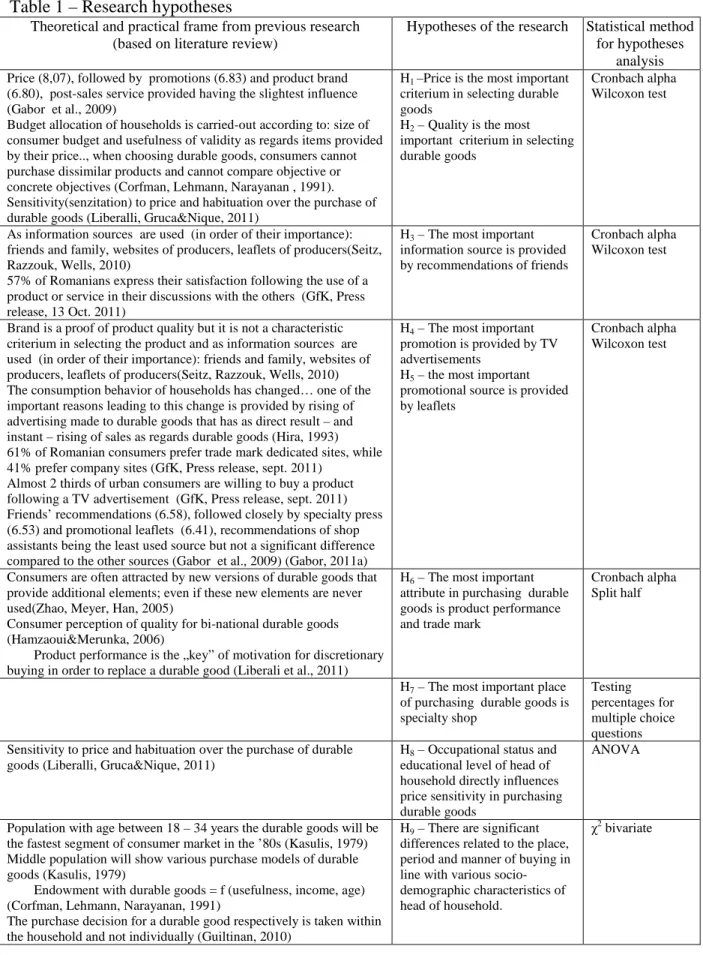
Starting from the results published in the professional literature, for this study we have worded the following hypotheses and for whose testing we will use various statistical methods, the testing methods being mentioned for each hypothesis (Table 1).
the importance of brand equity over the purchase of durable goods, singularized on air conditioning systems, this study being
oods, data being collected based on sampling on a random sample of 140 subjects. The surveyed variables were: degree , where information Therefore the results of
brand is a proof of product quality but it is not a information sources are used (in friends and family, websites of producers, leaflets of producers pages” are not used as information sources in exchange are influenced by merchants when taking the buying helps them redefine their selection criteria and therefore choose that air issues of modeling the durable goods market have been approached in various replacement decision of these
, the results of his research (practically a „stocktaking” of topic in specialty literature)
replacement reasons: their usefulness in conjunction with the depreciation consumers, deterioration of intrinsic performances concerning durable goods may result in their total or part replacement thus resulting the „desire of
. Guiltian starts from the tablished presumption that replacement decision is based on the rational and on psychological costs, frequent distortions of decision costs and is required by variable situations of replacement and motivations. the final consumer has been taken into consideration as a decision maker of the purchase and replacement of a durable good, in our study this decision belongs to household as a decision maker represented by the household head, studies in specialty literature emphasizing this significant aspect, that the purchase decision for a durable good respectively is taken within the household and not years concerning the durable goods market Nique published the results of their research regarding the
effect of sensitivity(senzitation) to price and habituation over the purchase of durable goods,
t performances represent the key of consumer motivation to purchase discretionary goods for replacing a durable good, the consumer considering only those goods that provide additional performances compared to that they already have. Research conclusion that, producers should provide products having a much higher performance with every new generation of products launched on the market when price sensitivity goes down every new purchase. The originality of this study consists in the fact that authors considered that , the issue for the market in Romania is that existence – or not – of some experienced consumers, considering that, households have adopted quite recently the ods, trend that followed hand durable goods (still valid on the car market as it goes on worldwide). This aspect of additional performances concerning a commodity launched on the who emphasized that consumers
are often attracted by new versions of durable goods that provide additional elements; even if
r this study we have worded the following hypotheses and for whose testing we will use various statistical
Table 1 – Research hypotheses
Theoretical and practical frame from previous research (based on literature review)
Hypotheses of the research Statistical method for hypotheses
analysis
Price (8,07), followed by promotions (6.83) and product brand (6.80), post-sales service provided having the slightest influence (Gabor et al., 2009)
Budget allocation of households is carried-out according to: size of consumer budget and usefulness of validity as regards items provided by their price.., when choosing durable goods, consumers cannot purchase dissimilar products and cannot compare objective or concrete objectives (Corfman, Lehmann, Narayanan , 1991). Sensitivity(senzitation) to price and habituation over the purchase of durable goods (Liberalli, Gruca&Nique, 2011)
H1 –Price is the most important criterium in selecting durable goods
H2 – Quality is the most important criterium in selecting durable goods
Cronbach alpha Wilcoxon test
As information sources are used (in order of their importance): friends and family, websites of producers, leaflets of producers(Seitz, Razzouk, Wells, 2010)
57% of Romanians express their satisfaction following the use of a product or service in their discussions with the others (GfK, Press release, 13 Oct. 2011)
H3 – The most important information source is provided by recommendations of friends
Cronbach alpha Wilcoxon test
Brand is a proof of product quality but it is not a characteristic criterium in selecting the product and as information sources are used (in order of their importance): friends and family, websites of producers, leaflets of producers(Seitz, Razzouk, Wells, 2010) The consumption behavior of households has changed… one of the important reasons leading to this change is provided by rising of advertising made to durable goods that has as direct result – and instant – rising of sales as regards durable goods (Hira, 1993) 61% of Romanian consumers prefer trade mark dedicated sites, while 41% prefer company sites (GfK, Press release, sept. 2011)
Almost 2 thirds of urban consumers are willing to buy a product following a TV advertisement (GfK, Press release, sept. 2011) Friends’ recommendations (6.58), followed closely by specialty press (6.53) and promotional leaflets (6.41), recommendations of shop assistants being the least used source but not a significant difference compared to the other sources (Gabor et al., 2009) (Gabor, 2011a)
H4 – The most important promotion is provided by TV advertisements
H5 – the most important promotional source is provided by leaflets
Cronbach alpha Wilcoxon test
Consumers are often attracted by new versions of durable goods that provide additional elements; even if these new elements are never used(Zhao, Meyer, Han, 2005)
Consumer perception of quality for bi-national durable goods (Hamzaoui&Merunka, 2006)
Product performance is the „key” of motivation for discretionary buying in order to replace a durable good (Liberali et al., 2011)
H6 – The most important attribute in purchasing durable goods is product performance and trade mark
Cronbach alpha Split half
H7 – The most important place of purchasing durable goods is specialty shop
Testing percentages for multiple choice questions Sensitivity to price and habituation over the purchase of durable
goods (Liberalli, Gruca&Nique, 2011)
H8 – Occupational status and educational level of head of household directly influences price sensitivity in purchasing durable goods
ANOVA
Population with age between 18 – 34 years the durable goods will be the fastest segment of consumer market in the ’80s (Kasulis, 1979) Middle population will show various purchase models of durable goods (Kasulis, 1979)
Endowment with durable goods = f (usefulness, income, age) (Corfman, Lehmann, Narayanan, 1991)
The purchase decision for a durable good respectively is taken within the household and not individually (Guiltinan, 2010)
H9 – There are significant differences related to the place, period and manner of buying in line with various socio-demographic characteristics of head of household.
3. Sampling descriptions
In the sample formation, and consequentl
national distribution of urban households according to two criteria, namely: the distribution of urban households based on occupation and level of education of the household head, sample used in our research being illustrated in
in Tirgu Mures, by filling in a questionnaire,
head of the household, filling in the questionnaire being carried
operator. Investigated population has been represented by urban households, in municipality, respectively.
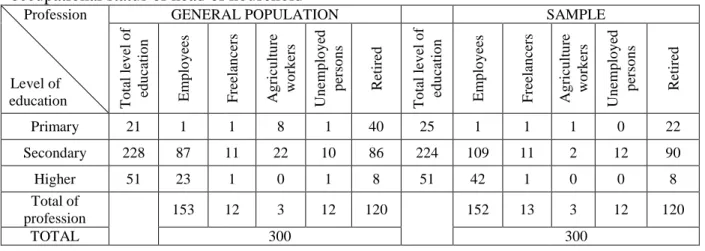
Table 2 – Distribution in general population and sample according to training level and occupational status of head of household
Profession Level of education GENERAL POPULATION T o ta l le v el o f ed u ca ti o n E m p lo y ee s F re el an ce rs Primary 21 1 Secondary 228 87 11 Higher 51 23 Total of profession 153 12 TOTAL
To increase the representativeness of the sample, we considered scheme of combined sampling, respectively the
two layers as follows:
• first layer consists of the household head occupation
including the following categorie
employed person with high
respectively employers and self
• The second layer consisting of
primary level: no school, elementary school, secondary school
vocational school, high
college / university, postgraduate studies
In applying the quota sampling
be achieved while respecting the distribution of households according to statistics at the national level.
For information gathering stage we used a questionnaire administered by tra operators, namely trained students who have practical experience in this field, questionnaire containing a broad range of scales both classical and specific to marketing data and, implicitly, identification of socio
Indicators of hard core trend • Average size of household
and equal to 7.6 % thus showing a uniform population and an average representative within the sample;
3. Sampling descriptions
In the sample formation, and consequently to ensure its representativeness, we started from households according to two criteria, namely: the distribution of urban households based on occupation and level of education of the household head,
search being illustrated in Table 2.The data was collected in May 2011, Mures, by filling in a questionnaire, at respondent’s residence, having the quality of head of the household, filling in the questionnaire being carried-out by a previously qu
Investigated population has been represented by urban households, in
Distribution in general population and sample according to training level and occupational status of head of household
GENERAL POPULATION SAMPLE
F re el an ce rs A g ri cu lt u re w o rk er s U n em p lo y ed p er so n s R et ir ed T o ta l le v el o f ed u ca ti o n E m p lo y ee s F re el an ce rs 1 8 1 40 25 1 1 11 22 10 86 224 109 11 1 0 1 8 51 42 1 12 3 12 120 152 13 300
To increase the representativeness of the sample, we considered appropriate to apply a scheme of combined sampling, respectively the quota sampling and stratified sampling
first layer consists of the household head occupation, including:
including the following categories: manager, employed person with higher education,
employed person with high-school education, unqualified laborer, freelancers employers and self-employed, farmers, unemployed, retired.
consisting of the level of training of household head
no school, elementary school, secondary school
vocational school, high-school, technical/craftsmen school, higher education level: college / university, postgraduate studies.
quota sampling there have been distributed to each operator the quotas to
be achieved while respecting the distribution of households according to statistics at the For information gathering stage we used a questionnaire administered by tra operators, namely trained students who have practical experience in this field, questionnaire containing a broad range of scales both classical and specific to marketing data and, implicitly, identification of socio-demographic variables of the household head characteristics
Indicators of hard core trend are provided by:
Average size of household in the sample is 3 people, variation coefficient
thus showing a uniform population and an average representative y to ensure its representativeness, we started from households according to two criteria, namely: the distribution of urban households based on occupation and level of education of the household head, he 2.The data was collected in May 2011, at respondent’s residence, having the quality of out by a previously qualified Investigated population has been represented by urban households, in Tirgu Mures
Distribution in general population and sample according to training level and SAMPLE A g ri cu lt u re w o rk er s U n em p lo y ed p er so n s R et ir ed 1 0 22 2 12 90 0 0 8 3 12 120 300 appropriate to apply a
stratified sampling, using
, including: employed persons,
manager, employed person with higher education, school education, unqualified laborer, freelancers,
, farmers, unemployed, retired.
f household head, as follows: no school, elementary school, secondary school, secondary level:
, higher education level:
there have been distributed to each operator the quotas to be achieved while respecting the distribution of households according to statistics at the For information gathering stage we used a questionnaire administered by trained operators, namely trained students who have practical experience in this field, questionnaire containing a broad range of scales both classical and specific to marketing data and, old head characteristics
variation coefficient calculated
• Of households with children below 18 years, the average number of children per
household is 1 child per household.
• Average age of household head is 49.37 years, this value is the result of a high
percentage of households of pensioners in the sample, 40 % respectively, the average being representative for 70 % of population (variation coefficient is 29.7 %).
For this study the following durable goods have been investigated (havign as starting point the official statistics of the National Institute of Statistics in Romania and EUROSTAT, to which have been added goods subject to foreign research), respectively: car, land telephone, mobile telephone, refrigerator, paraboloidal antenna / cable, internet access, color TV, freezer/refrigerating box, aautomatic washing machine, dish washing machine, computer, laptop, LCD monitor, camera, digital camera, video camera, hi – fi audio system, DVD player, printer / multifunction, sewing machine, microwave, hood, cooker, radio cassette player, audio tower, bicycle, motorbike / moped, vacuum cleaner, cosmetic care appliances, body care appliances, double glazing, kitchen machine, air conditioning, home cinema system.
4. Main findings of the research
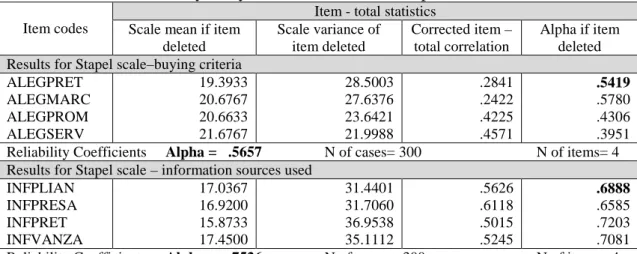
4.1. Presentation of results –analysis of item validity by means of Cronbach alpha and split - half method
As the Stapel scale has been used in the questionnaire to measure criteria used in choosing durable goods (price -ALEGPRET, brand - ALEGMARC, promotions/offers - ALEGPROM, post-sale service - ALEGSERV), and also, to measure sources of information that influence them in their selection (promotional leaflets-INFPLIAN, special press – INFPRESA, recommendations of friends - INFPRET, recommendations of sellers - INFVANZA)we have shown as response versions variables whose grouping we considered it was necessary to be tested, we used, by means of the SPSS software, analysis of validity in relation to items in the
questionnaire by means of two methods that evaluate internal consistency of items: split – half method and Cronbach alpha coefficient as indicator of scale precision (internal consistency
index)
Therefore, for variables measured on the Stapel scale and the Likert scale, results for calculation of the Cronbach alpha coefficient are (Table 3):
Table 3 – Results for reliability analysis – scale. Cronbach Alpha Item codes
Item - total statistics Scale mean if item
deleted Scale variance of item deleted Corrected item – total correlation Alpha if item deleted Results for Stapel scale–buying criteria
ALEGPRET ALEGMARC ALEGPROM ALEGSERV 19.3933 20.6767 20.6633 21.6767 28.5003 27.6376 23.6421 21.9988 .2841 .2422 .4225 .4571 .5419 .5780 .4306 .3951
Reliability Coefficients Alpha = .5657 N of cases= 300 N of items= 4
Results for Stapel scale – information sources used INFPLIAN INFPRESA INFPRET INFVANZA 17.0367 16.9200 15.8733 17.4500 31.4401 31.7060 36.9538 35.1112 .5626 .6118 .5015 .5245 .6888 .6585 .7203 .7081 Reliability Coefficients Alpha = .7526 N of cases = 300 N of items= 4 NOTE for Items codes: 1) price -ALEGPRET, brand - ALEGMARC, promotions/offers - ALEGPROM, post-sale service – ALEGSERV. 2) promotional leaflets- INFPLIAN, special press – INFPRESA, recommendations of friends - INFPRET, recommendations of sellers – INFVANZA.
For criteria used in acquiring goods
value of 0.57 proving that scale has an average precision level
first item (price), the alpha coefficient concerning validity of the three remaining items (brand, promotions, post-sale service
change, it is better to keep the first item,
Mures are price sensitive in the buying process of durable goods. This aspect is explainable considering that, a very high percentage (40%) of households in the study, are made of pensioners, whose income is low compared to the other types of households.
For information sources used in acquiring goods validity of the 4 item-scale has a value of
level, removing the first item (promotional leaflets) leading to declining alpha
0.69, a significant decline indicating that these sources are important in buying goods For variables measuring
measuring attributes taken into account in purchasing durable goods
included variables measure in fact these promotional influences, results being shown in 4.
For attributes taken into accounting acquiring goods methods of item validity, results being shown in
of the alpha coefficient was 0.72 we conclude that variables are measured on a scale with a good precision level, issue also sustained by results of the second method, split
the Spearman – Brown validity coeffici precision.
4.2. Presentation of results –
Most variables are measured on nominal or ordinal scales useful to test ranks of ordinal variables
been used for linked scores (ranks)
Within the research we requested respondents to rank the “
Stapel scale (providing scores/ranks) with values between 1 and10 compared to other three
variables (promotions, brand, post
again as attribute evaluated on a scale from1 to 5 alongside other 11 attributes, aiming to notice if ,evaluated by several attributes,
In the first case, it achieved the highest score, in the second case it has been gone beyond by another attribute, namely “
differences between the two mean
provided by the same respondents. Results achieved with the SPSS software as a result of applying the Wilcoxon test are summarized in
It is therefore noticed that the number of 10 and 14 non-existent differences
14.303) it means that, the difference between the two ranks is significant and hence, together with several attributes than those taken into account
price is not so important in buying goods but their quality.
retailers, emphasizing that, though price sensitive, consumers (households respectively) in Romania gives priority to quality of durab
buying these goods.
used in acquiring goods, the alpha coefficient of 4
item-scale has an average precision level. Moreover if we remove the
ha coefficient concerning validity of the three remaining items
sale service) decreases to 0.54 and as long as this is a very small
change, it is better to keep the first item, price. This issue reveals that, households in Tirgu res are price sensitive in the buying process of durable goods. This aspect is explainable considering that, a very high percentage (40%) of households in the study, are made of pensioners, whose income is low compared to the other types of households.
information sources used in acquiring goods, the alpha coefficient concerning
scale has a value of 0.75 proving that the scale has a good precision removing the first item (promotional leaflets) leading to declining alpha
0.69, a significant decline indicating that these sources are important in buying goods For variables measuring promotional influences in buying a commodity
attributes taken into account in purchasing durable goods5we wante included variables measure in fact these promotional influences, results being shown in
attributes taken into accounting acquiring goods, we have used both analysis
methods of item validity, results being shown in Table 4. As through the first method, a value of the alpha coefficient was 0.72 we conclude that variables are measured on a scale with a good precision level, issue also sustained by results of the second method, split
Brown validity coefficient has the value of 0.66 showing a mild to good
Wilcoxon test
ost variables are measured on nominal or ordinal scales, and therefore
of ordinal variables within sampling. Therefore the Wilcoxon (ranks).
Within the research we requested respondents to rank the “price” variable one on the (providing scores/ranks) with values between 1 and10 compared to other three
omotions, brand, post-sale service) considered as a criterium in selecting goods
again as attribute evaluated on a scale from1 to 5 alongside other 11 attributes, aiming to notice if ,evaluated by several attributes, price variable still has the same rank
In the first case, it achieved the highest score, in the second case it has been gone beyond by another attribute, namely “quality”. Therefore, we considered useful
between the two mean ranks, considered to have a relational natu
provided by the same respondents. Results achieved with the SPSS software as a result of are summarized in Table 5.
It is therefore noticed that the number of negative differences is 275 and those
existent differences, for a significance level α < 0.05, Z rank has the value (
14.303) it means that, the difference between the two ranks is significant and hence, together with several attributes than those taken into account when the Stapel scale has been used, the
price is not so important in buying goods but their quality. This result is an important one for
retailers, emphasizing that, though price sensitive, consumers (households respectively) in Romania gives priority to quality of durable goods, aspect due to mainly the frequency of -scale validity has a . Moreover if we remove the ha coefficient concerning validity of the three remaining items to 0.54 and as long as this is a very small . This issue reveals that, households in Tirgu res are price sensitive in the buying process of durable goods. This aspect is explainable considering that, a very high percentage (40%) of households in the study, are made of pensioners, whose income is low compared to the other types of households.
, the alpha coefficient concerning
has a good precision
removing the first item (promotional leaflets) leading to declining alpha coefficient to 0.69, a significant decline indicating that these sources are important in buying goods.
promotional influences in buying a commodity4and those we wanted to test if included variables measure in fact these promotional influences, results being shown in Table , we have used both analysis ugh the first method, a value of the alpha coefficient was 0.72 we conclude that variables are measured on a scale with a good precision level, issue also sustained by results of the second method, split – half, where 0.66 showing a mild to good
, and therefore we consider it is
the Wilcoxon test has
” variable one on the (providing scores/ranks) with values between 1 and10 compared to other three ) considered as a criterium in selecting goods again as attribute evaluated on a scale from1 to 5 alongside other 11 attributes, aiming to
variable still has the same rank .
In the first case, it achieved the highest score, in the second case it has been gone . Therefore, we considered useful to test the , considered to have a relational nature as they were provided by the same respondents. Results achieved with the SPSS software as a result of is 275 and those positive are < 0.05, Z rank has the value (-14.303) it means that, the difference between the two ranks is significant and hence, together
scale has been used, the
This result is an important one for retailers, emphasizing that, though price sensitive, consumers (households respectively) in le goods, aspect due to mainly the frequency of
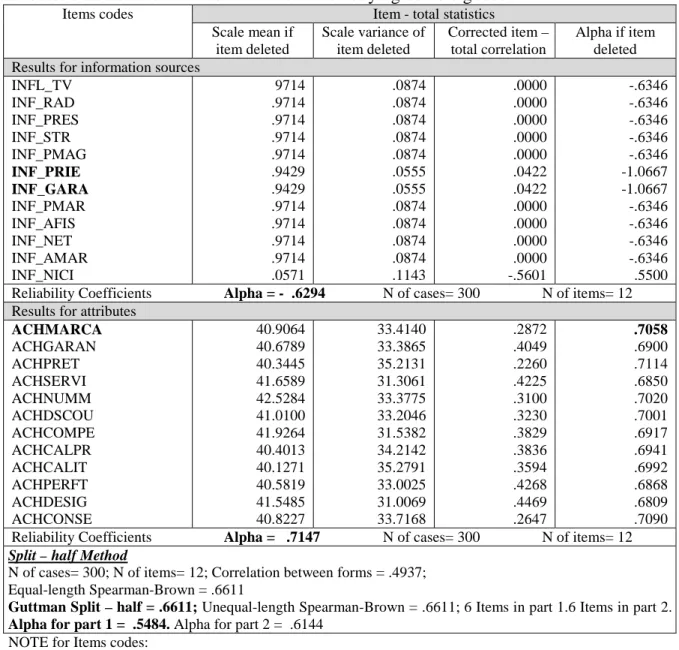
Table 4 – Results for reliability analysis – scale. Cronbach Alpha for information sources and attributes that are taken into consideration when buying durable goods
Items codes Item - total statistics
Scale mean if item deleted Scale variance of item deleted Corrected item – total correlation Alpha if item deleted Results for information sources
INFL_TV INF_RAD INF_PRES INF_STR INF_PMAG INF_PRIE INF_GARA INF_PMAR INF_AFIS INF_NET INF_AMAR INF_NICI 9714 .9714 .9714 .9714 .9714 .9429 .9429 .9714 .9714 .9714 .9714 .0571 .0874 .0874 .0874 .0874 .0874 .0555 .0555 .0874 .0874 .0874 .0874 .1143 .0000 .0000 .0000 .0000 .0000 .0422 .0422 .0000 .0000 .0000 .0000 -.5601 -.6346 -.6346 -.6346 -.6346 -.6346 -1.0667 -1.0667 -.6346 -.6346 -.6346 -.6346 .5500 Reliability Coefficients Alpha = - .6294 N of cases= 300 N of items= 12 Results for attributes
ACHMARCA ACHGARAN ACHPRET ACHSERVI ACHNUMM ACHDSCOU ACHCOMPE ACHCALPR ACHCALIT ACHPERFT ACHDESIG ACHCONSE 40.9064 40.6789 40.3445 41.6589 42.5284 41.0100 41.9264 40.4013 40.1271 40.5819 41.5485 40.8227 33.4140 33.3865 35.2131 31.3061 33.3775 33.2046 31.5382 34.2142 35.2791 33.0025 31.0069 33.7168 .2872 .4049 .2260 .4225 .3100 .3230 .3829 .3836 .3594 .4268 .4469 .2647 .7058 .6900 .7114 .6850 .7020 .7001 .6917 .6941 .6992 .6868 .6809 .7090 Reliability Coefficients Alpha = .7147 N of cases= 300 N of items= 12
Split – half Method
N of cases= 300; N of items= 12; Correlation between forms = .4937; Equal-length Spearman-Brown = .6611
Guttman Split – half = .6611; Unequal-length Spearman-Brown = .6611; 6 Items in part 1.6 Items in part 2. Alpha for part 1 = .5484. Alpha for part 2 = .6144
NOTE for Items codes:
1) TVcommercials – INFL_TV, radio commercials INF_RAD, press commercials INF_PRES, street boards -INF_STR, promotional leaflets of shop -INF_PMAG, advice of friends or acquaintances-INF_PRIE, provided warranty -INF_GARA, promotional leaflets of brands - INF_PMAR, posters in and on public means of transport INF_AFIS, internet commercials INF_NET, the same brand that has already been used INF_AMAR, no influence INF_NICI. 2) Brand ACHMARCA, provided warranty ACHGARAN, price -ACHPRET, post-sales service -ACHSERVI, shop name -ACHNUMM, provided discounts -ACHDSCOU, personnel competence -ACHCOMPE, quality-price ratio -ACHCALPR, product quality -ACHCALIT, product technical performances -ACHPERFT, product design -ACHDESIG, energy consumption class –ACHCONSE. Table 5 – Results for Wilcoxon signed ranks test
Variables tested Ranks N Mean rank Sum of ranks
Price_Stapel scale variable Price_11 attributes variable
Negative ranks 275 145.89 40118.50
Positive ranks 10 63.65 636.50
Ties 14
Total 299
Recommendations/advice of friends_ Stapel scala variable
Recommendations/advice of friends variable_10 variables Negative ranks 299 150.00 44850.00 Positive ranks 0 0.00 0.00 Ties 1 Total 300
We have also applied the Wilcoxon test for the variable that, measured on the
three variables (special press,
measured alongside other 10 variables has achieved
“TV commercials”, the results achieved with SPSS being shown in noticed that the negative differences
difference, for a significance level
the difference between the two ranks is significant and hence, alongside several attributes than those taken into account when the Staple scale has been used
important in buying goods but
buying goods. This result emphasizes that, Romanian consumers are influenced and trust
information shown in TV advertisements, thus proving their efficiency for these goods.
4.3. Presentation of results – processing of multiple choice questions
As the question in questionnaire with regards to the place where households within sample buy durable goods, contains multiple choice answers
test the significance of percentages obtained to this question, their distribution of the answers being found in Table 6.
Table 6 – Distribution of commodity acquisition places
Response version Hypermarket
Number of answers Relative frequencies
Testing of proportion conformity in case of a multiple choice question formula and was the base for testing significance of percentages achieved by
and specialty shops, as buying place of durable goods.
(
)
(
)
n p p p p p p tc 2 2 1 1 2 1 1 1− + − + − =We consider the value of p
than its theoretical value for a probability of 95 %, 1.96 respectively, and it results that, the
difference is significant for a proportion of 95% of households, and thus special shop represent the main place of buying the durable goods for households in Tirgu municipality.
4.5. Presentation of results – ANOVA
Considered often as an extension of the t test of testing two means, ANOVA allows the testing of means in case when the
the marketing research concerning the durable goods market in Tirgu Mures, respondents have been required to evaluate by
influence) – 10 (it influences very much) four criteria used in buying durable goods,
brand, promotions/offers and post
variable ranking this variable to the first place. Distribu variable – dependent variable
We have also applied the Wilcoxon test for the ”recommendations/a
variable that, measured on the Stapel scale has achieved the best rank compared to other , promotional leaflets, and recommendations of sellers
measured alongside other 10 variables has achieved the second rank, being gone beyond by ”, the results achieved with SPSS being shown in Table
negative differences are 299 and the positive ones are 0 and a
significance level α < 0.05, the Z rank has a value of (-15.028) meaning that
the difference between the two ranks is significant and hence, alongside several attributes than
when the Staple scale has been used “advice of friends
t in buying goods but TV commercials have a higher influence
. This result emphasizes that, Romanian consumers are influenced and trust information shown in TV advertisements, thus proving their efficiency for these goods.
processing of multiple choice questions
As the question in questionnaire with regards to the place where households within sample durable goods, contains multiple choice answers (Table 6), we consider it is necessary to test the significance of percentages obtained to this question, their distribution of the answers
Distribution of commodity acquisition places
Hypermarket Supermarket Special shops Internet
89 20 128 9
29.7 6.7 42.7 3.0
Testing of proportion conformity in case of a multiple choice question formula and was the base for testing significance of percentages achieved by
, as buying place of durable goods.
(
p1*p2 p12)
2 −
+
where p1 = percentage achieved from
specialty shops
p2 = percentage achieved by hypermarket
p12 = common percentage of the two
response versions
of p12equal to 0, hence it results tc = 2.677 that has a higher value
than its theoretical value for a probability of 95 %, 1.96 respectively, and it results that, the
significant for a proportion of 95% of households, and thus special shop represent the main place of buying the durable goods for households in Tirgu
ANOVA
an extension of the t test of testing two means, ANOVA allows the testing of means in case when the independent variable shows more than three ways. Within the marketing research concerning the durable goods market in Tirgu Mures, respondents have been required to evaluate by means of the Stapel scale, built on range 1 (does not
uences very much) four criteria used in buying durable goods,
brand, promotions/offers and post-sale service, respectively, mean rank related to the price
variable ranking this variable to the first place. Distribution of ranks provided to
dependent variable – of those 300 households in the sample, differentiated recommendations/advice of friends”
has achieved the best rank compared to other
recommendations of sellers) and that,
the second rank, being gone beyond by Table 5.It is therefore are 0 and a non-existent 15.028) meaning that the difference between the two ranks is significant and hence, alongside several attributes than
advice of friends” are not so
have a higher influence on the decision of . This result emphasizes that, Romanian consumers are influenced and trust information shown in TV advertisements, thus proving their efficiency for these goods.
As the question in questionnaire with regards to the place where households within sample 6), we consider it is necessary to test the significance of percentages obtained to this question, their distribution of the answers
Internet Anywhere
74
3.0 25.0
Testing of proportion conformity in case of a multiple choice question–has the following formula and was the base for testing significance of percentages achieved byhypermarkets
= percentage achieved from
= percentage achieved by hypermarket = common percentage of the two
= 2.677 that has a higher value than its theoretical value for a probability of 95 %, 1.96 respectively, and it results that, the
significant for a proportion of 95% of households, and thus special shops represent the main place of buying the durable goods for households in Tirgu Mures
an extension of the t test of testing two means, ANOVA allows the independent variable shows more than three ways. Within the marketing research concerning the durable goods market in Tirgu Mures, respondents means of the Stapel scale, built on range 1 (does not uences very much) four criteria used in buying durable goods, price, , respectively, mean rank related to the price tion of ranks provided to the price of those 300 households in the sample, differentiated
according to the education level of household head - independent variable –is shown in Table 7.
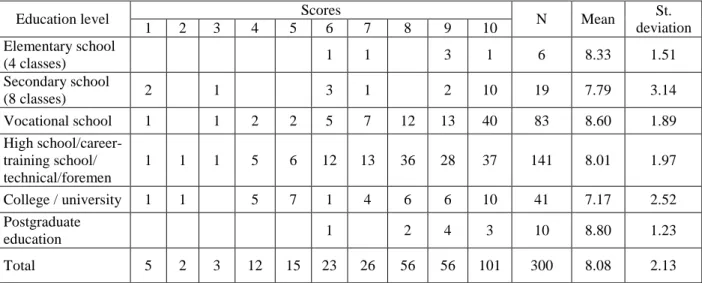
Table 7 – Distribution of scores according to education level of household head and descriptive statistics of ANOVA
Education level Scores N Mean St.
deviation 1 2 3 4 5 6 7 8 9 10 Elementary school (4 classes) 1 1 3 1 6 8.33 1.51 Secondary school (8 classes) 2 1 3 1 2 10 19 7.79 3.14 Vocational school 1 1 2 2 5 7 12 13 40 83 8.60 1.89 High school/career-training school/ technical/foremen 1 1 1 5 6 12 13 36 28 37 141 8.01 1.97 College / university 1 1 5 7 1 4 6 6 10 41 7.17 2.52 Postgraduate education 1 2 4 3 10 8.80 1.23 Total 5 2 3 12 15 23 26 56 56 101 300 8.08 2.13
Starting from these data, we shall apply ANOVA with a single factor to evaluate statistically the impact of education level on providing ranks for the „price” criterium in acquiring durable goods; we use the SPSS software for data processing, the null hypothesis H0 being equality of means of the six categories of education levels.
From data illustrated in Table 7are noticed the main descriptive statistics, the number of
cases, means achieved by the price criterium typical to each education level and standard deviation on each education level and on total sample, respectively. Therefore it is noticed
that, between the means of the six education levels are differences and, if these education levels would be regrouped in 3 levels, primary, secondary and higher, respectively so as elementary and gymnasium education corresponds to the primary level, we notice that between the two levels are differences between means (8.33 and 7.79). For the secondary level we group vocational school and high school/career-training school/ technical school/ foremen, the means of the two are different (8.01 and 7.17).The same thing being valid for the last regroup, the higher level comprises college / university and postgraduate studies, the two means being 7.17 and 8.80.
The results of ANOVA are illustrated in Table8, the F ratio being significant at 0.013 as being lower than 0.05 and is achieved by dividing the sum of deviation squares from the mean between groups to the sum of squares from the means within groups that provides us an F ratio equal with 2.928. That means that there is a significant difference between the six groups and therefore the null hypothesis is rejected.
Table 8 – ANOVA results
Sum of Squares df Mean Square F Sig.
Between Groups 64.468 5 12.894 2.928 .013
Within Groups 1294.769 294 4.404