Introduction: research background for LIS
Artificial intelligence (AI) constitutes an essential component of modern life in civil-isation. Labour costs, high specialisation of many professions, human error have become too much of a burden in the 21stcentury to maintain the archaic structure of the labour market from the industrial era. Humans have begun to be replaced by robots, not only in the simplest and repetitive activities but also in those requiring precise qualifications. In the decision-making processes, artificial intelligence com-plements or replaces military navigators, aircraft pilots, judges, physicians, etc. Given the level of complexity of the activities of the representatives of these professions, it seems quite simple and natural to replace taxi or truck drivers, salesmen or sales con-sultants, with robots. Artificial intelligence has become a commonplace among people causing curiosity in some, fear in others, and sometimes even violence against robots – as we may have read some time ago in the New York Times. This occurs despite the fact that the Moral Machine Experiment developed by the MIT Media Lab, which is passed by autonomous car control units, causes enormous decision-making and ethical problems for people. So-called Weak AI, that is, the operations of a computer system imitating, to a limited extent, intelligent behaviour1are already in place. The time of Strong AI (or Full AI), that is, one that is capable of performing most or all of the intel-lectual tasks that humans perform2, will probably come in the following years.
Do anthropomorphic service robots
affect people’s sense of security?
On the sidelines of the reflection on the
future of the labour market in LIS
by Tomasz Kruszewski
TOMASZ KRUSZEWSKI, Nicolaus Copernicus University in Toruń, Institute of Information and Communication Research, e-mail [email protected].
Web sites last accessed: April 10, 2020.
Where not expressly indicated, figures are taken from the data collected during the investigation and from the web with CC BY 2.0 license.
1 Fernando Iafrate, Artificial intelligence and big data: the birth of a new intelligence. London: ISTE;
Hoboken: John Wiley, 2018, p. 99.
2 Keng Siau; Weiyu Wang, Building trust in artificial intelligence, machine learning, and robotics,
«Cutter business technology journal», 31 (2018), n. 2, p. 47-53: p. 53, <https://www.cutter.com/article/ building-trust-artificial-intelligence-machine-learning-and-robotics-498981>.
In this light, the future of the profession of librarian seems uncertain. Numerous indicators, including longitudinal studies on the social prestige of the profession3 show that if it was to survive, decisive action is needed to change the paradigm of this profession. The modern librarian will no longer be an enlightened erudite, but must be an erudite of the digital age, where classical library services become only a small part of his work. They must be supplemented with competences typical of other professions related to science and broadly understood education, including life-long learning, support in business activities, pro-social services. The longitudinal survey carried out by the author of the present article (two editions: 2003 and 2015) indicates that the social perception of this profession has been changing significantly. The results of the research show that librarians are associated with modern information technologies and thus are accepted and liked by the public. Simultaneously, despite more varied tasks of the library professionals, including the use of modern technolo-gies, the students of librarianship, information architecture, information management and book studies and similar studies are less and less interested in being employed in libraries4. Thus, maybe a discussion about the future of librarian’s profession should concern, to a greater extent, those who will find a job in a library. It’s believed that taking into consideration young people’s (the candidates for the job in the libraries) critical attitudes towards librarian’s profession, artificial intelligence will probably have to replace a human being in all fundamental aspects of profession mentioned earlier. There would be a job left for a man, as part of soft skills, where emotional intelligence and creativity are essential. Naturally, neither a single librarian nor even a team of employees of a single library can meet the requirements of the digital society. They require effective tools, which is what artificial intelligence provides. It is already being tested in information services, as virtual assistants, e.g. in museums, archives or libraries5. The issues of robotisation and automation have therefore also become a subject of interest for researchers in library and information science. The condition of research on artificial intelligence and its application in the processes of information management in the library has recently been the subject of interest of, among others, the present author6, Rossana Morriello7, Mirko L. A. Tavosanis8, and Magdalena Wójcik9.
3 E.g. Tomasz Kruszewski, Wizerunek bibliotekarzy w opiniach ich następców po dekadzie - raport z
badań, «Przegląd biblioteczny», 84 (2016), n. 4, p. 545-556, <http://ojs.sbp.pl/index.php/pb/
article/view/488>.
4 Ibidem.
5 Magdalena Wójcik, Rozszerzona rzeczywistość w usługach informacyjnych bibliotek. Kraków: Wydaw-nictwo Uniwersytetu Jagiellońskiego, 2018, p. 110-111.
6 Tomasz Kruszewski, Ocena zależności między wizerunkiem robota a zaufaniem do robota w świetle
koncepcji doliny niesamowitości, na przykładzie zawodów o wysokim prestiżu społecznym, «Zagadnienia
informacji naukowej», 57 (2019), n. 2, p. 80-96, <http://ojs.sbp.pl/index.php/zin/article/view/461>.
7 Rossana Morriello, Blockchain, intelligenza artificiale e internet delle cose in biblioteca, «AIB studi»,
59 (2019), n. 1-2, p. 45-68, <https://aibstudi.aib.it/article/view/11927/11449>.
8 Mirko L. A. Tavosanis, Libraries, linguistics and artificial intelligence: J. C. R. Licklider and the libraries
of the future, «JLIS.it», 8 (2017), n. 3, p. 137-147, <https://www.jlis.it/article/view/12271/11283>.
9 Magdalena Wójcik, Sztuczna inteligencja - potencjał dla procesów zarządzania informacją, «Przegląd biblioteczny», 86 (2018), n. 1, p. 5-15, <http://ojs.sbp.pl/index.php/pb/article/view/563>.
One of the components of the development of artificial intelligence is anthro-pomorphisation, that is, attributing or giving human characteristics, such as appear-ance, behaviour, thinking, to objects or non-human beings. The objects, or more precisely, the devices, are service robots of anthropomorphic features, functioning in the physical world.
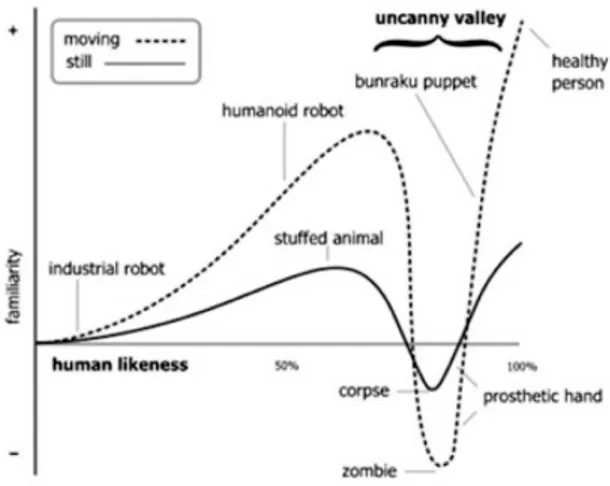
The research presented in the paper is of a pilot character and is ultimately aimed at understanding the relationship between the sense of confidence and satisfaction of customers to whom the direct services of robots with anthropomorphic features are provided. The sense of security in the company of a robot and the sympathy towards it are perhaps determined by a phenomenon with psychological traits, which is usually referred to as the uncanny valley. The phenomenon would manifest itself as follows. An increasing stimulus in the form of a growing similarity between a robot and a human being produces a growing positive emotional response to the stimulus, but when the similarity approaches perfection, the individual’s emotional response drops sharply and becomes strongly negative10. This decline is so-called the uncanny valley – a phenomenon with a term established by Masahiro Mori11. At the same time, numerous studies interpret the causes of this phenomenon in different ways, some revise it, while others question its validity12. The research, carried out with dif-ferent methodologies, at difdif-ferent times and among people from difdif-ferent cultures, do not provide a clear answer in this matter. The substantiations arise in numerous scientific disciplines, from the humanities to functional and structural research of the brain and medicine13. It should be mentioned that the expressiveness of the
10 Tyler J. Burleigh; Jordan R. Schoenherr; Guy L. Lacroix, Does the uncanny valley exist? An empirical
test of the relationship between eeriness and the human likeness of digitally created faces, «Computers
in human behaviour», 29 (2013), n. 3, p. 759-771: p. 759, <https://www.sciencedirect.com/science/ article/pii/S0747563212003263>.
11 Masahiro Mori; Karl F. MacDorman; Nori Kageki, The uncanny valley [from the field], «IEEE robotics
& automation magazine», 19 (2012), n. 2, p. 98-100: p. 98, <https://ieeexplore.ieee.org/stamp/ stamp.jsp?tp=&arnumber=6213238>.
12 Karl F. MacDorman; Debaleena Chattopadhyay, Reducing consistency in human realism increases
the uncanny valley effect: increasing category uncertainty does not, «Cognition», 146 (2016), p.
190-205: p. 190, <https://www.sciencedirect.com/science/article/pii/S0010027715300755>.
13 See: T. J. Burleigh; J. R. Schoenherr; G. L. Lacroix, Does the uncanny valley exist? cit., p. 2-4; Elena
Pasquinelli, La valle del perturbante e la realtà virtuale, «Sistemi intelligenti», 18 (2006), n. 3, p. 445-470, <https://www.rivisteweb.it/doi/10.1422/23348>; Yuki Yamada; Takahiro Kawabe; Keiko Ihaya,
Categorization difficulty is associated with negative evaluation in the “uncanny valley phenomenon”,
«Japanese psychological research», 55 (2013), n. 1, p. 20-32: p. 20-21, <https://onlinelibrary.wiley.com/ doi/full/10.1111/j.1468-5884.2012.00538.x>; Maya B. Mathur; David B. Reichling, Navigating a social
world with robot partners: a quantitative cartography of the uncanny valley, «Cognition», 146 (2016),
p. 22-32, <https://www.sciencedirect.com/science/article/pii/S0010027715300640?via%3Dihub>; Dawid Ratajczyk; Marcin Jukiewicz; Paweł Lupkowski, Evaluation of the uncanny valley hypothesis based
on declared emotional response and psychophysiological reaction, «Bio-algorithms and med-systems»,
15 (2019), n. 2, p. 1-10, <https://www.degruyter.com/view/journals/bams/15/2/article-20190008.xml>; Astrid M. Rosenthal-von der Pütten [et al.], Neural mechanisms for accepting and rejecting artificial
social partners in the uncanny valley, «The journal of neuroscience», 39 (2019), n. 33, p. 6555-6570,
uncanny valley is determined by a number of factors, such as the cultural and social characteristics of the research participants, their previous experiences with robots, as well as personality traits14. Consequently, the test results obtained should not be interpreted as absolute data. Researchers are also searching for potential consequences arising for individuals15. The robot’s resemblance to humans can probably also cause men to lose their sense of security as a result of feeling threatened by being replaced. The research conducted by Carl Benedikt Frey and Michael A. Osborne from Oxford University indicated in 2013 that this was only the case with regard to the performance of professional activities. Nearly 70% of workplaces are more or less at risk from automation and computerisation16.
It is observed that satisfaction with the quality of service delivery is linked to the public perception of certain professions. In order to determine complementarily which aspects of the librarian’s work – the erudite of the digital age – were to remain in the hands of humans rather than machines, several studies on the perception of prestigious professions were reviewed. Research carried out by The Varkey Foundation and the University of Sussex has released its latest Global teacher status: index for 2018, which gives insights into the world of teaching in 35 countries from all over the world, including Germany, Spain, Italy, Great Britain, France, but also South Africa, Ghana, Turkey, India, China, Korea, Brazil, Argentina, and Canada. The highest-ranked profession was physician, followed by lawyer and engineer. Immediately fol-lowed by such professions as teacher, accountant, social worker, and librarian with similar results17. Considering the local parameters, it is worth quoting the results of research on attitudes towards professions with high social prestige, which was carried out in two countries of the ‘Western world’, but of entirely different social and cultural characteristics. In the latest research published by the Polish Centre for Public Opinion Research (CBOS) on the ranking of prestigious occupations, conducted in 2013 on a representative sample of 904 adult residents of Poland, 30 occupations appeared. A firefighter was the most respected in society (87% of high regard declarations), fol-lowed by university professor (82% of high regard declarations) and skilled worker (81%). Moreover, representatives of professions characterised by a high social utility, e.g. nurse and physician (78% and 71%, respectively), were highly ranked in the hier-archy. The accountant (63%) and the salesman (51%) achieved lower ranks, but still with a predominance of positive opinions and giving a place in the top twenty of the ranking of social prestige professions18. Meanwhile, a recent survey by Harris poll from 2014 indicates that American adults consider physicians (88%), military officers
14 Christoph Bartneck [et al.], Measurement instruments for the anthropomorphism, animacy, likeability,
perceived intelligence, and perceived safety of robots, «International journal of social robotics», 1
(2009), n. 1, p. 71-81: p. 78, <https://link.springer.com/article/10.1007/s12369-008-0001-3>.
15 M. B. Mathur; D. B. Reichling, Navigating a social world with robot partners cit., p. 22-23. 16 Carl Benedikt Frey; Michael A. Osborne, The future of employment: how susceptible are jobs to
computerisation?. September 7, 2013, p. 37, <https://www.oxfordmartin.ox.ac.uk/downloads/academic/ The_Future_of_Employment.pdf>.
17 Peter Dolton [et al.], Global teacher status: index for 2018. London: The Varkey Foundation, 2018,
<https://www.varkeyfoundation.org/media/4853/gts-index-9-11-2018.pdf>.
18 Agnieszka Cybulska, Komunikat z badań: BS/164/2013. Prestiż zawodów. Warszawa: Centrum
(78%), and scientists (76%) to be the most prestigious occupations. High ranking was also noted in relation to nurses (70%), teachers (60%), and accountants (40%; at the same time 78% of respondents would encourage their children to become an accountant)19. From within the above-mentioned studies, six professions that often ranked high in prestige, were selected for tests. These were grouped into three categories based on the author’s typology of professions: so-called ‘knowledge’ professions (academic professor, accountant), so-called ‘invasive’ professions (physician, nurse) and ‘service’ professions (salesman, skilled worker, professional).
Research methodology
The process of data analysis was carried out in two stages, the first one focused on the graphical interpretation of ranking distribution by profession. The uncanny valley concept assumes the existence of a minimum, which is observed for a certain moment when the image of a robot begins to be more similar to a human being. This moment (the uncanny valley) is not constant – it should be assumed that it depends, among other things, on the individual characteristics of the respondents, their age, their various previous experiences, including previous interactions with robots. In this study, a smaller number of photographs were used, however, at the initial stage it was assumed possible to observe the withdrawal of respondents in the assessment of a robot representing a mixture of a robot and a human being (Figure 2). In other words, this robot will be less likely to be trusted than others. Such an interpretation does not determine the uncanny valley in accordance with the methodology provided by the research presented in the world literature, however, it allows concluding that the same withdrawal could be observed if the image of the robot was reproduced in many photographs with a slow transition from the state from Figure 1 to the state of Figure 3. The decline in confidence is understood as a premise for further research that could indicate the existence of the uncanny valley. By the way, it is worthwhile to conduct future experiments in such a manner that the identification of the moment is based on the evaluation of multiple pho-tographs/recordings of the same robot, on which image slight changes, making it more human-like, are imposed during the survey.
The second part of the study focuses on the verification of the relationship between the image of the robot and the degree of confidence in the robot. The evaluation of the relationships between the variables was carried out by means of chi-square inde-pendence test at various levels. The author’s motivation is to check whether further research on the uncanny valley should be conducted with regard to the division by professions. Both theory and intuition suggest that the trust attributed to a robot may depend on the place where it was installed and the area of life of the person it is to assist (for example, hospital/library).
The test used to verify the hypotheses of independence of two discrete variables was chi-square independence test. The test statistics were expressed with the Formula 1, critical values (χ2α,v) were obtained from chi-square distribution tables with degrees of freedom: v=(r-1)*(k-1) and significance levelα=0.05. Formal notation of the hypotheses as follows20:
19 Hannah Pollack, Doctors, military officers, firefighters, and scientists seen as among America’s
most prestigious occupations, «The Harris poll», n. 85, September 10, 2014, <https://theharrispoll.com/
when-shown-a-list-of-occupations-and-asked-how-much-prestige-each-job-possesses-doctors-top-the-harris-polls-list-with-88-of-u-s-adults-considering-it-to-have-either-a-great-deal-of-prestige-45-2>.
H0: E(nij)=E(ňij); characteristics X and Y are independent.
H1: E(nij)≠E(ňij); characteristics X and Y are not independent, where: - E=expectation operator,
- ňij=theoretical frequencies from independence table, meeting the condition of sto-chastic independence of variables X and Y.
Formula 1
The strength of the correlation between the variables (if H0was rejected in favour of H1) was assessed on the basis of Pearson’s correlation coefficient based on chi-square statistic (Formula 2).
Formula 2
The survey was conducted in 2019. The research area included respondents aged 20-23, that is, representing the so-called digital generation – the next generation following the so-called millennials, hence also called ‘post-millennials’, ‘generation Z’ and a few similar terms21. The sampling was dictated by the fact that they are the youngest generation for whom technology is the main tool for expanding knowledge. They are therefore potentially burdened with the lowest level of anxiety towards modern technologies. The respondents were students of several faculties in the field of humanities and social sciences at three universities: Nicolaus Coper-nicus University in Toruń, WSB University in Bydgoszcz and WSB University in Toruń (faculties: communication and psychology in business, information archi-tecture, military science, information management and library science). Number of completed questionnaires: n=105, of which correctly completed n=99, with gender distribution nfemale=68; nmale=31.
Evaluation of the relationship between the appearance of the robot and confidence
in the robot
Data
Based on the above-mentioned source studies on the prestige of individual pro-fessions, from the top of the rankings of professions chosen according to social respect, six professions were selected. Note those were the following: professor, nurse, skilled worker, accountant, salesman, physician. Moreover, the selection of the profession was based on the author’s typology of occupations, the
charac-21 Generation Z. In: Wikipedia: the free encyclopedia. Version of April 9, 2020, 20:31 UTC, <https://
teristics of which are similar to those of the librarian’s profession, the erudite of digital times: service (salesman, skilled worker), so-called ‘knowledge’ professions (professor, accountant), so-called ‘invasive’ professions (physician, nurse). Each professional group has been assigned three different drawings of a robot with dif-ferent degrees of similarity to a human being, as shown in Figures 1a-c. A robot with a degree of similarity of 0% in each question was represented by the same figure (1a); a robot with a degree of similarity of 50%, by two images, one in the male and one in the female version (Figure 1b), and a robot with 100% similarity, by 6 images, which were adjusted to the average appearance of people for a given professional group. In this case, both genders were expressed in 3 exemplifications. Each professional group was evaluated in terms of liking (and, indirectly, a sense of security) by assessing their willingness to cooperate with the robot, as well as their willingness to obtain services from it according to the key, that is: [-1] least willing; [0] less/moderate willing; [1]: most willing.
Figure 1a – The image of the robot used in the survey by
the degree of similarity to humans – degree of similarity of the robot: 0%
Figure 1b – The images of robots used in the survey by
the degree of similarity to humans – degree of similarity of the robot: 50%
Figure 1c – The images of robots used in the survey by
the degree of similarity to humans – degree of similarity of the robot: 100% (in order: university professor, nurse, qualified worker,
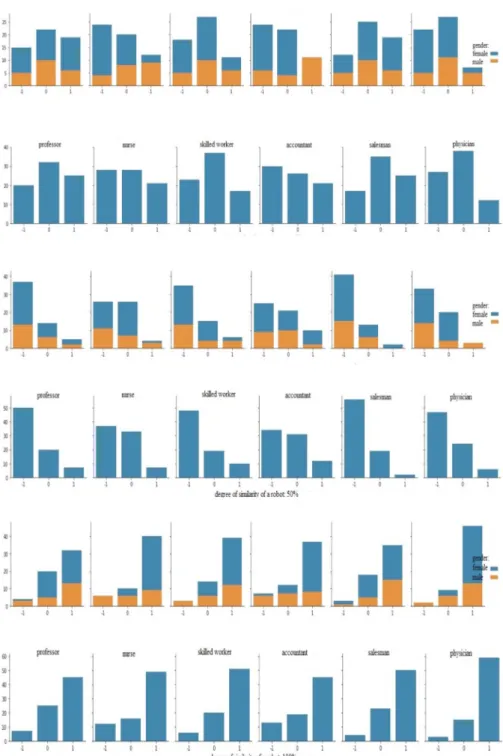
Figure 2 – Distribution of the evaluation of the robots (Figures 1a–c)
by profession and gender for the following evaluation scale: -1=least willing, 0=less/moderate willing, 1=most willing
Figure 3 – Frequency distribution for a variable of a degree of confidence
towards the robot (globally). The table presents the aggregated evaluations, that is, for each robot the evaluations from each professional group were summed up for each respondent
(total number of evaluations n=6*99=594)
Degree of similarity of
the robot
Degree of confidence towards the robot
Least % Less/
moderate % Willing % Sum
0% 179 30.13 256 43.32 159 26.63 594 50% 342 57.57 186 31.47 66 11.06 594 100% 73 12.29 149 25.21 372 62.31 594 Sum - 100 - 100 - 100 Occupational group
Degree of confidence towards the robot 1 (0% of similarity)
Last confidence % Moderate confidence % Willing % Accountant 38 21.23 35 13.67 26 16.35 Physician 31 17.32 51 19.92 17 10.69 Nurse 34 18.99 36 14.06 29 18.24 Professor 24 13.41 42 16.41 33 20.75 Worker 32 17.88 45 17.58 22 13.84 Salesman 20 11.17 47 18.36 32 20.13 Sum 179 256 159 Occupational group
Degree of confidence towards the robot 2 (50% of similarity)
Last confidence % Moderate confidence % Willing % Accountant 41 11.99 38 20.43 20 30.30 Physician 62 18.13 30 16.19 7 10.61 Nurse 48 14.06 40 21.51 11 16.67 Professor 65 19.01 27 14.512 7 10.61 Worker 56 16.37 26 13.98 17 25.76 Salesman 70 20.47 25 13.44 4 6.06 Sum 342 186 66
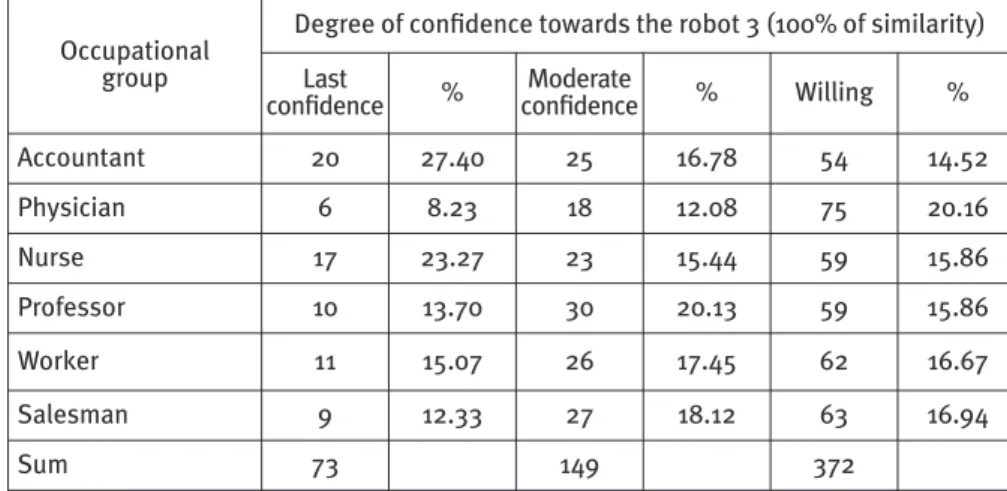
Figure 4 – Frequency distribution for a variable of a degree of confidence towards
the robot for individual groups of professions
The interpretation of the distribution of the evaluation of degree of confidence in a robot Figure 2 and Figures (tables) 3-4 illustrate the distribution of evaluations by professions and degree of similarity of a robot to humans. The detailed interpretation is as follows: - A robot of 0% degree of similarity to humans. In this case, the distribution of eval-uations indicates the lack of confidence in a robot. The sum of the evaleval-uations (least willing+moderate willing) vs. (most willing) given to occupational groups equals as follows: accountant: 73-26; physician: 82-17; nurse: 70-29; professor: 66-33; skilled worker: 77-22; salesman: 67-32. However, there is no clear withdrawal of respondents (except for the evaluation of the nursing profession). The presented indicators demonstrate reluctance to the robot; however, the ratio between rating -1 and rating 0 indicates that the level of acceptance of the robot depends on the individual char-acteristics of the respondent. Moreover, it shows that a significant quantitative group of people from the presented research sample exhibits a high degree of con-fidence 1 in a robot with a degree of similarity of 0%. Higher concon-fidence in the robot may be associated with greater acceptance of new technologies by the user. When evaluating the whole trial, one should tend to conclude that it is characterised by a certain degree of indecision. There is no clear trend in the evaluation of trust. - A robot of 50% degree of similarity to humans. In this case, the distribution of evaluations indicates a clear withdrawal of respondents. The appearance of a robot, in which both human and artificial features are visible, produces an unpleasant emotional response among the respondents. The increase in the distribution of evaluation -1 and 0 vs. 1 occurred in 4 professional groups: professor, qualified worker, salesman, physician. In the case of the occupational groups: accountant and nurse, the extenuation continued to be negative, but the difference between the degree of confidence -1 and 0 decreased. In the future, the interpretation con-cerning these two professions should be carried out on the basis of an in-depth interview, in order to identify the factors that have increased the level of acceptance of the robot in comparison to other occupational groups.
- A robot of 100% degree of similarity to humans. This data shows an apparent increase in the confidence of respondents. The appearance of a robot fully possessing
Occupational group
Degree of confidence towards the robot 3 (100% of similarity)
Last confidence % Moderate confidence % Willing % Accountant 20 27.40 25 16.78 54 14.52 Physician 6 8.23 18 12.08 75 20.16 Nurse 17 23.27 23 15.44 59 15.86 Professor 10 13.70 30 20.13 59 15.86 Worker 11 15.07 26 17.45 62 16.67 Salesman 9 12.33 27 18.12 63 16.94 Sum 73 149 372
human qualities (including imperfections: wrinkles, freckles and other skin lesions) is given by the respondents a high degree of confidence. In comparison to the two preceding robots, there was an increase in rating 1 and a decrease in rating -1, in the following professional groups respectively: accountant, physician, nurse, pro-fessor, skilled worker, salesman.
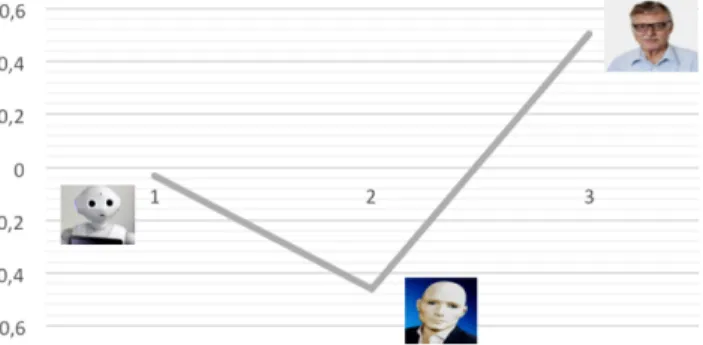
In order to confirm the phenomenon of the uncanny valley, in accordance with the evaluation and estimates of Karl F. MacDorman22, the means of all the user-designated evaluations have been calculated – the visualisation is shown in the article figures. The graph of mean robot evaluations is similar to the illustration depicting the uncanny valley, presented in the original paper by Mori and other replicating studies23(Figure 6). The location of the uncanny valley is the same as in the results of the Japanese research. The discomfort associated with changes in the robot’s appearance occurs near Figure 1b in Figure 5. Additionally, the indications of the characteristics responsible for the occurrence of the uncanny valley should be sought in an in-depth study, e.g. a questionnaire with a larger number of photographs, which would illustrate the slow changes in the appearance of the robot. An interesting means of obtaining reference material are digital characters from games and movies24. The increase of the illustration base should naturally result in an expansion of the scale of the evaluation of images of anthropomorphic robots. As shown in other studies25, the proposed changes in the study may contribute to increasing the phenomenon of the uncanny valley or its dis-appearance. This indicates serious limitations in the visual assessment of the data and necessitates a shift towards other ways of locating the uncanny valley – which remains an open question in literature.
Figure 5 – The mean of the evaluations for robots
22 Karl F. MacDorman, Subjective ratings of robot video clips for human likeness, familiarity, and eeriness:
an exploration of the uncanny valley. In: “ICCS 2006: 5th
International Conference of the Cognitive Science” (Vancouver, July 26, 2006). 2006, p. 48-51, <http://csjarchive.cogsci.rpi.edu/Proceedings/2006/iccs/p23.pdf>.
23 E.g. M. B. Mathur; D. B. Reichling, Navigating a social world with robot partners cit., passim. 24 See: Louis Laja Uggah; Azaini A. Manaf, Overcoming the uncanny valley theory in digital characters
based on human attitudes, «Pertanika journal of social sciences & humanities», 23 (2015), May, p.
13-22, <http://www.pertanika.upm.edu.my/Pertanika%20PAPERS/JSSH%20Vol.%2023%20(S)%20May.% 202015/02%20JSSH%20Vol%2023%20(S)%20May%202015_pg13-22.pdf>.
25 Cf. K. F. MacDorman, Subjective ratings of robot video clips for human likeness, familiarity, and
Figure 6 – Simplified version of Mori’s original graph regarding the uncanny valley26
Evaluation of the relationship between the level of confidence in a robot and the professional group For the analysed cases, a research problem was formulated in the form of an assessment of independence between the evaluation of the respondent’s trust and the appearance of the robot, according to professional groups:
- H0: confidence level variable and professional group are independent; - H1: confidence level variable and professional group are not independent.
Contingency tables are presented in the form of Figure (table) 7. Discrete variable ‘level of confidence in a robot’ assumes three states; discrete variable ‘professional group’ assumes six states. The expected quantity table does not contain values less than 5, Cochran’s condition has been met, hence the test was not corrected.
Figure 7 – Chi-square test statistic
Due to χ2α,v<χ2[0%] and χ2α,v<χ2[100%] with a given relevance level, the null hypoth-esis of variables independence should be rejected, for C[similarity level 0%]=0.18 and C[similarity level 100%]= 0.18 it must be concluded that the strength of dependence is
Degree of confidence towards the robot Chi-square test statistic
0% similarity 19.18
50% similarity 35.17
100% similarity 18.81
Degrees of freedom 10
Significance level 0.05
Critical value read from the tables 18.307
26 Source: Catrin Misselhorn, Empathy with inanimate objects and the uncanny valley, «Minds & machines»,
low. When χ2[50%]>χ2
α,vthe null hypothesis of variables independence was rejected,
for C=0.24 it must be concluded that the strength of dependence is low.
The relationship between the level of neutrality/invasiveness of their professional duties and our sympathy for them
For the analysed cases, a research problem was formulated in the form of an assessment of independence between the evaluation of the respondent’s trust and the appearance of the robot, by professional groups (in accordance with the additional classification: so-called invasive professions, service professions, knowledge professions): - H0: confidence level variable and professional group are independent; - H1: confidence level variable and professional group are not independent.
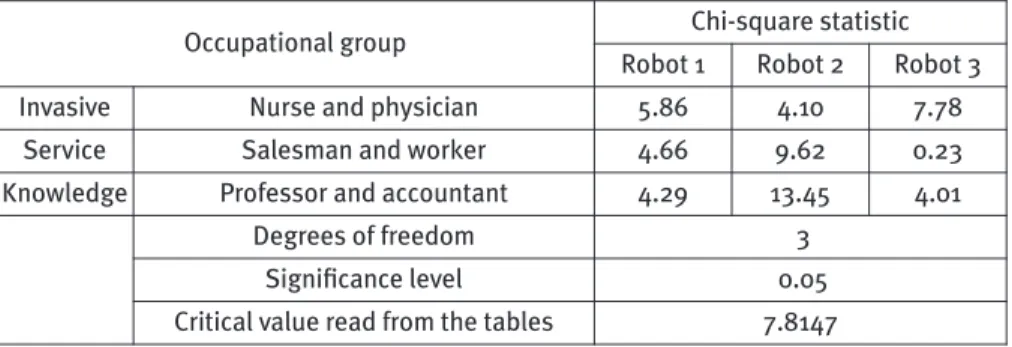
Figure 8 – Chi-square test statistic
In the case of occupational groups: service and so-called knowledge, in the evaluation of the robot 2, the null hypothesis of variables independence was rejected.
In remaining cases: χ2
α,v>χ2at a given level of significance, the verification decision
indicates that there are no grounds for rejecting the null hypothesis that the variables are independent.
The survey showed that – on a whole – the degree of confidence towards the robot cor-responds to the professional group. Furthermore, the survey also shows that the degree of confidence towards the robot does not depend on the degree of invasiveness/neutrality of the professional group. This dependence, in fact, was not confirmed by the chi-square test. The degree of confidence towards the robot, however, depends on the degree of invasiveness/neutrality of the professional group in the case in which we exclude the pro-fessional groups knowledge and service with a degree of similarity of 50%. This indicates which areas of the librarian’s work – the erudite of the digital age – would be more difficult to ‘hand over’ to machines equipped with artificial intelligence. That is why, long-life learning is needed in order to broaden tolerance and lower the level of anxiety over artificial intelligence. In the original work, Mori indicates that the robot’s purpose may affect the tol-erance limit of the robot’s appearance. As an example, the author mentions robots zused in industry – where functionality is more important than appearance – and compares them with, e.g. toy robots, which functionality is not as important as appearance. Industrial robots are characterised by the lowest degree of similarity to humans, the user does not develop feelings towards them, does not feel used to them27. In other words, the robot’s purpose can be considered as a factor determining
27 M. Mori; K. F. MacDorman; N. Kageki, The uncanny valley cit.
Occupational group Chi-square statistic
Robot 1 Robot 2 Robot 3
Invasive Nurse and physician 5.86 4.10 7.78
Service Salesman and worker 4.66 9.62 0.23
Knowledge Professor and accountant 4.29 13.45 4.01
Degrees of freedom 3
Significance level 0.05
the shape of the function that verifies the uncanny valley. It seems that based on such a reasoning of the author, the discussion should include a division into profes-sional groups. The fact that the proposed study rejects the hypothesis of independence for certain pairs leads to the conclusion that the division into professional groups is correct. The results, as well as the assumption of an additional factor influencing the shape of the function, are heading towards a study in which it is possible to gain an in-depth knowledge of the extent of the uncanny valley effect. A similar study was carried out a decade ago by a Japanese-Dutch research team28.
In addition, both Mori and later researchers29are inclined to state that the assigned evaluation is the result of the respondents’ own experiences. Thus, the uncanny valley effect with time should be characterised by variability. On the other hand, we employ cognitive errors that place our expectations within a stereotypical framework. According to the author’s knowledge, there is no extensive research that would verify the decline of the uncanny valley effect with time or with increasing experience, nor any research on shifting the boundary of tolerance towards the appearance of the robot, which could be measured by shifting the minimum function in relation to the x-axis. The variability can be affected by increasing the number of robots used in a given area (e.g. GLAM institutions, etc.).
Summary
The research carried out shows that there is a premise indicating the uncanny valley being a phenomenon that occurs among respondents representing the so-called digital generation. It is difficult to make generalisations on the basis of the adopted research sample and research area, but many other studies, conducted using different cognitive perspectives and methodologies, indicate that the phenomenon exists. In other words, it is likely to be assumed that a human-like robot influences human confidence. The greater the similarity, the greater the affection, up to a certain critical moment in which fear or anxiety arises. This, therefore, has implications for the exe-cution of the work for which the robots would be designed. The study showed that the degree of confidence towards a robot is related to the work it does, although there were no clear differences observed in the level of confidence towards robots performing different professions. Since the objective of the article was also to present the research procedure, it can be assumed that using a tool that allows to show data other than on the nominal scale, it would be easier to notice the relationship between the degree of invasiveness of a particular robot’s work. In future studies, more extensive scaling should be undertaken for the proposed values. At the same time, possible changes in professions with social prestige should be monitored, and the representation of professions corrected. In the quoted sociological studies, such changes are apparent over the years30. Moreover, the prestige of the professions varies depending on the ethnic group that hierarchises them.
28 Christoph Bartneck [et al.], Is the uncanny valley an uncanny cliff?. In: RO-MAN 2007: the 16thIEEE International Symposium on robot and human interactive communication (Jeju, South Korea, 26-29 August 2007). [Piscataway]: Institute of Electrical and Electronics Engineers, 2007, p. 368-373,
<https://ieeexplore.ieee.org/document/4415111>.
29 M. Mori; K. F. MacDorman; N. Kageki, The uncanny valley cit., passim; C. Bartneck [et al.], Is the
uncanny valley an uncanny cliff? cit.
30 E.g. H. Pollack, Doctors, military officers, firefighters, and scientists seen as among America’s most
In the future, the questionnaire survey should also include such elements as the credibility of the robot, the joy of interacting with it and the social presence of the robot31. However, given the robot’s competence, knowledge and skills and the fact that the essence of artificial intelligence – as Jerry Kaplan writes – «is the ability to make the right generalisations at the right time based on limited data»32, preparing the public to receive specialised, highly professional services is a task for the near future. This and further similar research should, therefore, help programmers, as well as those involved in broad social robotics education, in which the relationship between humans and robots will be explained. For example, these relationships can be seen as a particular type of intergroup conflict over limited resources, i.e. work33. Apart from the predictions related to the uncanny valley, an alternative hypothesis can also be formulated of the role of perceived similarity in intergroup relations, as a predictor explaining attitudes towards robots in a linear way. A similar effect could be expected on the basis of research on the so-called chameleon effect, where the ability to reflect a person’s emotions is assumed to be one of the mechanisms for building sympathy between individuals.
Related to the above-proposed research topics on social robotics, are changes in the librarian profession. To what extent will they be replaced by artificial intelligence? Which of the librarian’s activities could be fully automated, which ones with the assistance of a librarian, and in which ones will the man remain irreplaceable? The modern librarian – naturally, depending on the type of library – partially fulfils the function of the professions that were the subject of empirical research in this article. In libraries of various types (although mainly academic ones), by providing scientific information, they partly perform the educational and scientific functions of a scholar. In public libraries (which is slowly becoming a standard in Scandinavian countries) they help to settle customers’ taxes, support them administratively in running their businesses. For many years, the librarian has been carrying out quasi-therapeutic activities concerning not only bibliotherapy, but also art therapy, counselling, and for some time, they have been involved in health education and related basic medical diagnostics. Finally, the commercialisation of services and the always underinvested libraries have transformed libraries into small commercial outlets, and librarians into salespeople who have become budget managers for current needs. Green libraries, which have become increasingly popular for several years34, offer librarians the oppor-tunity to educate their local environment, through physical work in their own library workshops, gardens, etc., thus the 21stcentury librarian must be versatile. The erudition of librarians on the past has been replaced by the erudition on the future – a digital world that is hard for man to navigate. However, the librarian is not able to provide such a wide range of services that already are and will increasingly be available in
31 C. Bartneck [et al.], Measurement instruments for the anthropomorphism, animacy, likeability,
per-ceived intelligence, and perper-ceived safety of robots cit., p. 78.
32 Jerry Kaplan, Artificial intelligence: what everyone needs to know. Oxford: Oxford University Press,
2016, p. 21.
33 Joshua Conrad Jackson; Noah Castelo; Kurt Gray, Could a rising robot workforce make humans less
prejudiced?, «American psychologist», Advance online publication, January 2020, <https://
psycnet.apa.org/doiLanding?doi=10.1037%2Famp0000582>.
34 Małgorzata Fedorowicz-Kruszewska, Sustainable libraries - fashion or necessity?, «JLIS.it», 10 (2019), n. 1, p. 92-101, <https://www.jlis.it/article/view/12500/11355>.
libraries. Artificial intelligence must assist them. Fortunately, the uncanny valley is not an uncanny cliff. On the other hand, it causes natural (since determined by the functional structures of the brain) fears and anxieties. The author of this article is conducting intercultural research on this phenomenon, although his synthetic results in the context of the coronavirus epidemic cannot yet be determined. However, in future research carried out by various scientists, we will look more closely at these limitations of human nature.
REFERENCES
[1] Bartneck Christoph [et al.], Is the uncanny valley an uncanny cliff?. In: RO-MAN 2007: the 16thIEEE International Symposium on Robot and Human Interactive Communication (Jeju,
South Korea, 26-29 August 2007). [Piscataway]: Institute of Electrical and Electronics Engi-neers, 2007, p. 368-373, <https://ieeexplore.ieee.org/document/4415111>, DOI: 10.1109/ ROMAN.2007.4415111.
[2] Bartneck Christoph [et al.], Measurement instruments for the anthropomorphism, animacy, likeability, perceived intelligence, and perceived safety of robots, «International journal of social robotics», 1 (2009), n. 1, p. 71-81, <https://link.springer.com/article/10.1007/s12369-008-0001-3>, DOI: 10.1007/s12369-008-0001-3.
[3] Burleigh Tyler J.; Schoenherr Jordan R.; Lacroix Guy L., Does the uncanny valley exist? An empirical test of the relationship between eeriness and the human likeness of digitally created faces, «Computers in human behavior», 29 (2013), n. 3, p. 759-771, <https://www. sciencedirect.com/science/article/pii/S0747563212003263>, DOI: 10.1016/j.chb.2012.11.021.
[4] Cybulska Agnieszka, Komunikat z badań: BS/164/2013. Prestiż zawodów. Warszawa:
Centrum Badania Opinii Społecznej, 2013, <https://www.cbos.pl/SPISKOM.POL/ 2013/K_164_13.PDF>.
[5] Dolton Peter [et al.], Global teacher status: index for 2018. London: The Varkey Foundation,
2018, <https://www.varkeyfoundation.org/media/4853/gts-index-9-11-2018.pdf>.
[6] Fedorowicz-Kruszewska Małgorzata, Sustainable libraries: fashion or necessity?, «JLIS.it», 10
(2019), n. 1, p. 92-101, <https://www.jlis.it/article/view/12500/11355>, DOI: 10.4403/jlis.it-12500.
[7] Frey Carl Benedikt; Osborne Michael A., The future of employment: how susceptible are jobs to computerisation?. September 7, 2013, <https://www.oxfordmartin.ox.ac.uk/down-loads/academic/The_Future_of_Employment.pdf>.
[8] Generation Z. In: Wikipedia: the free encyclopedia. Version of April 9, 2020, 20:31 UTC,
<https://en.wikipedia.org/wiki/Generation_Z>.
[9] Iafrate Fernando, Artificial intelligence and big data: the birth of a new intelligence.
London: ISTE; Hoboken: John Wiley, 2018.
[10] Jackson Joshua Conrad; Castelo Noah; Gray Kurt, Could a rising robot workforce make humans less prejudiced?, «American psychologist», Advance online publication, January 2020, <https://psycnet.apa.org/doiLanding?doi=10.1037%2Famp0000582>, DOI: 10.1037/ amp0000582.
[11] Kaplan Jerry, Artificial intelligence: what everyone needs to know. Oxford: Oxford
University Press, 2016.
[12] Kruszewski Tomasz, Ocena zależności między wizerunkiem robota a zaufaniem do robota w świetle koncepcji doliny niesamowitości, na przykładzie zawodów o wysokim prestiżu
społecznym, «Zagadnienia informacji naukowej», 57 (2019), n. 2, p. 80-96, <http:// www.ojs.sbp.pl/index.php/zin/article/view/461>, DOI: 10.36702/zin.461.
[13] Id., Wizerunek bibliotekarzy w opiniach ich następców po dekadzie - raport z badań,
«Przegląd biblioteczny», 84 (2016), n. 4, p. 545-556, <http://ojs.sbp.pl/index.php/pb/ artic-le/view/488>, DOI: 10.36702/pb.488.
[14] Laja Uggah Louis; Manaf, Azaini A., Overcoming the uncanny valley theory in digital characters based on human attitudes, «Pertanika journal of social sciences & humanities», 23 (2015), May, p. 13-22, <http://www.pertanika.upm.edu.my/Pertanika%20PAPERS/ JSSH%20Vol.%2023%20(S) %20May.%202015/02%20JSSH%20Vol%2023%20(S)%20May% 202015_pg13-22.pdf>.
[15] MacDorman Karl F., Subjective ratings of robot video clips for human likeness, familiarity, and eeriness: an exploration of the uncanny valley. In: “ICCS 2006: 5th
International Conference of the Cognitive Science” (Vancouver, July 26, 2006). 2006, p. 48-51, <http:// csjarchive.cogsci.rpi.edu/Proceedings/2006/iccs/p23.pdf>.
[16] MacDorman Karl F.; Chattopadhyay Debaleena, Reducing consistency in human realism increases the uncanny valley effect: increasing category uncertainty does not, «Cognition», 146 (2016), p. 190-205, <https://www.sciencedirect.com/science/article/pii/S0010027715300755>, DOI: 10.1016/j.cognition.2015.09.019.
[17] Mathur Maya B.; Reichling David B., Navigating a social world with robot partners: a quantitative cartography of the uncanny valley, «Cognition», 146 (2016), p. 22-32, <https://www.sciencedirect.com/science/article/pii/S0010027715300640>, DOI: 10.1016/ j.cognition.2015.09.008.
[18] Misselhorn Catrin, Empathy with inanimate objects and the uncanny valley, «Minds &
machines», 19 (2009), n. 3, p. 345-359, <https://link.springer.com/article/10.1007/s11023-009-9158-2>, DOI: 10.1007/s11023-009-9158-2.
[19] Mori Masahiro; MacDorman Karl F.; Kageki Nori, The uncanny valley [from the field],
«IEEE robotics & automation magazine», 19 (2012), n. 2, p. 98-100, <https:// ieeexplore.ieee.org/stamp/stamp.jsp?tp=&arnumber=6213238>, DOI: 10.1109/MRA.2012.2192811.
[20] Morriello Rossana, Blockchain, intelligenza artificiale e internet delle cose in biblioteca,
«AIB studi», 59 (2019), n. 1-2, p. 45-68, <https://aibstudi.aib.it/article/view/11927/11449>, DOI: 10.2426/aibstudi-11927.
[21] Pasquinelli Elena, La valle del perturbante e la realtà virtuale, «Sistemi intelligenti», 18
(2006), n. 3, p. 445-470, <https://www.rivisteweb.it/doi/10.1422/23348>, DOI: 10.1422/23348.
[22] Pollack Hannah, Doctors, military officers, firefighters, and scientists seen as among America’s most prestigious occupations, «The Harris poll», n. 85, September 10, 2014, <https://theharrispoll.com/when-shown-a-list-of-occupations-and-asked-how-much-prestige- each-job-possesses-doctors-top-the-harris-polls-list-with-88-of-u-s-adults-considering-it-to-have-either-a-great-deal-of-prestige-45-2>.
[23] Ratajczyk Dawid; Jukiewicz Marcin; Lupkowski Paweł, Evaluation of the uncanny valley hypothesis based on declared emotional response and psychophysiological reaction, «Bio-algorithms and med-systems», 15 (2019), n. 2, p. 1-10, <https://www.degruyter.com/view/ journals/bams/15/2/article-20190008.xml>, DOI: 10.1515/bams-2019-0008.
[24] Rosenthal-von der Pütten Astrid M. [et al.], Neural mechanisms for accepting and rejecting artificial social partners in the uncanny valley, «The journal of neuroscience», 39 (2019), n. 33, p. 6555-6570, <https://www.jneurosci.org/content/39/33/6555>, DOI: 10.1523/JNEU-ROSCI.2956-18.2019.
[25] Siau Keng; Wang Weiyu, Building trust in artificial intelligence, machine learning, and robotics, «Cutter business technology journal», 31 (2018), n. 2, p. 47-53, <https:// www.cutter.com/article/building-trust-artificial-intelligence-machine-learning-and-robotics-498981>.
[26] Sobczyk Mieczysław, Statystyka. Warszawa: PWN, 2011.
[27] Tavosanis Mirko L. A., Libraries, linguistics and artificial intelligence: J. C. R. Licklider and the libraries of the future, «JLIS.it», 8 (2017), n. 3, p. 137-147, <https://www.jlis.it/article/ view/12271/11283>, DOI: 10.4403/jlis.it-12271.
[28] Wójcik Magdalena, Rozszerzona rzeczywistość w usługach informacyjnych bibliotek.
Kraków: Wydawnictwo Uniwersytetu Jagiellońskiego, 2018.
[29] Ead., Sztuczna inteligencja - potencjał dla procesów zarządzania informacją, «Przegląd
biblioteczny», 86 (2018), n. 1, p. 5-15, <http://ojs.sbp.pl/index.php/pb/article/view/563>, DOI: 10.36702/pb.563.
[30] Yamada Yuki; Kawabe Takahiro; Ihaya Keiko, Categorization difficulty is associated with negative evaluation in the “uncanny valley” phenomenon, «Japanese psychological research», 55 (2013), n. 1, p. 20-32, <https://onlinelibrary.wiley.com/doi/full/10.1111/j.1468-5884. 2012.00538.x>, DOI: 10.1111/j.1468-5884.2012.00538.x.
Ai fini della citazione, utilizzare esclusivamente il testo in lingua italiana, che presenta il DOI, la paginazione, l'abstract e gli altri dati ufficiali.
When citing, please always refer to the Italian translation only, complete with DOI, page numbers, abstract and other data.
[Tomasz Kruszewski, I robot di servizio antropomorfi influenzano il nostro senso di sicurezza? Ai margini della riflessione sul futuro del mercato del lavoro nella LIS.