The Economy as a whole: three essays on
Economic Networks
Ph.D. Candidate:
Raffaele Giammetti
Supervisor:
Ph.D. Coordinator:
Prof. Mauro Gallegati Prof. Riccardo Lucchetti
Prof. Alberto Russo
UNIVERSITÀ POLITECNICA DELLE MARCHE
FACOLTÀ DI ECONOMIA “GIORGIO FUÀ”
_______________________________________________________________
Ph.D. in Economics
Acknowledgments
This Ph.D. thesis has been made possible thanks to the direct and indirect contribution of many people and institutions. First and foremost, a special thanks goes to Mauro Gallegati and Alberto Russo for their excellent research assistance and support in developing the present project. It has been an honour to work with them during these last three years. Actually, they represent the reason why I applied to the Ph.D. programme in Ancona, and well, after working with them I can say that they did not disappoint my expectations. I really appreciate all their comments, suggestions and guidance.
During the spring term of my Ph.D. second year, I had the opportunity to work at the IMT School for Advanced Studies (Lucca - Italy) hosted by Guido Caldarelli and his Networks group. I would thank all the group members for their great research assistance.
During the fall and spring terms of my Ph.D. third year, I was hosted by Sheri Markose at the University of Essex (Colchester - UK). Under her supervision, I quickly acquired a good knowledge of Input-Output techniques which helped me accomplish the second chapter. The guidance, advice, and suggestions provided by Sheri Markose was crucial for pushing this project forward. Furthermore, the period spent at Essex gave me the possibility to interact with many professors and Ph.D. students in a stimulating intellectual environment. In this regard, a special thanks to Katie Chapman and Inacio Manjama.
Many sincere thanks go also to Erik Dietzenbacher, Nadia Garbellini, Milena Lo Preite, Bart Los, Michelangelo Puliga and Ariel Wirkierman for their priceless comments and suggestions.
I express my best gratitude to Emiliano Brancaccio. If I had not attended his fantastic course in macroeconomics, during my first year of Bachelor's degree, I would never have continued my studies in economics.
Bettin, Marco Cucculelli, Roberto Esposti, Marco Gallegati, Federico Giri, Alessia Lo Turco, Riccardo “Jack” Lucchetti, Nicola Matteucci, Antonio Palestrini, Giulio Palomba, Luca Papi, Matteo Picchio, Claudia Pigini, Maria Cristina Recchioni, Raffaella Santolini, Stefano Staffolani, Alessandro Sterlacchini, Massimo Tamberi, and Davide Ticchi for their time, interest, and helpful comments.
I am also extremely grateful to Andreina Barontini, Graziano Fronzoni, and Giuseppe “Pino” Gramazio for their administrative assistantship.
I would also like to thank all of my Ph.D. classmates: Thomas Carraro, Emanuele Ciola, Andrea Coveri, Luca Pedini, Sabrina Severini and Visar Vokrri, for their precious help and support at the beginning of the Ph.D. programme.
Finally, yet most importantly, I would like to thank my family for their love and support during these years of Ph.D. studies. My parents, who raised me with love for science, books, and readings and supported me in all my goals. And most of all, I would like to thank my loving, supportive, encouraging, and patient wife Simona, that is always by my side in everything I do. This result would have never been achieved without her. I am sure to have missed people that deserve to be remembered here, people to whom I extend my sincerest apologies.
Contents
Introduction 3
1 Centralization of capital and financial crisis: a global network analysis
1.1 Introduction 6
1.2 A marxian definition of “centralization”: ownership and control of share capital
7 1.3 Capital centralization in terms of ownership and control networks: a
short review 9 1.4 Methodology 11 1.5 Data 13 1.6 Results 15 1.7 Conclusion 22
2 Tariffs, Domestic Import Substitution and Trade Diversion in Input-Output Production Networks: how to deal with Brexit
2.1 Introduction 24
2.2 The Economic Impact of Brext: Literature Review 25
2.2.1 Gravity Models in Brexit Impact Studies 26
2.2.2 CGE and NQTMs in Brexit Impact Studies 26
2.2.3 Econometric Models in Brexit Impact Studies 28
2.2.4 Global Value Chains and Brexit 29
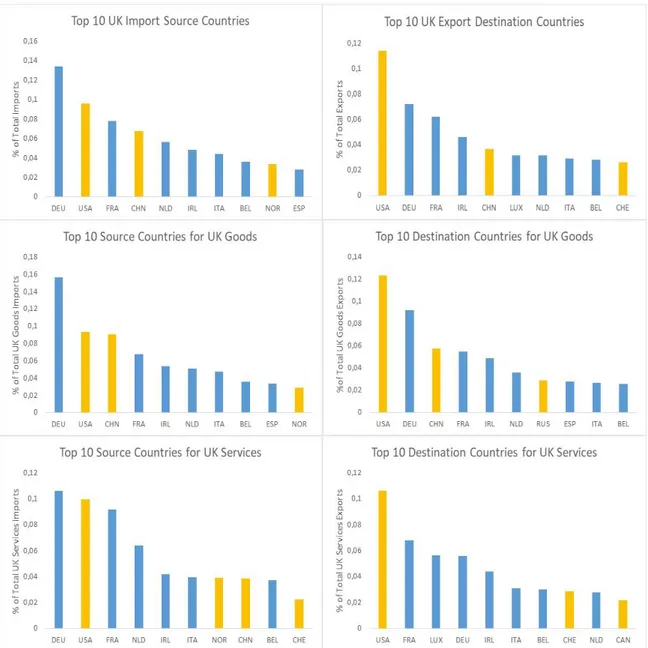
2.3 The UK Bilateral Trade Relations 29
2.4 Static Analysis of UK Trade 33
2.5 An Inter-Country-Input-Output Analysis of Brexit: Model and Methodology
36
2.5.1 The Model 36
2.5.1.1 A Two Country Input-Output Example 36
2.5.1.2 The N Country, K Sector Model 38
2.5.1.3 The Partial Extraction Method in the Case of a Trade Shock 39 2.5.1.4 Hypothetical Expansion in the Case of Domestic Import
Substitution and Trade Diversion
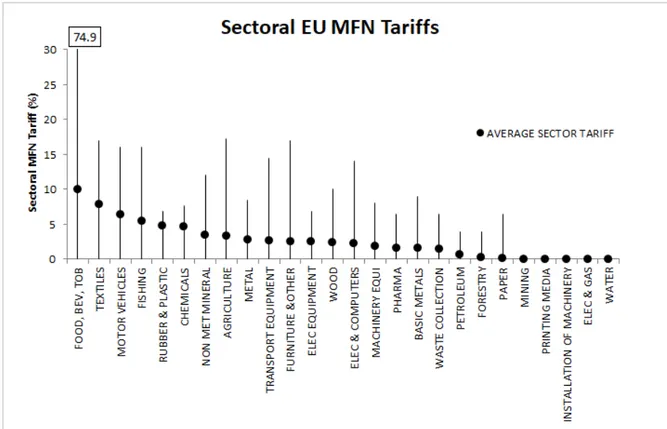
42 2.5.2 Methodology 45 2.5.2.1 Data 45 2.5.2.2 Counterfactual Scenarios 45 2.5.2.3 Tariffs 46 2.5.2.4 Non-Tariff Barriers 47 2.5.2.5 Elasticity 47 2.6 Results 47
2.6.1 Trade Shock Model Results 48
2.6.2 Domestic Import Substitution-Trade Diversion Model Results 50
2.7 Discussion 52
3 Key sectors in Input-Output Production Networks: an application to Brexit
3.1 Introduction 55
3.2 Propagation of Shocks and Key Sectors in Input-Output Networks: a short Literature Review
56
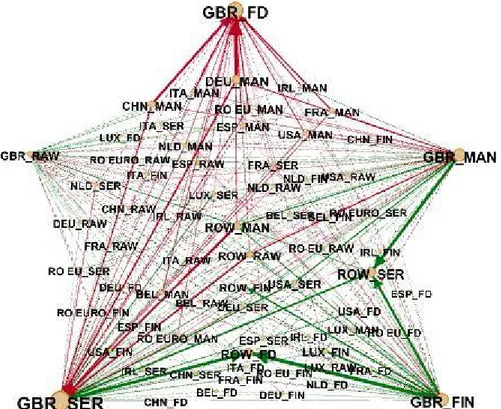
3.3 The European Production Network 58
3.3.1 Mapping inter-industrial connections to data 58
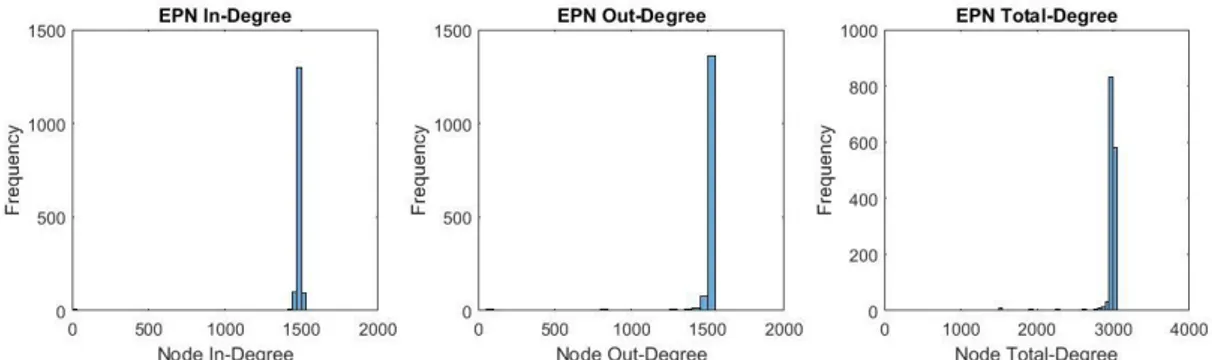
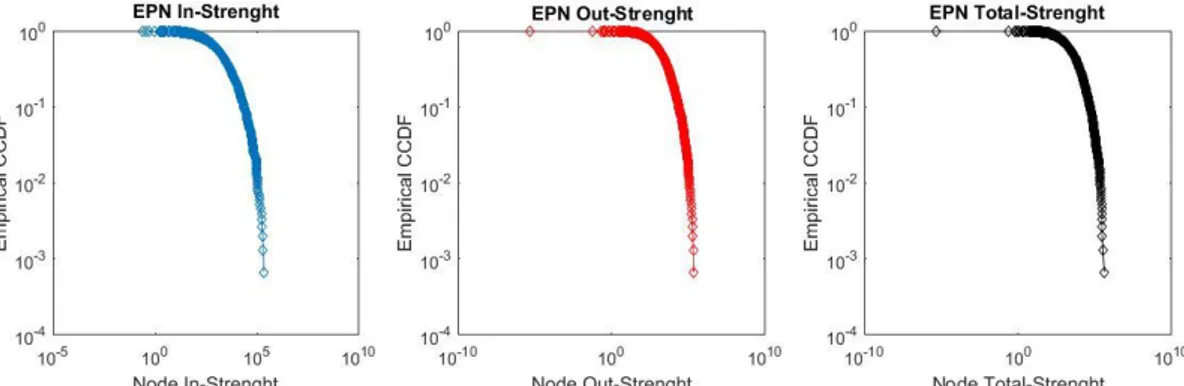
3.3.2 The Structure of the EPN 59
3.3.3 Central Nodes in the EPN 62
3.4 The Hypothetically Extraction method to unveil Key Industries from a Brexit perspective
65
3.4.1 Methodology 67
3.5 Results and Discussion 68
3.5.1 The exposure to sectoral hypothetical extractions due to Brexit 68
3.5.2 Brexit strategic sectors 71
3.6 Conclusion 73 Conclusions 75 Appendices Appendix 1 77 Appendix 2 79 Bibliography 93
Introduction
The modern capitalist world economy is a globalised intricately linked network in which agents interact and make decisions simultaneously determining dynamics and emergent properties (Delli Gatti et al., 2008). Traditional macroeconomic models do not provide such granular and holistic frameworks to analyse economic systems. This remark has become even clearer when the economic crisis has definitively revealed the limits of current mainstream economic models, not only in predicting the advent of large crises but also in contemplating such an eventuality (Gallegati, 2018). With the aim of solving the limitations of standard macroeconomic models, economists have been increasingly attracted to the field of complex systems, especially in the aftermath of the 2007 crisis. As a result, a fruitful literature applying analytical tools typical of ‘complex adaptive systems’ to economics, has been developed (Arthur, 2000; Rosser, 2003; Markose, 2005; Gallegati et al., 2006; Delli Gatti et al., 2010b; Sornette, 2017). In particular, two main research strands emerged from this literature, namely the interacting agent-based-models (ABMs) and the network analysis. ABMs represent the analytical and computational tools necessary to explore the properties of a complex economy (Delli Gatti et al., 2011). They are models in which a multitude of heterogeneous, adaptive economic agents interacts with each other and with the environment, following autonomous behavioural rules (Delli Gatti et al., 2018). The outcome of these interactions concurs in shaping the emergent properties of the system (Delli Gatti et al., 2008), which can be numerically computed (Caiani et al., 2016). The ABMs, though still in their growth phase, have already found widespread application in both the economic literature (see among others Farmer and Foley, 2009; Cincotti et al., 2010; Delli Gatti et al., 2010a; Dosi et al., 2010; Harras and Sornette, 2011; Ashraf et al., 2016; Russo et al., 2016; Dawid et al., 2018) and relevant institutions such as the Bank of England (Baptista et al., 2016; Haldane, 2016; Turrell, 2016; Haldane and Turrell, 2018).
The second research strand developed within the field of complex systems regards the network analysis. Economic network analysis applies models from network science (Caldarelli, 2007) to the analysis and interpretation of economic phenomena (Jackson, 2008; Schweitzer et al., 2009). Economic networks are webs where nodes represent economic agents (individuals, firms, consumers, organizations, industries, countries, etc.) and links depict market interactions. The development of this emerging research field can be seen as a response to the rise of networked organizations over the past few decades, given the proliferation of information technology and globalisation. In this sense, Castells (2005) has identified networks as the emerging fundamental organizational structure within post-industrial economies. The present work integrates the literature relating to this second line of investigation, though, as stressed in the conclusions, leaves the door open to future research aiming to model the networks analysed in this study, applying the typical tools of ABMs (on the interplay between ABMs and networks see Gualdi and Mandel, 2018; Otto et al., 2017; Bargigli and Tedeschi, 2014).
This study consists of three empirical investigation on global financial and production networks. In the first chapter, we compute the historical evolution of the global ownership network investigating the concentration, at a global level, of ownership capital over the years 2001-2016. The originality of the research lies in the fact that (1) is the first attempt to analyse the historical evolution of the global ownership network, (2) is the first investigation on the historical trend of concentration of ownership capital as a whole, (3) is the first study on the impact of the financial crisis on ownership structures
Using network analysis techniques and applying them to the examination of the Thomson Reuters Eikon database, we first build the global ownership network, which includes on averages more than 30 thousand nodes and almost 830 thousand links. Second, following Vitali et al. (2011) we developed a network measure of direct and indirect corporate control, namely the net-control. By computing the net-control, we are able to verify how much economic value of companies a shareholder is able to control. In other words, we compute for each year considered, the degree of capital control centralisation within the network, i.e. we measure to what extent the control of share capital is concentred in a few nodes. In adopting this measure, we noted that the network control is highly concentrated in the world: the fraction of top holders holding cumulatively the 80% of the global economic value of the firms considered in the sample is always under the fraction of 2%. Furthermore, by inspecting the temporal dynamics of the phenomenon we observe an increase in the global centralization of capital: this trend appears to be partially dependent on the threshold chosen until 2006 whereas it assumes a more regular and general character from the financial crisis of 2007 until 2016, with an increase of more than 20% for all the samples considered. Finally, by inspecting the core of the global ownership network, containing the larger nodes for total net-control, we find that this is mainly composed of the same financial companies before and even after the 2007 financial crisis.
The second chapter challenges and complements existing papers on the economic impact of Brexit providing a detailed and holistic discussion of the UK's decision to leave the EU and how it will affect international trade networks and value-added, globally, and exploring if there are options available to policy-makers so that Brexit does not result in huge economic losses.
First, using the recently constructed World Input-Output Database (WIOD), we develop a multi-sector inter-country model that allows us to identify all the channels through which the economic effects of Brexit would propagate within and among sectors and countries. In particular, applying the input-output 'partial extraction' method (Dietzenbacher and Lahr, 2013) to the European input-output production network, we are able to include direct and indirect trade via GVCs and, hence, provide estimates of the direct and indirect impact of Brexit at the industry level. The inclusion of GVCs and indirect Brexit effects in our model leads to estimates that diverge with the results of the main literature. Indeed our findings, comparable with other studies that include indirect Brexit effects such as Vandenbussche et al. (2017) and W. Chen et al. (2018), suggest that Brexit could be risky and costly not only for the UK but also for EU countries, especially Ireland, Germany, Belgium, and the Netherlands, with Ireland facing losses similar or even greater than those of the UK.
Second, we move away from the traditional assumption underlying standard trade models, according to which trade liberalisation always increases welfare and we address the question, are there any economic policies that would mitigate or even reverse the negative Brexit effects? To address the question, we modify the first model by introducing the hypothesis that trade barriers would not necessarily mean negative economic shocks. Building on Rodrik (2018a, 2018b, 2018c) recent remarks, according to which under circumstances of weak domestic growth and growing trade deficit, trade protectionism would be preferable to unconditional free trade, we interpret Brexit as a special case in which a country implements a protectionist trade policy in order to rebalance the external accounts and boost domestic growth. Practically, we allow sectors and countries to partly substitute foreign products which are rendered less competitive due to tariffs, adopting domestic import substitution and trade diversion policies. Namely, we assume that in response to Brexit, (1) UK trade will be partly diverted to extra-EU countries, (2) EU imported products will be partly substituted by domestic purchases, (3) EU countries will partly substitute UK imported products by intra-EU purchases. The inclusion of these changes in the model results in absolute and relative losses for the UK and EU27 significantly lower.
The originality of the study conducted in chapter 2, lies in the trade models we developed, which allow verifying how the economic impact of tariffs would propagate within an input-output production network, and how domestic import substitution and trade diversion policies could affect domestic and global value added. Furthermore, the models enrich both the literature on multi-country-input-output models and the literature on the propagation of shocks in production networks.
In the third chapter, as in the previous one, we analyse Brexit but from a different perspective, combining the input-output key sectors literature with the typical network centrality measures. According to the second chapter and the main literature, Brexit would have a negative impact at a global level. Therefore, it is of a foremost relevance that a debate on the priority and choice of industries that policy-makers should safeguard emerges. In this sense, the third chapter includes the first study of the European production network (EPN) topology, and provides different rankings of the most 'systemically important' sectors involved in Brexit, according to different measures deriving from both input-output and network analysis literature. Furthermore, we develop a measure of country and sectors exposure to sectoral tariff and non-tariff barriers. We apply the 'hypothetical extraction' method (Dietezenbacher and Lahr, 2013; Los et al., 2016; W. Chen et al., 2018), a well-known input-output technique, to identify those sectors for which a reduction in trade flows implies a higher loss for the economies involved. On closer inspection, our indicator provide answers to questions like, to what extent the UK (EU) GDP depends on the export of sector 𝑖 to EU (UK), or conversely, to what extent the UK (EU) GDP depends on the import from the 𝑖𝑡ℎ EU (UK) sector? In this sense, the measure we develop allows identifying key import sectors and key export sectors.
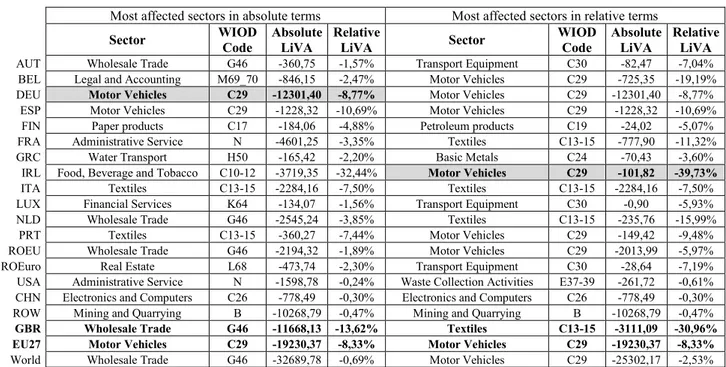
The main implication of our findings, in line with the second chapter results, is that Brexit would be not just a problem for the UK, as it is often portrayed, but any form of Brexit could propagate within the EPN and affect businesses and governments in the EU and globally. Further, our results about the exposure to trade barriers could strengthen the position of the UK in the negotiation of a Brexit deal with EU. Indeed, we find that the UK would be less exposed than EU countries to trade barriers, as the most vulnerable UK sectors are services industries whose products can only be subject to non-tariff barriers, whereas the most exposed EU industries are goods sectors, mainly manufacturing, which can be subject to both tariff and non-tariff barriers. Clearly, this holds if EU does not impose huge non-tariff barriers. For example, the picture would change in the extreme case in which EU forbids the UK from selling financial products to EU countries.
Considering the fact that new trade wars are on the horizon at a global level, for example between the US and China, the methodologies presented in our second and third chapters could stimulate other research, in order to develop useful tools to guide governments and institutions in implementing trade and economic policies.
Chapter 1
Centralization of capital and financial crisis:
a global network analysis of corporate control
1.1 Introduction
According to an old authoritative opinion, the tendency towards the centralization of capital should have been considered among the most important Marx’s laws of motion of capitalism and, as such, deserving of appropriate theoretical and empirical investigations with the most advanced techniques of economic analysis (Leontief 1938). Capital centralization in the sense of Marx, in fact, has never been a very popular subject in the academic literature. Unlike the well-known and debated thesis of the tendency of the rate of profit to fall, the idea of a progressive centralization of the capital control in just few hands has not been extensively studied. Nowadays, the citations of the centralization phenomena are scarce and sometimes even misleading. Furthermore, we see no academic studies dedicated to possible empirical links between capital centralization and economic crisis. As a consequence, the existence or not of a global tendency of capital to centralize in a few hands, and the related complex structural economic dynamics that may imply, remain an unresolved mystery.
Among the possible reasons of these gaps in the literature, there is not only the multifaceted nature of the Marxian centralization concept but also the lack of adequate datasets for the study of the phenomenon at an international level. The present work suggests a way to try to overcome these difficulties. Using network analysis techniques and applying them to the examination of the Thomson Reuters Eikon database, in the following pages we will adopt a specific definition of centralization of capital based on the concept of network control and we will study its global trend between 2001 and 2016, with particular regard to the phases preceding and following the international financial crisis that began in 2007. Although preliminarily, we will achieve a first empirical survey on the existence or not of a global tendency towards centralization of capital during the beginning of the 21st
century, and of possible relations between this trend and the phenomenon of the crisis.
The work is organized as follows. In section 2 we present the Marxian concept of centralization of capital in terms of concentration of ownership and control of share capital. In section 3 we review some research from which we can deduce empirical measurements that are somehow referable to the aforementioned definition of centralization. In particular, we will focus on a measurement in terms of network control suggested by Vitali et. Al (2011): we will point out that this measure has so far been adopted in studies limited to single periods, and we will specify that our aim is to extend it to a global analysis relating to the first sixteen years of the XXI century, before and after the financial crisis started in 2007. In section 4 we examine the methodology of our study and in section 5 we describe the data used. The sixth section presents the results of the empirical analysis. The seventh section concludes.
1.2 A marxian definition of “centralization”: ownership and control of share capital
The law of tendency toward centralization of capital is analyzed in various sections of Marx's Capital (Marx, 1867|1976|1981, Vol. I, Ch. 25, 32; Vol. III, Ch. 27). The concept was taken up and stressed by some of the leading exponents of Marxism, including Hilferding (1910), Lenin (1917|2000), Sweezy (1942) and Baran and Sweezy (1966) and later was further analyzed by other authors, both Marxists (Mandel 1975; Sau, 1979; Weeks, 1979; Shaik 1991; Desai, 2002; Bellofiore, 2014) and exponents of different schools of thought (Schumpeter 1942; Elliott, 1980). Rarely is it possible to find in the literature studies dedicated to the application of the concept of centralization to the theory of economic policy, as well as there are few theoretical and empirical researches that look close at the link between capital centralization and economic crisis (for some recent exceptions on these subjects, see Brancaccio and Fontana 2016; Brancaccio, Costantini and Lucarelli 2015).
The Marxian definition of centralization has many facets. It may concerns: dimensional economies and labor productivity, market structures and markets monopolization, the development of the credit system and, lastly, the processes of concentration in a few hands of ownership and control of share capital. Moreover, centralization is conceived by Marx as the premise for a form of transition from one mode of production to another. However, in the present study we will not investigate the issue of the transition of the mode of production and we will focus solely on centralization intended as concentration of ownership and control of capital, with particular reference to share capital. As we shall see, this latter definition is crucial in Marxian analysis and fits itself well to quantitative investigation. We leave to future analyses the study of the other declinations of the concept.
According to Marx, although competition in the capitalist mode of production sets in motion a centrifugal force that leads to a “fragmentation of the total social capital into many individual capitals, or the repulsion of its fractions from each other”, it is also possible to detect a centripetal opposed tendency to the attraction among individual “capitals already formed”. This tendency, which Marx calls “centralization of capital”, consists in “concentration of capitals already formed, destruction of their individual independence, expropriation of capitalist by capitalist, transformation of many small into few large capitals”. Therefore, the centralization of capital is a struggle that ends in the ruin of many small capitalists whose capitals partly pass into the hands of their conquerors, partly vanish. Some individual capitals become bigger by swallowing up weaker ones, and some others simply perish. This process may materialize in many ways: through bankruptcy of weak capitals and their market exit; through liquidation, merger or acquisition; through changes in the ownership and control structures of capital. In Marx’s view, then, centralization implies “a change in the distribution of already available and already functioning capital”. The consequence is an “alteration in the quantitative grouping of the component parts of social capital” (Marx 1867|1976, Vol. I., p. 777-779).
The process of centralization, thus defined, does not simply concern the mere concentration of ownership in a few hands but manifests itself more generally with the concentration of control of capital, which can go beyond the limits of the ownership relationships. According to Marx, private ownership becomes a limit to the development of capital itself, which, hence, tends to get around it and to go beyond it to favor a centralized control of reproduction and accumulation processes. Among the ways of circumventing the ownership constraint, Marx gives particular relevance to the formation
gobbled up by the sharks, and sheep by the stock-exchange wolves” (Marx, 1867|1981, Vol. III, p. 571). In this passage, it should be stressed that Marx does not simply refer to exchanges that determine a concentration in a few hands of the ownership shares but he also refers to the possibility that the dominant capitalist groups govern a larger mass of capital than the one they formally own. This mechanism represents a crucial aspect in overcoming the immanent limit of ownership in capitalist production: “The world would still be without railways if it had had to wait until accumulation had got a few individual capitals far enough to be adequate for the construction of a railway. Centralization, however, accomplished this in the twinkling of an eye, by means of joint-stock companies” (Marx, 1867|1976, Vol. I, p. 780). Thus, ownership fragmentation within stock companies acts as a lever for centralization as allows “the expropriation by a few” by means of concentration of capital control and in this way, according to Marx, it also promotes the process of accumulation. Centralization, therefore, gives rise to a concentration of control of capital beyond the limit of a mere ownership relationship.
We can therefore state that one of the main manifestations of the tendency towards capitalist centralization consists, for Marx, in the concentration of ownership and above all the control of share capital in the hands of a few subjects. By means of more or less visible threads, alliances, share-ownership and other links, holders of mere relative majority packages are able to govern decisions on the whole capital (on this point see also Sweezy, 1953 and Pitelis, 1980). The network of control can also extend from the parent company to the subsidiaries, located not only within the national territory but also abroad. This last aspect is crucial in Marx’s analysis of centralization: “Capital grows to a huge mass in a single hand in one place, because it has been lost by many in another place” (Marx 1867|1976, vol. I, p. 777), namely, beyond the mere corporate or national boundaries. In Marx’s vision, the centralization of capital thus spreads in a pervasive way, on an inter-company and international level.
As regards the possible nexus between centralization of capital and economic crisis, Marx repeatedly stresses this relationship. For example, when interprets the crisis in terms of falling profit rates, Marx argues that this latter phenomenon is at the same time a threat to the development of the capitalist production process and a lever of the centralization of capital (Marx, 1867|1981, Vol. III, p. 349). Nevertheless, the Marxian literature dedicated to the study of capitalist dynamics has often focused on the analysis of the rate of profit, almost always neglecting the process of centralization of capital (see, among many others, Shaikh, 1992; Mandel, 1980). Another key point in the link between crisis and centralization of capital is the credit system. According to Marx, together with the development of stock exchange the credit system accelerates the tendency towards centralization, favors the divorce between ownership and control of capital and along this path accentuates instability and overproduction (Marx, 1867|1981, Vol. III, p. 572). The role of credit and stock exchange in the process of centralization of capital are also stressed by Hilferding (1910), who considers them as crucial factors in the emergence of monopoly capitalism and finance capital. Notably, Hilferding asserts that centralization leads to the constitution of financial conglomerates whose control is associated with the ability of finance capital in borrowing and lending money from and to other capitals (see also Toporowsky, 2005). Unlike Marx, however, Hilferding believes that centralization of capital in a few hands reduces the erratic market movements caused by speculation and thus contributes to reducing the likelihood of a crisis. No trace in Marx can be found of this optimistic thesis, which Schumpeter considered as a clear abjuration of the collapse theory (Brancaccio and Cavallaro 2011).
1.3 Capital centralization in terms of ownership and control networks: a short review
The definition of centralization we investigate in this study is related to the tendency of the ownership and shareholders’ control to go in a few hands, according to a process which overcomes the boundaries of individual companies and nations. We need then to search if in the empirical literature there are works that verify this general tendency towards centralization.
To the best of our knowledge, most studies look at the ownership and control structures within corporations (Berle and Means, 1932; La Porta et al., 1998, 1999; Zingales, 1994, 1995; see Shleifer and Vishny, 1997; Becht et al., 2001 and Denis and McConnell, 2003 for a survey). Instead, on the basis of Marx’s definition, we intend to investigate centralization in terms of ownership and control not only within but also across corporations. To this end, several authors follow a “portfolio view” of a company’s direct investment to compute direct and indirect ownership. Among these, using a matrix representation of the ownership quotas based on a Leontief-type input-output model, Brioschi et al. (1989) provide one of the first analyses on the direct and indirect links between shareholders and corporates. Notably, the study introduces the notions of group value and integrated ownership. The integrated ownership represents the sum of all direct and indirect ownership shares a shareholder has in the equity capital of a firm. Instead, the group value is the value of a firm within a business group, and depends on the intrinsic value of the firm plus the direct and indirect shares the firm has in the neighboring firms’ value. According to the authors, once a shareholder has a direct ownership on a company it has access to cash flow or equity return, while the integrated ownership gives access also to voting rights in the company’s board. This approach has been extended (see Ellerman, 1991 and Baldone et al., 1997) and used in several case studies in Japan (Flath, 1992; Hoshi and Ito, 1991), continental Europe (Chapelle, 2004, Chapelle and Szafarz,2005), and South America (Gutiérrez and Pombo, 2007; Gutiérrez et al., 2008) where business group structures are more complex than those in the United States and the United Kingdom due to the existence of cross-share holdings, rings, pyramidal cascades, interlocks with financial institutions and high concentration levels of voting rights or direct ownership stakes.
Recently, inspired by the literature on complexity economics (Delli Gatti et al., 2007; Markose, 2005), a new field of investigation has been developed in standard corporate governance literature: it draws from the input-output approach and applies network analysis to ownership and control structures (on the use of network analysis in economics see also Jackson, 2008; Schweitzer et al., 2009 and Caldarelli, 2007). Foster (2005) explains why it is necessary to approach economic analysis from a network perspective and suggests to replace prevailing “simplistic” theories based in constrained optimization with “simple” theories derived from network representations. Likewise, Delli Gatti et al. (2009, 2010), Riccetti et al. (2013) and Bargigli et al. (2016) develop a network economy in which the relationships among agents are endogenously determined and evolving. Specifically, Mizruchi (2007) and Buzgalin and Kolganov (2015) argues the relevance of the network analysis for the study of corporate power structures in the specific perspective of the classical economists and Marx. Indeed, according to Santos (2015) network analysis is a suitable way to visualize and analyze the ownership and control links in the corporate sector. Thus, in the last few years, several authors have been focused on developing novel researches based on the ownership
unveil financial contagions and cascades of failures among organizations linked through an ownership network. On the empirical side, Rotundo and D’Arcangelis (2010) make use of a network representation in order to perform an analysis of the ownership structure of the companies listed in the Italian stock market in 2008. They develop an interesting method that reveals the final owner, and they add further knowledge to the mere analyses of the network structure examining the economic and financial relevance of companies in terms of integrated ownership and control. Pecora and Spelta (2015) analyze the network of the Euro Area banking sector in the year 2012 to assess the importance of a bank in the financial system with respect to ownership and control of other credit institutions. They focus especially to the weights of the network edges which represent shareholders relations and reflect how ownership is distributed among banks. The network ownership structure displays that control is highly concentrated in the hands of few important shareholders. Burlon (2015) employs a huge dataset of Italian firms over the period 2005-2013 and build a model where firms are connected through ownership relation in order to investigate how aggregate volatility is influenced by different ownership network structures. Among the results of the analysis, there is also evidence of a marginal increase in the concentration of ownership over time. In an IMF working paper, Santos (2015) assesses integrated ownership and control links in the corporate sector of the Gulf Cooperation Council (GCC) countries by applying input-output theory and different definitions of control on the distribution of consolidated debt. Using different ownership thresholds he identifies connected counterparties— involving entities under the direct and indirect control of shareholders—and their consolidated debt. He finds that corporate ownership is strongly concentrated in the GCC countries. Notably, public sector institutions are at the center of GCC corporate ownership networks, but holding companies, financial institutions, and family groups are also important.
Although the quoted studies are able to unveil complex ownership and control patterns across corporations, they analyze only single sectors or countries and then offer a limited view of the phenomenon with respect to the Marxian concept of capital centralization. For a more general study of the underlying phenomena, we need to investigate the architecture of the shareholders control from a global and intersectoral perspective. For this purpose, we can take advantage of a recent branch of studies dedicated to ownership and control networks. This field of research seems to provide a fruitful method of analysis (see Kogut and Walker, 2001; Garlaschelli et al., 2005; Corrado and Zollo, 2006; Glattfelder and Battiston, 2009; Battiston et al., 2010; Heemskerk and Takes, 2016).
Particularly relevant in this field is the work of Vitali et al. (2011), who examine the ORBIS database in order to provide an investigation of ownership concentration and control among 43060 trans-national corporations (TNC). The authors explore the hypothesis of indirect control taking into account two measures of network centrality, the network control and the network value, also called net-control and net-value. The network control is defined by the authors as “the value of control gained from the intrinsic value reached by all direct and indirect paths or the value of control given by the network value of directly controlled companies” (Vitali et al., 2011, p. 17), while “the network value of an economic actor is given by its intrinsic value plus the value gained from network” (ibid. p. 18). It should be noted that these measures could differ considerably. For example, in Vitali et al. (2011) Wall Mart is in top rank by intrinsic value (i.e. market capitalization, operating revenue, asset etc.) but has no equity in other firms. Hence, it has a high net-value whereas its net-control is zero. Since our aim is to study the centralization of ownership and control, in what follows we will focus on the net-control measure. Thus, computing the network control, we will be able to verify “how much economic value of companies a shareholder is able to influence” (ibid. p. 31). In a network
control perspective, then, an economy is centralized to the extent that the biggest firms are able to influence a huge economic value by means of a dense web of direct and indirect controlling shareholdings. When the authors apply to the ownership network a minimum threshold for the ownership quota in the corporate shareholding amount, their definition of control as “network influence” is perfectly coincident to the control of capital. On the basis of their analysis, Vitali and coauthors show that in the year 2007 just 737 shareholders controlled the 80% of total global TNC operating revenue, and nearly 40% of TNC operating revenue was controlled by an interconnected core of 295 TNCs, just 0.7% of all the TNC included in the study (Vitali et al 2011; on this meaning and use of network control analysis see also Compston, 2013).
In the work of Vitali et al. (2011), the authors state in passing that their idea of “influence and control” is inspired by a definition of power introduced by Max Weber in 1922. This reminder raises various interpretative problems and this is not the place to deepen it. However, as we shall see, in the present study we suggest that their definition of control and its relations with the concept of power can be directly referred to the works of Marx rather than those of Weber. The measures of network control by Vitali et al. (2011) can be seen then as a representation of the centralization as defined by Marx in terms of concentration of property and control over the stock market capital.
Finally, the analysis of Vitali et al. (2011) and similar studies focus in datasets that are limited in time or in size, examining just single periods or presenting companies from individual countries or limited sectors. Our goal is a generalization of the work of Vitali et al. (2011): while they take just one year as a reference point in their analysis, we shall apply their definition of network control to an alternative dataset that allows examining the global processes of capitalistic centralization in all sectors and in a temporal perspective, with particular reference to a period of sixteen years before and after the financial crisis of 2007.
1.4 Methodology
In the present study we then adopt a methodology for network construction similar to the one used by Vitali et al. (2011). A short summary of the method is presented in the following lines.
An ownership network is a weighted directed graph where the nodes model economic entities and the edges, between shareholders and companies, represent ownership relationships. The ownership relations across firms have specific properties from a network theory point of view. In particular, we are interested in computing the net-control as in Vitali et al. (2011), namely "the value controlled by a shareholder taking into account the network of firms in which it has direct or indirect shares" (ibid. p. 17). As in literature (Laeven and Levine, 2007), we define an indirect shareholder of a company
A, a shareholder C of a company B having an ownership quota of A. C is indirectly a shareholder of
A through B. To compute the network control from a root node we need to traverse the graph avoiding cycles. In literature, the graph traversal avoiding cycles has been performed in various ways (Skiena 2012). Among the various network algorithms (details in Newman 2010, in the 10th chapter “Fundamental network algorithms”), we cite Breadth First Search and Depth First Search. The BFS algorithm is suitable for shortest path detection, cycle removal and tree/forest building. The DFS algorithm is able to detect and remove cycles, it is faster than the BFS and it can be used to create
a result, when two alternative paths exist between node A and node D (A - B - D and A-D) it selects the longest one (A -B -D). On the opposite, the BFS will select A-D the direct link. In the study of ownership and control, direct control is generally considered more important than indirect control. All algorithms that prefer short to long paths must be preferred. Following the approach of Vitali et al. (2011) that used the BFS we developed our exploration of the networks node by node.
The network classification reported by Vitali et al. (2011) distinguishes three main regions in a directed graph: a SCC (Strongly Connected Component), an IN region, an OUT region where the nodes can be reached in different ways. In the SCC two generic nodes are connected by a path in both directions (from node A to node B and from node B to node A), in the IN region the nodes can be reached only by ingoing links while in the OUT region the links are outgoing. The group of nodes having only outgoing links belongs to the OUT region, the group of nodes having only ingoing links are the IN region and the special region where nodes are connected in a such way that two generic nodes (A and B) can be reached by paths in both directions: from A to B and from B to A is known as strongly connected component SCC. Notice that in the ownership network nodes can have, at the same time, ingoing links and outgoing links (i.e. can be at the same time owners and owned by others), when a node has this property and belongs to a SCC region has an high connectivity. In the ownership network the SCC region corresponds to an ensemble of nodes that are at the same time shareholders of companies and participated by other ones i.e. are owners and owned at the same time, from the network perspective they have both in and out links. The nodes in the IN are companies owned by others investors with no shares of other companies. Finally, the nodes in the OUT are pure owners. During the time interval of our analysis the change in the proportion of each region will determine the evolution of the concentration and average ownership. Once performing a BFS on the various regions of the graph, several conditions can occur: a) the BFS starts with a node in the SCC due to the existence of cycles the algorithm will explore the network avoiding back links and will prefer short paths over long ones; b) when the BFS explores an OUT node the algorithm can eventually arrive to the SCC or stop before reaching it, in this case the network is probably fragmented in different communities; c) if the BFS starts on an IN node then the algorithm will stop immediately. This case coincides with a company having no shareholders or the node itself is just a shareholder of one or more companies. In our database, the presence of IN nodes representing pure shareholders is large: in these nodes the network control contributed by the tree is equal to zero.
Starting from the root node, we compute the net-control i.e. the total flow of economic value that is related to the root node via direct and indirect ownership ties. We sum up each link contribution:
𝜂 = ∑ 𝑤𝑖 𝑁
𝑖=1
where 𝑤𝑖 is the weight associated to each one of the links connected to the root node through the BFS algorithm. By construction, the links have the direction “out” from the root node.
With respect to other measures of indirect control (Brioschi et al., 1985), the main difference of our study is that we follow Vitali et al. (2011) in accounting in each step of the exploration for the weight of each visited link and summing up the total value generated by each ownership relation. It is worth noticing that in our definition the net-control is not normalized to the size of companies (market cap) and it is not considering the distant links as less important. The trees explored by BFS can be large in size (many nodes) and in total economic value (many large ownership relations).
Generally speaking the larger is a tree the larger its net-control. Therefore, it could be possible that a company, even not too big, has a high net-control only thanks to the neighboring firms’ value. In order to limit the effects of this drawback, we follow Vitali et al. (2011) and employ minimum holding thresholds. In line with Santos (2015) we focus, mainly, on the share thresholds suggested by the literature: 5 percent according to Zingales (1994, 1995); 20 percent proposed in La Porta et al. (1999) and the 50 percent majority threshold recommended by Chapelle and Szafarz (2005). Thus, to associate the net-control with the notion of control we filter out the links having respectively less than the 5%, 20%, 50% of ownership and we compute the net-control on the remaining network. Hence, we can say that a company having a high net-control in the filtered network has a large control of capital. In the end, following Vitali et al. (2011), we will reach a crucial measure of net control: for each threshold we will calculate the fraction of top holders holding cumulatively the 80% of the total net-control. We will be allowed to say that capital centralization is high if that fraction is low, and that if that fraction decreases then the centralization of capital increases over time. As we will see, the sample obtained with a 5% threshold is much wider and more complex than those determined by adopting the thresholds of 20% and 50%. It is therefore at the 5% threshold that we will mainly refer to in this paper. However, in order to measure the significance of the results obtained, we will also provide results for samples with higher thresholds.
1.5 Data
A database for historical ownership studies must fulfil several requirements of data quality. Firstly it must be quite stable during time, i.e. the majority of the companies and their investors have to be present all long the years of analysis. Secondly, it must have a worldwide coverage to mitigate the national differences in shareholder legislations. Finally, the companies must be part of a homogeneous group having similar standards in financial accountability and in declaring the data of investors and shareholders. In our experience, those requirements can be achieved in part or completely by: 1) selecting public companies listed in stock markets worldwide and active in trading share positions; 2) selecting companies having a capitalization large enough to ensure stricter requirements in financial disclosure and accountability rules. In fact, as a rule of thumb the larger is the capitalization of a company the more likely it has a long business history and more transparency about its business, shareholders and investors.
Our ownership database of shareholders (both companies and investors) has been created querying the Thomson Reuters Eikon database, which covers one of the largest and most complete sets of world’s top market capitalization companies over a long period with all financial data. The database has several internal quality checks on the data as well as data transformations to ensure consistency in the reports (for instance using USD worldwide with automatic currency adjustment for exchange and inflation).
To select the companies in the Eikon database, with worldwide coverage and adequate transparency in reporting the ownership structure we performed several queries using the market capitalization level of the firms as a filtering threshold. Increasing the minimum capitalization we retrieve less companies and less countries from the database, but we obtain better data about
the entire ownership structure. After several experiments we determined that 1B USD is a minimum level of capitalization large enough to ensure a worldwide coverage (71 countries) retaining a good quality in the ownership details.
The initial list of 5515 companies having more than 1B USD capitalization in 2016 is searched backward in the Eikon database year by year since 2001. Not all companies available in 2016 were already traded in the initial years. Indeed, despite the large threshold used in the initial selection the companies that are present from 2001 to 2016 are only 2750. Incidentally, if we had selected a smaller threshold of 100M USD the turnover of the companies would have been much larger (90% of the companies with 100M capitalization or less that are present in 2016 were missing in 2001). The changes in the number and composition of the database require a “robustness check” to ensure that the findings on average global quantities (for example ownership concentration and network properties such as density) will remain stable. This robustness check is performed by simply adding/removing a fraction of the companies (from 2750 to 5515) in each year of the dataset and recomputing the average properties. Removing and adding at each run a set of companies in the simulation addresses also the issue of the missing or incomplete data as the effect of the lack of data does not hurt the average results. This test is giving the answers about the stability of the measures and also confirms that, with the choice of 1B USD, the average properties that are the main findings of our work will stay quite stable despite the yearly variation of the numerosity of the sample.
Starting from the database, we create an ownership network per each year. In this network the nodes can be other companies (private or public), investors such as funds, people and even countries: the links are the respective ownership relations. If available, to each node we add the attributes of market capitalization, country and city and typology of investment (i.e. strategic investor or not). Private investors are not supposed to report information about their assets while governments, institutions, or private citizens have no market capitalization.Ownership relations among investors and companies form the links. We can add two different weights to each of them: percentage of ownership or actual quota in 2016 USD. Moreover, each link (a-b) has a direction resulting from the rule: a (source)→b (target) if b owns a fraction of a. Using all information from investors and companies we were able to create larger networks having in 2016 about 45 thousand nodes and almost 1 million of ownership links including also those links that do not report a quota (i.e. shareholders that do not disclose their ownership investments).
With respect to the work of Vitali et al. (2011), the fundamental difference of our study is that we use a different database which allows to develop their analysis over several years. Vitali and her coauthors adopt the ORBIS database, which allows them to build a very large ownership network but related only to the year 2007.The drawback of having such a large database of more than 400k nodes is the long process of data assessment. The authors are forced to perform a large manual cleaning of the data to solve, for instance, the collisions of names for large corporations among different jurisdictions. Also because of these drawbacks, their study focused on a single year analysis. Differently, we adopt the Thomson Reuters Eikon database, which is smaller than ORBIS but allows a multi-year study of the network. This feature is needful to verify the validity of Marx's argument on the historical tendency to centralization of capital.
In order to consider the different ways in which the centralization of capital may materialize, our networks are not constant over time for size, i.e. in terms of number of links and number of nodes. Thus, a flexible database where economic entities are able to enter or exit allows us to verify, for example, the entry into the market of new shareholders, the exit from the market of the weak capitals
and bankrupt companies and the merger or acquisition transactions, which are typical features of the different phases of capital centralization. Hence, in our analysis the number of investors (companies and shareholders) can change during years.
1.6 Results
Before dealing with our measure of capital centralization, some preliminary features of the network are presented. The first feature is a changing network in size and density from 2001 to 2016: in 2001 the network had 14694 nodes and 401247 links whereas in 2016 the nodes are 45126 and the links 1286364. Table 1.1 displays some preliminary descriptive statistics. The number of nodes and links almost increases over time, in particular during the years 2005-2006. The higher is the threshold, the smaller is the number of connections, and this is due to the fact that we select very big companies that usually are controlled even with just small percent of total share (Zingales, 1994, 1995).
N nodes Tot. links 5% links 20% links 50% links ΔLinks average all samples Δnodes
2001 14694 401247 3289 840 342 ̶ ̶ 2002 16054 480607 3320 819 317 3% 9% 2003 17015 533211 3220 703 235 -8% 6% 2004 19057 575214 3355 691 245 4% 12% 2005 23981 607207 3598 691 253 4% 26% 2006 30526 665072 4581 1002 376 33% 27% 2007 32449 728840 4862 1048 377 5% 6% 2008 34449 874740 5584 1203 432 16% 6% 2009 35940 922664 5701 1293 465 6% 4% 2010 38083 935000 5737 1395 533 6% 6% 2011 38644 951261 5821 1421 560 3% 1% 2012 39569 987147 5958 1418 566 2% 2% 2013 38548 1015233 6011 1433 591 2% -3% 2014 39803 1089509 6287 1461 586 3% 3% 2015 42269 1178747 6619 1479 586 4% 6% 2016 45126 1286364 6890 1487 580 3% 7%
Table 1.1. Size of the network (2001-2016).
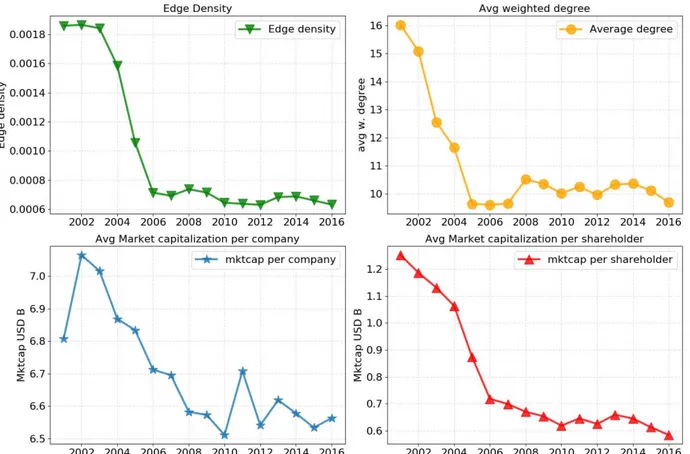
Since the size of the networks (both number of links and number of nodes) changes during years, our analysis considers only measures rescaled by size. Thus, instead of number of nodes or number of links, we are most interested in measuring the average network density and the average degree.By rescaling by size we preliminarily investigate some elements that are not related to the size of the network but depend on its structure and composition.In this sense, Figure 1.1 summarizes simple measures of network connectivity: the network edge density; the average degree that in our weighted
Figure 1.1. Some simple measures of network connectivity: Edge density, Average weighted degree, Average market
capitalization per company and per shareholder.
It should be noted that all the quantities examined show a marked tendency to decrease in the years before the 2007 crisis, which seems to be exhausted or at least attenuated in the following years. A possible explanation of the changes we observe in the average network measures can be drawn from an analysis of the financial trends at the time preceding the crisis of 2007. The decrease in the edge density can be seen as the result of the arrival in the market of many new investors who diversify their portfolio of investments. Especially before the crisis of 2008, this arrival resulted in a sharp decrease of the network density (i.e. for each node many more new links were created). Similarly to the link density also the average capitalization per company and per shareholder decreased because of the entering of new investors (this second plot considers all investors including privates and institutions). The trends before 2007 can be interpreted in several ways: one interpretation which can be considered in line with the Marxian theory of centralization is inspired to Minsky’s contributions to the study of the euphoria waves in the market which usually come before a collapse (Minsky, 1982; see also Stockhammer, 2004). Actually, this view finds support in Roubini and Mihm (2010), who state that in 2006 the euphoria among investors percolated upward throughout the entire financial system (see also Carvalho and Gabaix, 2013; Caverzasi, 2014; Dymski, 2010).
We can now focus on the main result of our analysis: a measure of centralization of capital during the period 2001-2016 in terms of ownership and control concentration around the world. In order to present our results we use the Lorenz-like curve already adopted by Vitali et al. (2011). This curve is obtained by inverting the order on the x-axis of the usual Lorenz curve, ranking the shareholders according to their relevance and reporting the fraction they represent with respect to the whole set of shareholders. The y-axis represents the corresponding percentage of network control (more details in
Glattfelder, 2010). We then select a threshold of ownership of the 80% of cumulative net control. In the choice of such a threshold, we follow Vitali et al. (2011) and more in general the literature about income and wealth distribution (see: Atkinson and Bourguignon, 2000; Clementi and Gallegati, 2016). The black line at 80% y-axis level, intersecting the curves of net-control, allows determining on the x-axis the fraction of companies owning the 80% of the cumulative net-control. We can say that the smaller this fraction, the higher the centralization of capital; and if this fraction decreases, then the centralization increases over time. Furthermore, it is important to remember that we analyse the net-control in three different samples: with 5%, 20% and 50% control thresholds. Hence, summarizing, we first compute the net-control with three different control thresholds as measures of capital centralization. Then, for each of these three samples we determine the fraction of investors who hold the 80% of the cumulative net-control. Thus, as in Marx’s interpretation, we can discover if a huge mass of capital represented by the net-control with control quota is actually concentrated in a few hands or not.
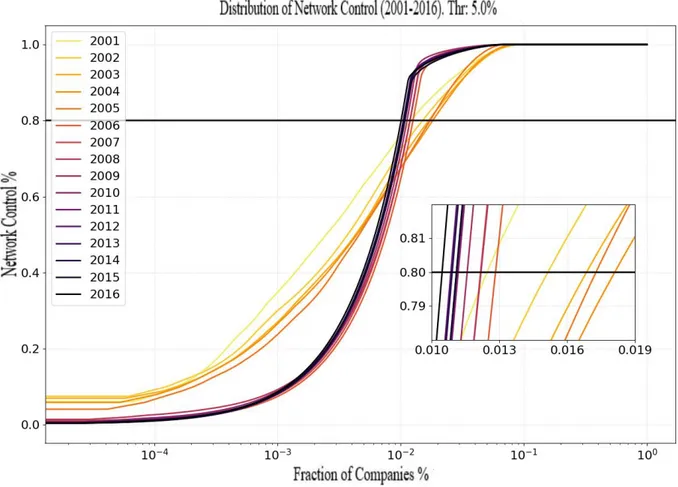
The following Figure 1.2 provides a graphical representation of the centralization of capital referred to the case of network control measured with a minimum ownership threshold of 5%. This means that within the network the links relating to ownership shares below this threshold are eliminated. Figure 1.2 is a Lorenz-like curve with an inset plot that is a zoom of a region of the plot where the curves are crossing the 80% total net-control line. To build each curve (one per year since 2001) we ranked the companies according to their control and we computed their cumulative net-control by reporting in the x-axis (log-scale) the fraction of companies, and in the y-axis, the total held net-control. For example, when the total held net-control is equal to 80% of the total, then the fraction of companies having such value is around 10-2, i.e. 1%. The inset plot allows to explore the intersection at the reference level of 80% of total net-control and to study how the corresponding fraction of companies has changed in time.
The first findings that can be drawn from Figure 1.2 are consistent with Vitali et al. (2011). Indeed, network control is highly concentrated: the fraction of top holders holding cumulatively the 80% of the total net-control, is always within the range between 1% and 2%. Therefore, the control of capital is highly centralized and is much more unequally distributed than income and wealth. Nevertheless, in addition to these results, the temporal character of our investigation allow us to unveil for the historical trend of capital centralization. In order to draw this trend, here we introduce a variant with respect to the representations of the Lorenz-like curves proposed by Vitali et al. (2011), in the sense that while they show a single curve referring to 2007, we display on the same graph many curves for each of the examined years. Then, we need to analyse Figure 1.2 in the light of these aspects: a) the Lorenz-like curves are intersecting the 80% line represent the fraction of companies cumulatively holding the 80% of the net-control; b) to get the behaviour year by year in the inset plot of Figure 1.2 we can read the intersection values at 80%; c) the range of greys curves is changing from light to dark across the years.
As we have previously specified, the sample obtained with a 5% threshold appears to be wider and more complex than those determined by adopting the thresholds of 20% and 50%. For this reason, we mainly refer to the 5% threshold and only comment a graph built on it. However, in order to measure the significance of the results obtained, in what follows we will also provide information on samples with higher thresholds. Based on these elements, we can draw the following results.
First, for each threshold considered (5%, 20%, 50%) the Lorenz-like curves are bunched in two groups: interval 2001-2005 and interval 2007-2016, with 2006 that belongs to this second group but can be considered as a watershed.
Second, in the case of a threshold of 5%, we can see an increase in capital centralization over the entire period. From 2001 to 2016 the fraction of companies owning the 80% of the market net-control changes from an initial 1.25% to a final 1.0%, with an increase in centralization of about 25%.
Third, during the period 2001-2005 the curves related to each threshold examined tend to be dissimilar less, there is variability in their shape.
Fourth, for each of the three threshold considered the interval 2007-2016 always shows a systematic and regular increase in centralization over time, i.e. the curves always move from right to left. In particular, during these years, for the three samples examined the measure of capital centralization always increases of more than 20%.
In conclusion, in the main case of a threshold of 5%, between 2001 and 2016 we find a global tendency toward centralization of capital. After 2006 this trend assumes a more regular and general character and is confirmed for all the thresholds considered.
Figure 1.2. The Lorenz-like curve of network control n with minimum share quota of 5% (least most strict rule for
control). The net-control of each node is ordered cumulatively and plotted versus the rank of the node (x-axis). The black line at 0.8 represents the 80% of the net-control held by companies. On the inset plot, we can read the fraction of companies owning the 80% of the market net-control: from 2001 to 2016, fractions change from an initial 1.25% to a final 1.0%.
In the domain of financial networks literature it is customary to study the so called “core-periphery structure” of the network distinguishing the nodes that, for their connectivity, tend to stay on the centre of the graph, known as “core”, and the nodes that are weakly connected to others and stay apart, on the “periphery”. A precise statistical test to determine whether or not a node belongs to the core is beyond the scopes of this paper (the reader can see Csermely et al., 2013). Here we just want to stress the change in the local density for the cores due to the different “strength” of the nodes in 2007 and 2016. Strength is defined as the sum of the weighted degree of a node i:
𝑆(𝑖) = ∑ 𝑤𝑘(𝑖) 𝑘
where k is an index running on the neighbours and 𝑤𝑘 is the weight of the link around the node i. This measures take into account the real effect of each node in terms of ownership (notice that here the weight here is the absolute value of the ownership computed in Billions of USD; for further details, see Newman, 2010).
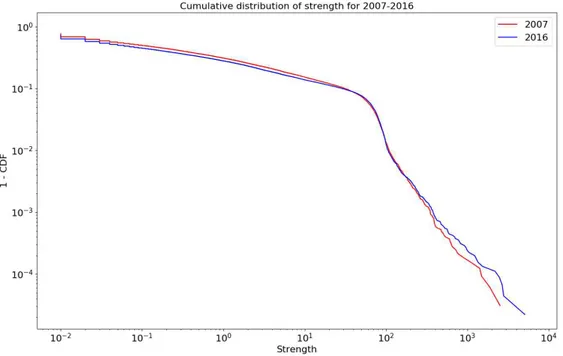
Figures 1.3a and 1.3b represent the ownership networks in 2007 and 2016 with a minimum shareholder quota of 5%. It is interesting to note that the network of 2016 is larger in size and visually denser but has a lower average density. This finding seems to contrast the results about the increase in the centralization of capital between 2007 and 2016 that we have shown before. This puzzle can be overcome by studying the “strength” distribution of the two networks 2007 and 2016. The analysis in Figure 1.4 reveals that in 2016 the strength of the most powerful nodes has increased compared to the year 2007 (the darker curve of 2016 is above the lighter line of 2007 for strong nodes). Vice versa, the weak nodes have diminished their strength in the more recent network (the darker line is below the lighter one in the left part of plot). In sum, weak nodes become weaker and strong stronger. This shift in the strength of the nodes is responsible for the change in the density we observe in 2016 and is related to the increase in capital centralization calculated as the fraction of companies who hold 80% of net control. As a summary of the comparison between 2007 and 2016, while the general average link density is lower the network core is more dense and capital centralization is higher.
The names of the companies shown in the network plots of Figures 1.3a and 1.3b have been selected according to their large net-control. In line with Vitali et al. (2011), the financial companies are in all the networks among the largest nodes for total net-control. Notably, the top 3 control-holders in 2007 are Fidelity Management & Research Company, Capital Research & Management Company and BlackRock Institutional Trust Company, N.A.. In 2016, the top 3 control-holders ranking is similar: the Vanguard Group, Inc., BlackRock Institutional Trust Company, N.A., Fidelity Management & Research Company. It is interesting to note that financial companies still mainly compose the core of the global ownership network even after the financial crisis of 2007.
Figure 1.3b
Figures 1.3a & 1.3b. Ownership networks in 2007 and 2016. The links represent ownership relations with a minimum
threshold of 5%, the nodes are the companies. A classical algorithm of network layout (force layout) adjusts the node positions according to the strength of their mutual relationships. Nodes that are closer in the graph are connected by strong ownership quota. The graphical layout arranges the nodes “naturally” in a core-periphery structure as the strongest nodes tend to be on the centre of the distribution, the weaker in the periphery.
Figure 1.4. Strength distribution for 2007 and 2016. The nodes with large strength in 2007 increase their relevance in
2016. The nodes with weak links have even weaker links in 2016.
1.7 Conclusion
The purpose of this paper has been to explore the historical trend of centralization of capital in the world. In order to do that, the study extends the analysis of Vitali et al. (2011) from one to many years providing, to the best of our knowledge, the first global empirical investigation of the phenomenon.
We interpreted centralization as a concentration in a few hands of the control of share capital and we measured it in terms of network controlfiltered by minimum shareholding thresholds. In adopting this measure, we noted that the network control is highly concentrated in the world: the fraction of top holders holding cumulatively the 80% of the global economic value of the firms considered in the sample is always under the fraction of 2%. Furthermore, by inspecting the temporal dynamics of the phenomenon we observe an increase in the global centralization of capital: this trend appears to be partially dependent on the threshold chosen until 2006 whereas it assumes a more regular and general character from the financial crisis of 2007 until 2016, with an increase of more than 20% for all the samples considered. In the early years of the 21st century, especially since the 2007 crisis, Marx's thesis of a global tendency towards the centralization of capital seems to find empirical confirmation. Our findings contrast with the arguments proposed, a few years ago, by Paul De Grauwe. Indeed, in a co-signed paper De Grauwe refused a particular interpretation of Marx's centralization thesis, namely that relating to the process of markets monopolization and power concentration by a few large multinational corporations. In support of this view, De Greuwe and Camerman (2003) reported some data which showed that the multinationals are very small compared to the gross domestic product of the countries that host them, and that these companies are also relatively smaller than in the past.
According to De Grauwe these results would also be valid for the future and should be seen as a denial, not only of the law of the tendency evoked by Marx, but also of those political movements which, inspired by it, identify a potential threat to present democracy in the centralization of capitalist power. The aforementioned study is attractive since it represents one of the rare analysis in which Marx's theory of centralization is taken into consideration by leading exponents of the prevailing theoretical paradigm and above all is subjected to some sort of empirical validation. On closer inspection, however, the measure of centralization employed by De Grauwe and Camerman is atypical and somewhat misleading. Indeed, the Marxian 'law of motion' cannot be reduced to a mere calculation of the weight of the multinationals on the gross domestic product. Nevertheless, beyond the accuracy of De Grauwe's approach, with the present work we have been able to verify that all evaluations on the validity and relevance of the concept of capital centralization can change drastically if we adopt a more complex measure and, in many respects, more faithful to Marx's original definition.
This study did not investigate the possible determinants of centralization processes. Our results, however, could open the way to possible future research. In our view, further analyses should be dedicated to a clarification of the theoretical nexus between the law of centralization and the Marxian schemes of reproduction: a possible solution could come from an interpretation of the changes in ownership and control associated to centralization in terms of structural change and economic dynamics (on the concepts and method of structural dynamics analysis see Scazzieri, 2009 and Baranzini and Scazzieri, 2012; on the Marxian schemes of reproduction see Trigg 2006, among others). Further studies may also verify the existence of causal links between the tendency toward centralization of capital measured in terms of network control and the economic crisis. By an exhaustive examination of these links, evidence could emerge on the possible role played by economic policies, with particular regard to the rules of conduct of central bankers conceived as regulators of solvency and related processes of centralization of capital (on this theme see Brancaccio and Suppa, 2012; Brancaccio and Fontana, 2013, 2015; Brancaccio, Califano, Lopreite, Moneta, 2017).