1611
Received: 2 December 2013 Accepted article published: 23 January 2014 Published online in Wiley Online Library: 26 February 2014 (wileyonlinelibrary.com) DOI 10.1002/ps.3734Modelling the potential distribution of Bemisia
tabaci in Europe in light of the climate change
scenario
Gianni Gilioli,
a*
Sara Pasquali,
b
Simone Parisi
c
and Stephan Winter
d
Abstract
BACKGROUND: Bemisia tabaci is a serious pest of agricultural and horticultural crops in greenhouses and fields around the world. This paper deals with the distribution of the pest under field conditions. In Europe, the insect is currently found in coastal regions of Mediterranean countries where it is subject to quarantine regulations. To assess the risk presented by B. tabaci to Europe, the area of potential establishment of this insect, in light of the climate change scenario, was assessed by a temperature-dependent physiologically based demographic model (PBDM).
RESULTS: The simulated potential distribution under current climate conditions has been successfully validated with the available field records of B. tabaci in Europe. Considering climate change scenarios of+1 and +2 ∘C, range expansion by B. tabaci is predicted, particularly in Spain, France, Italy, Greece and along the Adriatic coast of the Balkans. Nonetheless, even under the scenario of+2 ∘C, northern European countries are not likely to be at risk of B. tabaci establishment because of climatic limitations.
CONCLUSION: Model validation with field observations and evaluation of uncertainties associated with model parameter variability support the reliability of model results. The PBDM developed here can be applied to other organisms and offers significant advantages for assessing the potential distribution of invasive species.
© 2014 Society of Chemical Industry
Keywords: Bemisia tabaci MEAM1; population dynamics; invasive species; potential establishment; climate variability; biological
variability
1
INTRODUCTION
Bemisia tabaci is a serious pest of agricultural and horticultural
crops cultivated in tropical and subtropical climates around the world. A genetic analysis of world populations of B. tabaci revealed that it is a cryptic species complex composed of 11 well-defined genetic groups comprising more than 28 distinct species.1–5The
global status of B. tabaci as a pest refers mainly to two species: MEAM1 (formerly named biotype B) and Med (formerly named biotype Q), which are highly polyphagous, highly invasive and distributed worldwide, including the coastal regions of Mediter-ranean countries of Europe. Notwithstanding the major signifi-cance of MEAM1 and Med, other B. tabaci species can also be important agricultural pests and be particularly damaging by transmitting viruses causing serious crop diseases.6–8
B. tabaci occurrence in open fields in Europe is currently
restricted to coastal regions of Mediterranean countries. Because of its worldwide occurrence as a major pest and the intensive global movement of agricultural and horticultural commodities, there is an inherent threat of B. tabaci and its associated viruses arriving from outside Europe. The pest and the viruses it transmits are currently subject to quarantine regulations within Europe, aimed at preventing introductions of B. tabaci and associated viruses and the further spread of existing populations. Conse-quently, a pest risk analysis (PRA) of B. tabaci to plant health in Europe was conducted by the Panel on Plant Health of the
European Food Safety Authority (EFSA) at the request of the European Commission.9The present study was initiated to help
the EFSA PRA by providing a map of the potential distribution of
B. tabaci under extant weather and its range expansion in the face
of climate change. Temperature is the major environmental vari-able that influences the development, survival and reproduction10
and dynamics of B. tabaci populations, and its potential geo-graphic range. Expansion of the pest northwards is thought to be limited by low temperatures, explaining why countries in the north of Europe are considered potentially pest-free areas, but this could change under the effect of climate variability.
Evaluation of the impact of climate variability on potential range expansion of invasive alien species requires the use of appropri-ate methodologies. Common correlative methods used to predict the geographic distribution of invasive alien species are classed as
∗ Correspondence to: Gianni Gilioli, DMMT, University of Brescia, Viale Europa 11,
25123 Brescia, Italy. E-mail: [email protected]
a DMMT, University of Brescia, Brescia, Italy b CNR-IMATI, Milan, Italy
c DiSAA, University of Milan, Italy
1612
ecological niche models (ENMs) which attempt to characterise the ecological niche of a species on the basis of weather and other fac-tors in the species’ native range. With restrictions, ENMs can also be used to estimate the potential invasiveness of the species in new areas. These methods include statistical models (e.g. GARP), phys-iological indexes (e.g. CLIMEX), artificial intelligence (e.g. MaxEnt) and other methods reviewed by Elith and Leathwick11and
Gutier-rez et al.12 Empirical or statistical modelling approaches used to
estimate the potential establishment of invasive alien species pro-vide useful insight when the relationships within the systems are insufficiently known. However, simplified statistical and correla-tive models may lead to incorrect interpretation of the effects of environmental forcing variables on population dynamics. Integra-tive processes that give rise to counterintuiIntegra-tive population system responses may occur, and consequently the population dynamical patterns arising may not be simply interpretable in terms of linear responses to change in the environmental forcing variables.13
Mechanistic approaches are preferable when the underlying functional mechanisms of the processes are known in sufficient detail. Mechanistic models are crucial to evaluate the effects of biological and ecological processes on population dynam-ics, especially in complex systems characterised by non-linearity and acting over a wide range of space and time, as is the case when evaluating the effects of climate variation.14–16
Mech-anistic approaches based on physiologically based population dynamics models (PBDMs17) allow fine-scale predictions of the
potential distribution using ecologically meaningful state vari-ables directly related to the pest (population number or biomass). PBDMs have significant implications for the projection of pop-ulation distribution and dynamics under climate change sce-narios. These models take into account non-linear relationships between environmental forcing variables (e.g. temperature) and biological processes, so that population dynamics can be realis-tically described in sufficient detail, allowing the exploration of complex scenarios in which no simple (i.e. linear) conclusions can be drawn.
This paper reports on the development of an age-structured population model describing the local temporal dynamics of B.
tabaci MEAM1 under current climatic conditions. The model
sim-ulates the population dynamics at the nodes (i.e. local dynamics) of a gridded map of Europe. Simulation data on whitefly popu-lation dynamics driven by extant temperature are used to define prospectively the potential distribution of the whitefly in Europe. The potential distribution is validated by comparison with data on the current field distribution of B. tabaci. Change in the average local population abundance and in the area of potential distribu-tion are then investigated, considering variability in populadistribu-tion dynamics owing to variability observed in the data used to develop the model. Finally, systematic perturbations of temperature of +1 and +2 ∘C are used to simulate the effects of climate change on the potential abundance and distribution of B. tabaci.
2
METHODS
2.1 Model structure
A lattice PBDM was used to describe the population dynamics of B.
tabaci in Europe on a 25 × 25 km grid. Two developmental stages of
the insect were considered: immature (egg, nymphal instars) and reproductive adult. At each node of the grid, the population abun-dance of immature and adult stages was calculated using a PBDM, mathematically represented by von Foerster equations,17–20 the
details of which are stated in Appendix 1.
In the model, population dynamics is the outcome of the three fundamental demographic processes: development, mortal-ity and fecundmortal-ity regulated by rate functions (also known as biode-mographic functions) that depend on environmental variables. In this first approximation, temperature was considered as the most important environmental forcing variable because of its main role in regulating the rate of biophysical processes in heterotherm species such as B. tabaci. Further relevant variables, including the host plant, could be easily introduced into the model.12
The daily rate of development as a function of temperature defines the change in physiological age within immature stage and adult stage (ageing process). The mortality rate function is the daily rate of individuals leaving the system owing to temperature-dependent intrinsic mortality.18 The fecundity rate
function is the daily number of eggs produced by a reproduc-tive female and describes the flux from the adult stage into the immature stage. Functional forms of development, mortality and fecundity rate functions are detailed in Appendix 2. Parameters for these functions were estimated for each stage of the population by fitting literature data for B. tabaci MEAM 1 using a non-linear least-squares regression method. This method also allowed esti-mation of the confidence bands for the biodemographic functions (Appendix 2).
Population abundance Nij(t) at each stage i in cell j at time t was obtained by considering a discretisation of the von Foerster Equations.20,21 The model simulates an entire year of B. tabaci population dynamics with a time step of 1 h. This small time interval guarantees convergence of the discretised von Foerster equations. The initial condition for whitefly is 0.1 adults plant−1on
1 March. From Nij(t), an index was derived for population pressure related to average population abundance defined as the average number of adults per plant and time unit calculated for the period of the year during which the abundance of adults was above a threshold of 1 adult plant−1. The index values were then mapped
to visualise the area of potential establishment under the current climatic conditions and under two climate change scenarios.
2.2 Data and parameter estimation
Biodemographic parameters for B. tabaci MEAM1 were obtained from available literature on life history studies.22–52 Most
ref-erences considered a dependence of life history traits on temperature as well as on host plant. The present authors only considered the dependence of biodemographic functions on temperature, and host plant as well as other factors (e.g. the origin of the experimental population) are regarded as components con-tributing to experimental heterogeneity. For precision, only data from reports in which the taxonomic identity of the experimental population was clearly determined were considered.
Meteorological variables are the fundamental driving forces for
B. tabaci population dynamics. The climatological data input of the
model was retrieved from the WORLDCLIM database (University of California at Berkeley, http://www.worldclim.org/)53
contain-ing the monthly mean of minimum and maximum temperatures for the period 1950–2000. The WORLDCLIM database consists of gridded data assembled from a large number of sources, includ-ing: (i) the Global Historical Climate Network Dataset (GHCN), v.2. (http://www.ncdc.noaa.gov/pub/data/ghcn/v2); (ii) the clima-tological normals (CLINO) for 1961–1990 (WMO, 1996); (iii) FAO-CLIM 2.0, the global climate database (FAO, 2001). For simulation of population dynamics in Europe, the original world grid was restricted to the area −11–41∘ E , 30–73∘ N. The climate data cal-culated for such a long reference period express a robust average
1613
temperature input for the model. From the WORLDCLIM database,maximum and minimum monthly temperatures were obtained for each node of the grid. Subsequently, an interpolation model con-sidering geographic position and astronomic data was used to obtain the hourly temperatures at each node (see Appendix 3).
Model validation was done with all records of B. tabaci presence in Europe and studies on the geographical distribution of the insects taken into account.54–74 The model performance was
evaluated by superimposing the locations of B. tabaci findings in Europe, as reported in the literature,54–74on the map of model
prediction of B. tabaci occurrence.
2.3 Scenario analysis
2.3.1 Exploring biological variability
Literature data on development, survival and fecundity temperature-dependent rates of B. tabaci are affected by the heterogeneity inherent in the different experimental datasets, including biological variability. To take into account variations in biodemographic functions, the 95% confidence bands of the esti-mated development, mortality and fecundity rate functions were estimated (see Appendix 2). A commonly used approach to intro-ducing variability into a model is to apply a Monte Carlo method performing various simulations of population dynamics by vary-ing development, survival and fecundity rate functions in the confidence band regions, and to use these estimates to compute the mean of the simulated abundances. The high computational
complexity of the present system, however, made this method inapplicable, and consequently only two extreme situations were considered here: (i) the lower bound and (ii) the upper bound of the confidence band for development, survival and fecundity rate functions. The distribution area simulated using the Monte Carlo approach was expected to fall between these two extreme cases.
2.3.2 Exploring climate change
Climate scenarios generally consider changes in temperature for time horizons far beyond that of risk assessment analyses. Pro-jections on temperature changes, based on global climate mod-els (GCMs), are subject to uncertainty. This uncertainty is low on a global scale, but with decreasing scale, i.e. on a continental or regional scale, errors increase.75 Thus, the reliability of scenarios
on future spatial and temporal patterns of temperature is strongly affected, and this also disturbs an analysis of B. tabaci popula-tion dynamics following temperature change. Sensitivity analysis in PBDMs driven by meteorological variables13can be carried out,
imposing perturbation to time series of weather data by means of stochastic methods76or deterministic methods modifying the
dataset with predefined changing factors.77The latter approach
has been adopted here, and the forcing variable (temperature) was systematically perturbed by adding 1 and 2 ∘C to the hourly tem-peratures derived from the current climate average at each node for the selected temporal horizon. Further explanation and justi-fication are given in Appendix 4. To assess the impact of climate
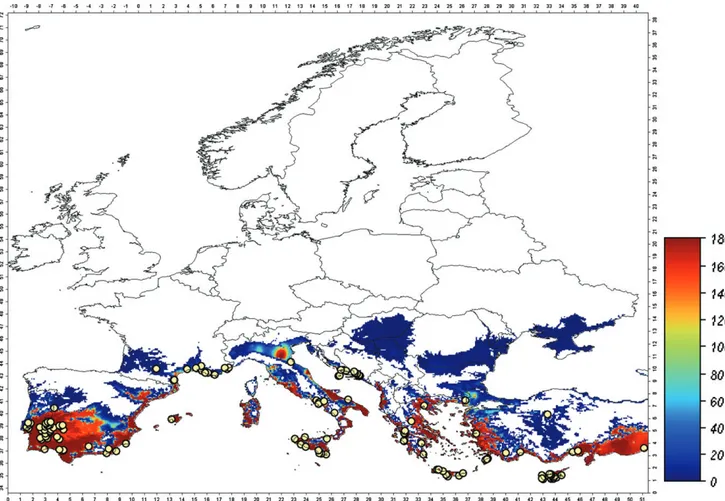
Figure 1. Spatial distribution of the simulated B. tabaci population pressure in Europe, starting from an initial condition of 0.1 individuals plant−1on 1
March, compared with field data (circles). Population pressure is the average number of adults per plant and time unit calculated for the period of the year in which the adult abundance is over 1 individual plant−1.
1614
change on whitefly population dynamics, a time horizon of 20 years was considered.
3
RESULTS
3.1 Model validation and delineating the potential distribution of B. tabaci in Europe
The model output obtained under current climate conditions is validated by superposing the available information on the distri-bution of open field records of B. tabaci in Europe9on the map
of the prospective spatial distribution of the B. tabaci population pressure index (Fig. 1). The simulated distribution of B. tabaci satis-factorily corresponds to the observed distribution, as all recorded findings fall within the predicted area of the potential establish-ment forecast by the model. Some discrepancies may result from the 25 × 25 km spatial resolution in the simulation based on tem-perature estimated at the node of a cell.
Simulation results presented in Fig. 1 depict the area of poten-tial establishment for B. tabaci in Europe, and indicate areas with a population pressure greater than zero. Prospectively, B. tabaci solid establishment is expected in the Mediterranean coastal areas and in the interior regions of Spain (red). Limited presence, indicated by very low population abundance (blue), is expected in south-ern France, in some areas of northsouth-ern Italy and in some regions of the Balkans, suggesting low favourability. Note that intermediate values are very rare. Further, it is not expected that B. tabaci will expand its distribution to colonise regions outside this coloured region because of the lower temperatures prevailing in central
northern regions of Europe, particularly during winter. Thus, coun-tries in the north of Europe (white area in Fig. 1) can be considered to be beyond the climatic limits of the pest.
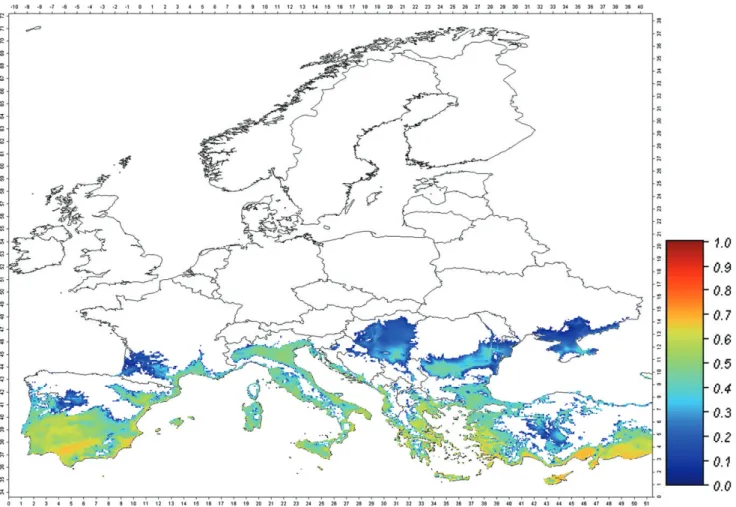
A further characteristic associated with the potential establish-ment is the fraction of the year in which adult whitefly abun-dance is above a given threshold. Considering a threshold level of 1 adult plant−1, the fraction of the year in which the populations
are potentially active is computed at each node of the grid, and results are mapped in Fig. 2. In most of the area of potential estab-lishment, the whitefly is expected to be active only 3–5 months of the year. Only in the warmer areas of southern Europe is the white-fly active for 7 months, in contrast to 1–3 months in the northern limits of its distribution.
Uncertainty associated with experimental heterogeneity was included in the model by considering the upper and lower limits of the 95% confidence bands of the biodemographic functions estimated by literature data (Figs 3 and 4). When the lower bounds for development, survival and fecundity were considered, the potential distribution of B. tabaci was greatly reduced. The whitefly distribution remained limited to the European Mediterranean coastal areas and partly to central Spain, with only lower values of population pressure (Fig. 3). In this case the simulated area of potential establishment was far smaller than the area of current distribution (see the circles in Fig. 1).
Using the worst-case scenario, where the upper limits for devel-opment, survival and fecundity are considered, the area of poten-tial establishment increased and, with it, the putative population density and level of infestation. This is shown by a sharp increase
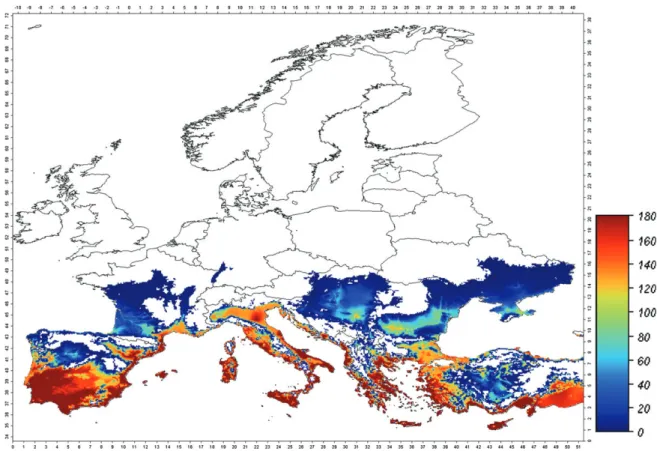
1615
Figure 3. Spatial distribution of the simulated B. tabaci population pressure in Europe, starting from an initial condition of 0.1 individuals plant−1on 1March, and considering lower limits of 95% confidence bands for development, survival and fecundity rate functions. Population pressure is the average number of adults per plant and time unit calculated for the period of the year in which the adult abundance is over 1 individual plant−1.
in the whitefly population pressure index (red) in areas where the insect is established (Fig. 4), and also by an expansion of its poten-tial range generally (e.g. the Balkans). Nonetheless, countries in northern Europe (white) are not in the expanded range and hence not at risk that B. tabaci might establish.
3.2 Exploring the consequences of climate change scenarios
Simulating temperature increases of 1 and 2 ∘C, expansion of the areas currently invaded by B. tabaci is predicted (Figs 5 and 6). Further spread and an increase in abundance are expected, particularly in Spain, France, Italy, Greece and along the Adriatic coast of the Balkans. Apart from small areas in southern Germany and patches in Poland that are prospectively suitable for insect development (Fig. 6), B. tabaci is not expected to establish in such isolated areas. Even under a climatic change scenario of +2 ∘C, northern European countries are not likely to be suitable for B.
tabaci establishment because of adverse conditions, in particular
low winter temperatures.
4
DISCUSSION AND CONCLUSIONS
Several population models that can be helpful to predict the potential establishment of B. tabaci have been developed in the past years (for review, see Naranjo et al.10). The
mod-els integrate biological and ecological knowledge and are temperature-dependent78,79 or spatiotemporal models,24,80 or
aim at predicting population abundance81–84 to support pest
management tactics and strategies or to explain the role of different parasitoids in the biological control of whitefly.
With respect to the models on B. tabaci previously developed, the model proposed here is novel in that it considers biological uncertainties in the projection of the population dynamics and dis-tribution. The model accounts for the biological variation in life history traits of the organism related to heterogeneity characteris-ing different experimental datasets reported in the literature. The model has also been used to explore the effects of climate change on the potential establishment of B. tabaci.
For model development, sufficient information on the biolog-ical characteristics of B. tabaci, from life history data to vector transmission capacity, is available. Because of their significance, most studies have focused on the former B. tabaci biotypes B (MEAM1) and Q (Med). In the initial phase of model develop-ment, the estimated biodemographic functions for MEAM1 and Med were compared, and it was found that only the number of eggs laid per female was generally higher in MEAM1 than for Med species, while development and mortality rates were very similar for the two species. Because significantly more literature references were available for MEAM1, only data for this species were used for model parameter estimation. Based on its biodemo-graphic performances, the present authors consider that MEAM1 has prospectively a wider area of potential establishment and reaches higher average densities. The fact that the Med species
1616
Figure 4. Spatial distribution of the simulated B. tabaci population pressure in Europe, starting from an initial condition of 0.1 individuals plant−1on 1
March, and considering upper limits of 95% confidence bands for development, survival and fecundity rate functions. Population pressure is the average number of adults per plant and time unit calculated for the period of the year in which the adult abundance is over 1 individual plant−1.
Figure 5. Spatial distribution of the simulated B. tabaci population pressure in Europe, starting from an initial condition of 0.1 individuals plant−1on 1
March, under a climate scenario with an increase of +1 ∘C from the current temperatures. Population pressure is the average number of adults per plant and time unit calculated for the period of the year in which the adult abundance is over 1 individual plant−1.
1617
Figure 6. Spatial distribution of the simulated B. tabaci population pressure in Europe, starting from an initial condition of 0.1 individuals plant−1on 1March, under a climate scenario with an increase of +2 ∘C from the current temperatures. Population pressure is the average number of adults per plant and time unit calculated for the period of the year in which the adult abundance is over 1 individual plant−1.
could take advantage of its resistance to pesticides would not affect the projection of its potential prospective range as a func-tion of climate.
For the purpose of the PRA, the goal of which was to assess the establishment and spread of B. tabaci in Europe, the model predictions for the area suitable for establishment (Fig. 1) matched well with those locations where B. tabaci has been reported. The regions in Fig. 1 that are highlighted (blue-red) in the graphical presentation of the model correspond to the regions in Europe where B. tabaci is known to occur. This was taken as reasonable proof of the model’s validity. The blue areas in Fig. 1 represent the outermost limits of the B. tabaci possible range and thus demarcates the borders of the area of establishment. Northward, beyond that boundary, B. tabaci cannot establish because low temperatures are limiting. Insects introduced into these areas, i.e. with plant materials, may survive under conducive conditions (in summer or in greenhouses), even lay eggs and develop locally for a few generations, but adverse autumn/winter conditions will prevent establishment.
It can be assumed that B. tabaci species around the world have temperature requirements similar to those of MEAM1 or Med, and hence it is unlikely that B. tabaci species other than Med and MEAM1 could invade and establish in locations outside areas in which B. tabaci MEAM1 and Med have established. Therefore, based on biological data for B. tabaci MEAM1, the model probably captures what is probably the worst-case scenario in terms of the potential establishment and spread.
The results of model validation and the exploration of model parameters made it possible to consider the uncertainties asso-ciated with the definition of the area of potential establishment of B. tabaci. Choosing model parameters less favourable to B.
tabaci population dynamics results in a significant reduction in
the area of potential establishment. However, this projected dis-tribution was far less than the observed disdis-tribution in Europe, making this scenario very unlikely. When highest survival, devel-opment and fecundity for B. tabaci were used in the model, the geographic range of the pest expanded significantly into northern Europe. The area predicted in the worst-case scenario of parameter exploration corresponded well to a +2 ∘C climate change increase in temperature, which makes the worst-case sce-nario unlikely. Considering that (i) the simulated area suitable for establishment that was obtained with the estimated parame-ters matched well with those locations where B. tabaci has been reported, and (ii) the probability associated with the scenario less favourable to B. tabaci is very low and the probability associated with the scenario more favourable to B. tabaci is low, the authors conclude that the estimated biodemographic curves are reliable and the model is only slightly affected by biological parameter uncertainty.
Exploration of the effect of the climate change scenario revealed that, even when a systematic perturbation of +1 and +2 ∘C is added to the current climate, northern European countries are unlikely areas for B. tabaci establishment because of limiting thermal conditions. In northern European countries with extensive
1618
greenhouse agriculture, spread from greenhouse areas to the field will be only seasonal.
PBDMs such as the one developed here for the study of the potential establishment of B. tabaci can be applied to other organ-isms and offer significant advantages, especially when the poten-tial distribution of invasive alien species is to be assessed. Because PBDMs are mechanistic, demographic processes of invasion can be explained from life history strategies described at the individ-ual level.17,19PBDMs are transparent, and the biologically relevant features used to project the population dynamics are mathemat-ically described in detail. PBDMs are based on well-recognised and accepted models in mathematical population ecology, and, because they are realistic and flexible, they can be applied to a variety of species and systematic groups.12Because PBDMs are
bio-physical models, they can consider how the physiology related to life history strategies is conditioned by biotic and abiotic environ-mental variables. A further great advantage of using PBDMs is that they permit assessment and quantification of sources of variability and uncertainty.20,85PBDMs produce quantitative outputs (num-bers or biomass), and the information on the spatiotemporal pop-ulation abundance is biologically meaningful because it can be directly related to impact or used to define ecological properties of populations such as resistance and resilience, or to predict the effect of perturbations (e.g. environmental and biological stochas-ticity). Assessing population development/abundance is also fun-damental to the design of pest management strategy and tactics.
ACKNOWLEDGEMENTS
The authors thank the members of the EFSA Panel on Plant Health and specifically the working group on Bemisia tabaci for helpful contributions and critical discussions.
APPENDIX 1
Model equations
In the model presented here, the population structure of B. tabaci is composed of two stages: immature and adult. Denote by x the physiological age of an individual, i.e. the percentage of develop-ment in a stage, and by𝜙i(t, x) dx the number of individuals at stage i at time t with physiological age in (x, x + dx), i = 1, 2 (i = 1 for immature and i = 2 for adult).
The population dynamics is described by the system of von Foerster equations
𝜕𝜙i(t, x)
𝜕t +𝜎i(t)
𝜕𝜙i(t, x)
𝜕x +𝜇i(t)𝜙i(t, x) = 0, x ∈ (0, 1] , i = 1, 2
with the boundary conditions
𝜎i
(t)𝜙i(t, 0) = Fi(t), i = 1, 2 and the initial conditions
𝜙i(0, x) = ̂𝜙i(x), i = 1, 2
where𝜎i(t) and𝜇i(t) are development and mortality rate, respec-tively, depending on time through temperature, and ̂𝜙i(x) is the initial distribution for stage i.
The egg production flux, F1(t), is given by
F1 (t) = ∫ 1 0 𝜂 (t) fec (t) 𝜙2 (t, x) dx
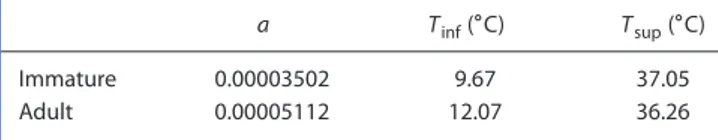
Table A1. Parameters of the immature and adult development rate function
a Tinf(∘C) Tsup(∘C)
Immature 0.00003502 9.67 37.05
Adult 0.00005112 12.07 36.26
where fec(t) is the number of eggs produced by a female in the time unit and depends on time through temperature, and𝜂(t) is a function dependent on adult development rate.
The flux of individuals from stage 1 to stage 2, F2(t), is given by
F2(t) =𝜎1(t)𝜙1(t, 1)
For more details on von Foerster equations in population dynamics, see Hoppensteadt,86 Curry and Feldman,18 Metz and
Diekmann19and Di Cola et al.20For a discretisation of von Foerster
equations to solve the problem numerically, see Di Cola et al.20
and Buffoni and Pasquali.21
APPENDIX 2
Biodemographic functions and parameter estimation
Development rate function
Different development rate functions have been reported for
B. tabaci in the literature: Bonato et al.23 used a Logan
func-tion, while in Muñiz and Nombela38 the development rate
function of B. tabaci was described using a Lactin function. For the functional form of the Logan and Lactin functions, see Kontodimas et al.87Here, the development rate function is
mod-elled using the function proposed by Brière et al.88 because
of the advantages it offers in terms of interpolation of the experimental data:
𝜎 (T) = aT(T − Tinf
) √
Tsup− T
Data collected in the literature are fitted with the function
𝜎(T) using the nlinfit MATLAB function based on a non-linear
least-squares regression method. The estimated parameters a, Tinf
and Tsup for the immature and adult are reported in Table A1.
For the adult stage, development has to be interpreted in terms of ageing, and the development period defines the maximum lifespan of the adult.
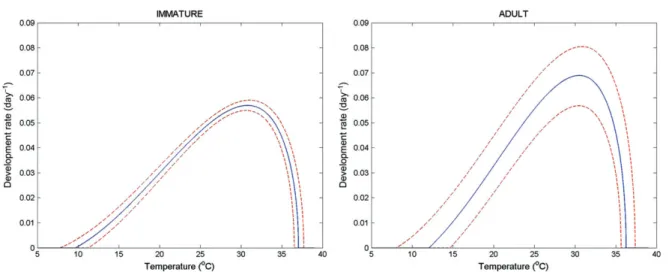
The MATLAB tool nlintool for non-linear fitting and predic-tion makes it possible to obtain the 95% confidence bands for the estimated curves on the basis of published data on devel-oped rate (development period−1) at different temperatures.
Con-fidence bands are useful when considering the effect of experi-mental heterogeneity in the model. The 95% confidence bands are reported in Fig. A1 for immature and adult development rate functions.
Mortality rate function
A finite survival rate function of the polynomial type
sur (T) = p1T 2
1619
Figure A1. Estimated development rate curves (continuous lines, in day−1) as a function of temperature (in ∘C) with 95% confidence bands (dotted lines)for immature (left) and adult (right).
Table A2. Parameters of the survival rate function for immature and adult
p1 p2 p3
Immature −0.002194 0.0997 −0.4587
Adult −0.003227 0.1549 −1.3541
is considered, where p1, p2and p3are constants that have to be
estimated. The temperature-dependent mortality rate function is given by 𝜇 (T) = ⎧ ⎪ ⎨ ⎪ ⎩
−𝜎 (T) · log [sur (T)] forT ∈[Tinf, Tsup
] −𝜎(Tinf
)
· log[sur(Tinf
)]
(Tinf− T + 1) for T< Tinf
−𝜎(Tsup
)
· log[sur(Tsup
)]
(T − Tsup+ 1) for T> Tsup
where𝜎(T) is the development rate function described above. The mortality rate function is defined piecewise. In the interval between the two development thresholds [Tinf, Tsup], the definition
depends on the development rate function. Outside this interval, the mortality rate is a function that increases as the temperature increases (for T> Tsup) or decreases (for T< Tinf).
Owing to the density dependence regulation, the mortality has a further term depending on the number of individuals when the population abundance is greater than the threshold of 100 individuals. The temperature- and density-dependent mortality rate function m(T) is defined as follows:
m (T)=0.03+
{
𝜇 (T) if N (t)≤ 100
𝜇 (T) {0.6 log [N (t) − 100 + 1] + 1} if N (t) > 100
where N(t) is the total population at time t per spatial unit (single plant).
The survival rate functions for immature and adult were esti-mated by fitting all the data reported in the literature using the nlinfit MATLAB function. The best fit of immature and adult survival was obtained using the values of parameters of survival function indicated in Table A2. For immature Tinf= 10, Tsup= 37.049, for
adults Tinf= 12.4, Tsup= 36.259.
The 95% confidence bands for immature and adult survival functions are obtained using MATLAB nlintool. Survival curves (continuous lines) with 95% confidence bands are reported in Fig. A2.
Fecundity rate function
The number of eggs per female is represented by the function15
fec (T) =𝛼 max [ 1 − ( T − Tmin− Tmid Tmid )2 , 0 ]
where𝛼, Tminand Tmidare constants that have to be estimated.
By fitting all the data from the literature by means of the nlinfit MATLAB function, the parameters in Table A3 are obtained.
MATLAB nlintool makes it possible to obtain the 95% confidence bands for the estimated fecundity presented in Fig. A3.
Appendix 3
Hourly temperature reconstruction
Starting from the WORLDCLIM database of monthly maximum and minimum temperature averages, hourly temperatures have been reconstructed.
The algorithm used for reconstruction is based on the equation published in de Wit.89As a first step, the daily maximum and
mini-mum temperatures have been obtained, fitting the monthly max-imum and minmax-imum temperatures by a third-order polynomial.
Denote by Tminand Tmaxthe minimum and the maximum
tem-peratures of the current day, by Tmax−1the maximum temperature
of the previous day, and by Tmin−1the minimum temperature of the
next day. Let hlev be the time of sunrise. The temperature at hour
h is given by89 T (h) = ⎧ ⎪ ⎪ ⎨ ⎪ ⎪ ⎩ Tmax−1+Tmin 2 + Tmax−1−Tmin 2 cos [ 𝜋(h+10) hlev+10 ] 0≤ h < hlev Tmax+Tmin 2 − Tmax−Tmin 2 cos [ 𝜋(h−hlev) 14−hlev ] hlev≤ h < 14 Tmax+Tmin+1 2 + Tmax−Tmin+1 2 cos [ 𝜋(h−14) hlev+10 ] 14≤ h < 24
1620
Figure A2. Estimated survival rate curves (continuous lines) as a function of temperature (in ∘C) with 95% confidence bands (dotted lines) for immature
(left) and adult (right).
Table A3. Parameters of the fecundity rate functions
𝛼 Tmin(∘C) Tmid(∘C)
143.53 13.42 11.11
Figure A3. Estimated fecundity rate curve (continuous lines, in eggs
female−1day−1) as a function of temperature (in ∘C) with 95% confidence
bands (dotted lines).
It is assumed that the maximum temperature occurs at 2:00 p.m., and the minimum temperature at sunrise.
APPENDIX 4
Exploration of climatic scenarios
Climate scenarios are frequently used for the analysis of biological and ecological system responses to change in environmental forcing variables. Nonetheless, projections carried out by GCMs are subject to inaccuracies of different kinds. Maslin and Austin90
signalled a paradox arising from continuous increasing climate
model complexity (more equations and parameters that describe processes). This feature brings increasing uncertainties in model projections. Regional downscaling emphasises uncertainties on the local scale, and model outputs sometimes give very different indications.
Hence, to avoid the uncertainties resulting from these inaccura-cies, the present authors adopted a simpler approach based on a systematic perturbation of time series of temperature to analyse the responses of the B. tabaci population dynamics model to tem-perature change.
The climate models outputs (used to generate climate scenarios) have been verified by the IPCC (IPCC, 2007: http://www.ipcc.ch/publications_and_data/ar4/wg1/en/ ch8s8-1 -2-1.html) and by researchers from other research institutions and organisations. Results of these verifications show that climate model outputs do not provide a deterministic forecast, but rather only a probabilistic range of values of meteorological driving variables (IPCC 2007, IPCC-TGICA, 2007: http://www.ipcc-data.org/ guidelines/TGICA_guidance_sdciaa_v2_final.pdf ).
The verification of climate models for the last 150 years, per-formed by Anagnostopoulos et al.,91found uncertainties in mean
values and standard deviation of yearly mean temperatures. In par-ticular, the interannual fluctuations of temperature are strongly smoothed in climate models with respect to the observations. The uncertainties on temperature (mean and standard deviation) are low on the global scale, but errors increase at the continental or lower scale.75
The highlighted uncertainties in climate model outputs strongly affect the possibility of obtaining reliable scenarios on future spa-tial and temporal patterns of temperature for the purpose of the analysis of B. tabaci population dynamics in response to tempera-ture change. The sensitivity analysis of B. tabaci population dynam-ics to temperature performed here is based on a perturbation approach in which the forcing variable (temperature) is perturbed by adding 1 and 2 ∘C to calculated hourly temperature. The ther-mal perturbation is considered for a 20 year timescale.
The worst-case scenario, a temperature perturbation of +2 ∘C, is the outcome of an analysis of the last 50 years of Euro-pean climate. In particular, from second half of the 1980s, the Euro-Mediterranean area has been affected by an abrupt climatic change due to a trajectory reconfiguration of the westerlies. On a
1621
macro scale, this phenomenon has been highlighted by the strongpositive values of the NAO index (North Atlantic Oscillation), beginning in the second half of the 1980s.92–94Moreover, the
his-torical recurrence of phases with persistent positive NAO values in the last millennium has also been highlighted by means of suit-able paleoclimatic proxies.95This change in circulation caused an
abrupt increase of +1 ∘C in yearly mean temperature (1988–2010) relative to the 1973–1987 period.96 On a lower spatial scale
(regional) and during the spring period, the thermal anomaly rose to 2 ∘C. On the basis of this evidence, it was assumed that a similar kind of circulation change might happen in the next 20 years.
Another important point supporting the choice of +2 ∘C as the temperature perturbation is the consistency of this value with climate projections. The major part of these projections is based on increased concentrations of greenhouse gases on a long timescale. An increase in temperature in the range 1.4–5.8 ∘C by the year 2100 has been obtained for a stable CO2increase (IPCC,
2007), or 1.5–4.5 ∘C for a doubling of atmospheric CO2
concen-tration (otherwise known as the ‘equilibrium climate sensitivity’, see IPCC-TGICA, 2007). These projections are referred to a very long timespan, and hence the results cannot be interpolated for a period of 20 years.
A valid support to +2 ∘C as the temperature perturbation is obtained from short-term climate projections referred to Europe. For example, the chosen perturbation is consistent with a projection provided by the PESETA Project (http://peseta. jrc.ec.europa.eu/docs/ClimateModel.html). This project considers change in thermal and rainfall patterns from 2010 to 2040. Projec-tions have been obtained from the model RCA3/ECHAM5 of the Danish Meteorological Institute [project PRUDENCE: Prediction of Regional scenarios and Uncertainties for Defining European Climate change Risks and Effects (http://prudence.dmi.dk/)]. The PESETA Project estimates a rise in temperature of +3 ∘C in 30 years for summer temperatures in most of the southern Euro-pean regions, and an increase of +2 ∘C for most of the northern European regions.
According to the above historical evidence, and relating to the European climate scenario, the decision of +2 ∘C perturbation seems to be a representative description of possible extreme thermal increase in Europe over the next 20 years. For the purpose of the analysis of B. tabaci population dynamics responses to temperature change, this can be considered to be the climate worst-case scenario.
REFERENCES
1 Boykin LM, Shatters RG, Rosell RC, McKenzie CL, Bagnall RA, De Barro P et al, Global relationships of Bemisia tabaci (Hemiptera: Aleyrodidae) revealed using Bayesian analysis of mitochondrial COI DNA sequences. Mol Phylogenet Evol 44:1306–1319 (2007). 2 De Barro PJ, Liu SS, Boykin LM and Dinsdale AB, Bemisia tabaci: a
statement of species status. Annu Rev Entomol 56:1–19 (2011). 3 Dinsdale A, Cook L, Riginos C, Buckley YM and De Barro P, Refined
global analysis of Bemisia tabaci (Hemiptera: Sternorrhyncha: Aley-rodoidea: Aleyrodidae) mitochondrial cytochrome oxidase 1 to identify species level genetic boundaries. Ann Entomol Soc Am
103:196–208 (2010).
4 Alemandri V, De Barro P, Bejerman N, Arguello Caro EB, Dumon AD, Mattio MF et al, Species within the Bemisia tabaci (Hemiptera: Aleyrodidae) complex in soybean and bean crops in Argentina. J
Econ Entom 105:48–53 (2012).
5 Hu J, De Barro P, Zhao H, Wang J, Nardi F and Liu SS, An extensive field survey combined with a phylogenetic analysis reveals rapid and widespread invasion of two alien whiteflies in China. PloS ONE
6:e16061 (2011).
6 Legg JP and Fauquet CM, Cassava mosaic geminiviruses in Africa. Plant
Mol Biol 56:585–599 (2004).
7 Navas-Castillo J, Fiallo-Olive E and Sanchez-Campos S, Emerging virus diseases transmitted by whiteflies. Annu Rev Phytopathol
49:219–248 (2011).
8 Varma A and Malathi VG, Emerging geminivirus problems: a serious threat to crop production. Ann Appl Biol 142:145–164 (2003). 9 EFSA Panel on Plant Health (PLH), scientific opinion on the risks to
plant health posed by Bemisia tabaci species complex and viruses it transmits for the EU territory. EFSA J 11(4):3162 (2013). [Online]. Available: http://www.efsa.europa.eu/it/efsajournal/pub/3162.htm [18 September 2013].
10 Naranjo SE, Castle SJ, De Barro PJ and Liu SS, Population dynamics, demography, dispersal and spread of Bemisia tabaci, in Bemisia:
Bionomics and Management of a Global Pest, ed. by Stansly PA and
Naranjo SE. Springer, Dordrecht, The Netherlands, pp. 185–226 (2010).
11 Elith J and Leathwick JR, Species distribution models: ecological expla-nation and prediction across space and time. Annu Rev Ecol Syst
40:677–697 (2009).
12 Gutierrez AP, Ponti L and Gilioli G, Climate change effects on plant–pest–natural enemy interactions, in Handbook of Climate
Change and Agroecosystems: Impacts, Adaptation, and Mitigation,
ed. by Hillel D and Rosenzweig C. World Scientific Publishing, Singapore, pp. 209–237 (2010).
13 Gilioli G and Mariani L, Sensitivity of Anopheles gambiae popula-tion dynamics to meteo-hydrological variability: a mechanistic approach. Malar J 10:294 (2011).
14 Gutierrez AP and Ponti L, Analysis of invasive plants and insects: links to climate change, in Invasive Species and Climate Change, ed. by Ziska
LH and Dukes JS. CABI Publishing, Wallingford, Oxon, UK (2012).
15 Gutierrez AP, Ponti L, Cooper M, Gilioli G, Baumgärtner J and Duso C, Prospective analysis of the invasive potential of the European grapevine moth (Lobesia botrana (Den. & Schiff.)) in California. Agric
For Entomol 14(3):225–238 (2012).
16 Gutierrez AP and Ponti L, Eradication of invasive species: why the biology matters. Environ Entomol 42(3):395–411 (2013).
17 Gutierrez AP, Applied Population Ecology: a Supply–Demand Approach. John Wiley & Sons, Inc., New York, NY (1996).
18 Curry GL and Feldman RM, Mathematical Foundations of Population
Dynamics. Texas A&M University Press, College Station, TX (1987).
19 Metz JAJ and Diekmann EO (eds), The Dynamics of Physiologically Structured Populations. Springer, Berlin/Heidelberg/New York (1989).
20 Di Cola G, Gilioli G and Baumgartner J, Mathematical models for age structured population dynamics, in Ecological Entomology, ed. by Huffaker CB and Gutierrez AP. John Wiley & Sons, Inc., New York, NY, pp. 503–534 (1999).
21 Buffoni G and Pasquali S, Structured population dynamics: continuous size and discontinuous stage structures. J Math Biol 54:555–595 (2007).
22 Bayhan E, Ulusoy M and Brown J, Effects of different cucurbit species and temperature on selected life history traits of the ‘B’ biotype of
Bemisia tabaci. Phytoparasitica 34:235–242 (2006).
23 Bonato O, Lurette A, Vidal C and Fargues J, Modelling temperature-dependent bionomics of Bemisia tabaci (Q-biotype).
Physiol Entomol 32:50–55 (2007).
24 Brewster CC, Allen JC, Schuster DJ and Stansly PA, Simulating the dynamics of Bemisia argentifolii (Homoptera, Aleyrodidae) in an organic cropping system with a spatiotemporal model. Environ
Entomol 26:603–616 (1997).
25 Chen YM, Chen CN and Chen SW, Population parameters of the silverleaf whitefly (Bemisia argentifolii Bellows and Perring) on four legume cultivars. Formosan Entomol 23:249–261 (2003).
26 Crowder DW, Carriere Y, Tabashnik BE, Ellsworth PC and Dennehy TJ, Modeling evolution of resistance to pyriproxyfen by the sweetpotato whitefly (Homoptera, Aleyrodidae). J Econ Entomol
99:1396–1406 (2006).
27 De Barro PJ, Bourne A, Khan SA and Brancatini VAL, Host plant and biotype density interactions – their role in the establishment of the invasive B biotype of Bemisia tabaci. Biol Invasions 8:287–294 (2006). 28 Delatte H, Duyck PF, Triboire A, David P, Becker N, Bonato O et al, Differential invasion success among biotypes: case of Bemisia tabaci.
1622
29 Deschamps C and Bonato O, Survie de Bemisia tabaci (Homoptera, Aleyrodidae) aux conditions hivernales de la zone nord méditer-ranée. Ann Soc Entomol France 47:340–343 (2011).
30 Elbaz M, Weiser M and Morin S, Asymmetry in thermal tolerance trade offs between the B and Q sibling species of Bemisia tabaci (Hemiptera, Aleyrodidae). J Evol Biol 24:1099–1109 (2011). 31 Gergis MF, Population growth and life table analysis of whiteflies in
relation to temperature and host plants, in Proc Beltwide Cotton Conf
2:1229–1230 (1994).
32 Gonzalez-Zamora JE and Moreno R, Model selection and averaging in the estimation of population parameters of Bemisia tabaci (Genna-dius) from stage frequency data in sweet pepper plants. J Pest Sci
84:165–177 (2011).
33 Guo XJ, Rao Q, Zhang F, Luo C, Zhang HY and Gao XW, Diversity and genetic differentiation of the whitefly Bemisia tabaci species complex in China based on mtCOI and cDNA-AFLP analysis. J Integr
Agric 11:206–214 (2012).
34 Iida H, Kitamura T and Honda K, Comparison of egg hatching rate, sur-vival rate and development time of the immature stage between B and Q biotypes of Bemisia tabaci (Gennadius) (Homoptera, Aleyro-didae) on various agricultural crops. Appl Entomol Zool 44:267–273 (2009).
35 Kakimoto K, Inoue H, Yamaguchi T, Ueda S, Honda K and Yano E, Host plant effect on development and reproduction of Bemisia
argentifolii Bellows et Perring (B. tabaci [Gennadius] B-biotype)
(Homoptera, Aleyrodidae). Appl Entomol Zool 42:63–70 (2007). 36 Li XX, Li SJ, Xue X, Ahmed MZ, Ren SX, Cuthbertson AGS et al, The
effects of space dimension and temperature on the cross mating of three cryptic species of the Bemisia tabaci complex in China. J Integr
Agric 11:197–205 (2012).
37 Mansaray A and Sundufu AJ, Oviposition, development and survivor-ship of the sweet potato whitefly Bemisia tabaci on soybean, Glycine
max, and the garden bean, Phaseolus vulgaris. J Insect Sci 9:1–6
(2009).
38 Muñiz M and Nombela G, Differential variation in development of the B and Q biotypes of Bemisia tabaci (Homoptera, Aleyrodi-dae) on sweet pepper at constant temperatures. Environ Entomol
30:720–727 (2001).
39 Musa PD and Ren SX, Development and reproduction of Bemisia
tabaci (Homoptera, Aleyrodidae) on three bean species. Insect Sci
12:25–30 (2005).
40 Nava-Camberos U, Riley DG and Harris MK, Temperature and host plant effects on development, survival, and fecundity of Bemisia
argentifolii (Homoptera, Aleyrodidae). Environ Entomol 30:55–63
(2001).
41 Naranjo SE and Ellsworth PC, Mortality dynamics and population regulation in Bemisia tabaci. Entomol Exp Appl 116:93–108 (2005). 42 Naranjo SE and Ellsworth PC, Fifty years of the integrated control
con-cept: moving the model and implementation forward in Arizona.
Pest Manag Sci 65:1267–1286 (2009).
43 Oriani de Godoi MA, Vendramim JD and Vasconcelos CJ, Biology of Bemisia tabaci (Genn.) B biotype (Hemiptera, Aleyrodidae) on tomato genotypes. Sci Agric 68:37–41 (2011).
44 Pascual S and Callejas C, Intra and interspecific competition between biotypes B and Q of Bemisia tabaci (Hemiptera, Aleyrodidae) from Spain. Bull Entomol Res 94:369–375 (2004).
45 Qiu YT, Van Lenteren JC, Drost YC and Posthuma-Doodeman CJAM, Life history parameters of Encarsia formosa, Eretmocerus
eremi-cus and E. mundus, aphelinid parasitoids of Bemisia argentifolii
(Hemiptera, Aleyrodidae). Eur J Entomol 101:83–94 (2004). 46 Tsai JH and Wang KH, Development and reproduction of Bemisia
argentifolii (Homoptera, Aleyrodidae) on five host plants. Environ Entomol 25:810–816 (1996).
47 Tsueda H and Tsuchida K, Reproductive differences between Q and B whiteflies, Bemisia tabaci, on three host plants and negative interactions in mixed cohorts. Entomol Exp Applic 141:197–207 (2011).
48 Wagner TL, Temperature-dependent development, mortality, and adult size of sweet potato whitefly biotype B (Homoptera, Aleyro-didae) on cotton. Environ Entomol 24:1179–1188 (1995).
49 Walker GP, Perring TM and Freeman TP, Life history, functional anatomy, feeding and mating behaviour, in Bemisia: Bionomics and
Management of a Global Pest, ed. by Stansly PA and Naranjo SE.
Springer, Dordrecht, The Netherlands, pp. 109–160 (2010).
50 Yang TC and Chi H, Life tables and development of Bemisia argentifolii (Homoptera, Aleyrodidae) at different temperatures. J Econ Entomol
99:691–698 (2006).
51 Xie M, Wan FH, Chen YH and Wu G, Effects of temperature on the growth and reproduction characteristics of Bemisia tabaci B biotype and Trialeurodes vaporariorum. J Appl Entomol 135:252–257 (2011). 52 Zang LS and Liu SS, A comparative study on mating behaviour between the B biotype and a non-B biotype of Bemisia tabaci (Hemiptera, Aleyrodidae) from Zhejiang, China. J Insect Behav
20:157–171 (2007).
53 Hijmans RJ, Cameron SE, Parra JL, Jones PG and Jarvis A, Very high resolution interpolated climate surfaces for global land areas. Int J
Climatol 25:1965–1978 (2005).
54 Bayhan E, Ulusoy MR and Brown JK, Host range, distribution, and nat-ural enemies of Bemisia tabaci ‘B biotype’ (Hemiptera: Aleyrodidae) in Turkey. J Pest Sci 79:233–240 (2006).
55 Cavalieri V and Rapisada C, Indagini molecolari sui biotipi di Bemisia
tabaci in Sicilia (Hemiptera, Aleyrodidae) [Molecular investigation
on Bemisia tabaci biotypes in Sicily (Hemiptera, Aleyrodidae)]. Boll
Zool Agr Bachic 40:145–154 (2008).
56 Dalmon A, Halkett F, Granier M and Peterschmitt M, Limited but per-sistent genetic differentiation among biotype Q of Bemisia tabaci, the only biotype detected in protected crops in Southern France. J
Insect Sci 8:15–16 (2008).
57 De Barro PJ, Trueman JW and Frohlich DR, Bemisia argentifolii is a race of B. tabaci (Hemiptera: Aleyrodidae): the molecular genetic differ-entiation of B. tabaci populations around the world. Bull Entomol Res
95:193–203 (2005).
58 De la Rua P, Simon B, Cifuentes D, Martinez-Mora C and Cenis JL, New insights into the mitochondrial phylogeny of the whitefly Bemisia
tabaci (Hemiptera: Aleyrodidae) in the Mediterranean Basin. J Zool Syst Evol Res 44:25–33 (2006).
59 Delatte H, Reynaud B, Granier M, Thornary L, Lett J, Goldbach R et al, A new silverleaf inducing biotype Ms of Bemisia tabaci (Hemiptera, Aleyrodidae) indigenous to the islands of the south west Indian Ocean. Bull Entomol Res 95:29–35 (2005).
60 Demichelis S, Arnò C, Bosco D, Marian D and Caciagli P, Characteriza-tion of biotype T of Bemisia tabaci associated with Euphorbia
chara-cias in Sicily. Phytoparasitica 33:196–208 (2005).
61 Erdogan C, Moores GD, Gurkan MO, Gorman KJ and Denholm I, Insec-ticide resistance and biotype status of populations of the tobacco whitefly Bemisia tabaci (Hemiptera: Aleyrodidae) from Turkey. Crop
Prot 27:600–605 (2008).
62 Guirao P, Onillon JC, Beitia F and Cenis JL, Présence en France du biotype B de Bemisia tabaci. Phytoma 498:44–48 (1997).
63 Lopes A, Whiteflies on tomato crops in Portugal. OEPP/EPPO Bull
32:7–10 (2002).
64 Moya A, Guirao P, Cifuentes D, Beitia F and Cenis JL, Genetic diversity of Iberian populations of Bemisia tabaci (Hemiptera: Aleyrodidae) based on random amplified polymorphic DNA-polymerase chain reaction. Mol Ecol 10:891–897 (2001).
65 Ostojic I, Zovko M, Petrovic D and Sabljo A, Tobacco whitefly Bemisia
tabaci (Gennadius): a new pest in Bosnia and Herzegovina. Rad Poljoprivred Fak Univ Sarajevu 55:113–121 (2010).
66 Papayiannis LC, Brown JK, Hadjistylli M and Katis NI, Bemisia tabaci biotype B associated with tomato yellow leaf curl disease epidemics on Rhodes Island, Greece. Phytoparasitica 36:20–22 (2008). 67 Parrella G, Scassillo L and Giorgini M, Evidence for a new genetic variant
in the Bemisia tabaci species complex and the prevalence of the biotype Q in southern Italy. J Pest Sci 85:227–238 (2012).
68 Saleh D, Structuration génétique des populations de l’aleurode (Bemisia
tabaci): importance du biotype, de l’origine géographique et de la
plante-hôte chez un complexe d’espèces phytophages. Rapport de Master, Montpellier, France (2008).
69 Tsagkarakou A, Mouton L, Kristoffersen JB, Dokianakis E, Grispou M and Bourtzis K, Population genetic structure and secondary endosymbionts of Q Bemisia tabaci (Hemiptera: Aleyrodidae) from Greece. Bull Entomol Res 102:353–365 (2012).
70 Tsagkarakou A, Tsigenopoulos CS, Gorman K, Lagnel J and Bedford ID, Biotype status and genetic polymorphism of the whitefly Bemisia
tabaci (Hemiptera: Aleyrodidae) in Greece: mitochondrial DNA and
microsatellites. Bull Entomol Res 97:29–40 (2007).
71 Vassiliou VA, Jagge C, Grispou M, Pietrantonio PV and Tsagkarakou A, Biotype status of Bemisia tabaci from various crops in Cyprus.
1623
72 Villevieille M and Lecoq H, Silver leaf of courgette. A new disease in France associated with an aleyrode. Phytoma 440:35–36 (1992). 73 Žani´c K, Cenis JL, Simón B and Kacic S, Current status of Bemisia tabaci
in Croatia. Proc 3rd Int Bemisia Workshop, Barcelona, Spain, p. 43 (2003).
74 Žani´c K, Kaˇci´c S and Katalini´c M, Duhanov štitasti moljac Bemisia tabaci (Gennadius, 1889), (Homoptera, Aleyrodidae) u Hrvatskoj. Entomol
Croatica 5:51–63 (2001).
75 Koutsoyiannis D, Efstratiadis A, Mamassis N and Christofides A, On the credibility of climate predictions. Hydrol Sci J 53:671–684 (2008). 76 Holman IP, Tascone D and Hess TM, A comparison of stochastic
and deterministic downscaling methods for modelling potential groundwater recharge under climate change in East Anglia, UK: implications for groundwater resource management. Hydrogeol J
17:1629–1641 (2007).
77 Katz RW, Techniques for estimating uncertainty in climate change scenarios and impact studies. Climate Res 20:167–185 (2002). 78 von Arx R, Baumgärtner J and Delucchi V, A model to stimulate the
population dynamics of Bemisia tabaci (Genn.) (Stern. Aleyrodidae) on cotton in the Sudan Gezira. Z Angew Entomol 96:341–363 (1983). 79 DeGrandi-Hoffman G and Naranjo SE, Biocontrol – whitefly: a whitefly, parasite, and predator population dynamics model, in Silverleaf
Whitefly (Formerly Sweetpotato Whitefly, Strain B): 1996 Supplement to the 5-Year National Research and Action Plan, USDA Agric. Res. Serv.,
1996–01, p. 3 (1996).
80 Wilhoit L, Schoenig S, Supkoff D and Johnson BA, A regional simulation model for silverleaf whitefly in the Imperial Valley. PM 94–01, California, Pest Management Analysis and Planning Program, 109 pp. (1994).
81 Zalom FG, Natwick ET and Toscano NC, Temperature regulation of
Bemisia tabaci (Homoptera: Aleyrodidae) populations in Imperial
Valley cotton. J Econ Entomol 78:61–64 (1985).
82 Mills NJ and Gutierrez AP, Prospective modeling in biological control: an analysis of the dynamics of heteronomous hyperparasitism in a cotton–whitefly–parasitoid system. J Appl Ecol 33:1379–1394 (1996).
83 Muniz M, Development of the B-biotype of Bemisia tabaci (Gennadius, 1889) (Homoptera: Aleyrodidae) on three varieties of pepper at constant temperatures. Bol Sanid Veg Plagas 26:605–617 (2000).
84 Yadav DK and Singh SK, Forecast model of major insect pests of mung bean. Ann Plant Prot Sci 14:323–328 (2006).
85 Gard TC, Introduction to Stochastic Differential Equations. Marcel Dekker, New York, NY (1988).
86 Hoppensteadt F, Mathematical Theories of Populations: Demographics,
Genetics and Epidemics. SIAM, Philadelphia, PA (1995).
87 Kontodimas DC, Eliopoulos PA, Stathas GJ and Economou LP, Com-parative temperature-dependent development of Nephus includens (Kirsch) and Nephus bisignatus (Boheman) (Coleoptera, Coccinelli-dae) preying on Planococcus citri (Risso) (Homoptera, Pseudococ-cidae): evaluation of a linear and various nonlinear models using specific criteria. Environ Entomol 33:1–11 (2004).
88 Brière JF, Pracros P, Le Roux AY and Pierre JS, A novel rate model of temperature-dependent development for arthropods. Environ
Entomol 28:22–29 (1999).
89 de Wit CT, Simulation of Assimilation, Respiration and Transpiration of
Crops. Pudoc, Wageningen, The Netherlands (1978).
90 Maslin M and Austin P, Uncertainty: climate models at their limit?
Nature 486:183–184 (2012).
91 Anagnostopoulos GG, Koutsoyiannis D, Christofides A, Efstratiadis A and Mamassis N, A comparison of local and aggregated climate model outputs with observed data. Hydrol Sci J 55:1094–1110 (2010).
92 Hurrell JW, Decadal trends in the North Atlantic Oscillation: regional temperatures and precipitation. Science 269:676–679 (1995). 93 Werner PC, Gerstengarbe FW, Fraedrich K and Oesterle K, Recent
climate change in the North Atlantic European sector. Int J Climatol
20:463–471 (2000).
94 Scheifinger H, Menzel A, Koch E, Peter C and Ahas R, Atmospheric mechanisms governing the spatial and temporal variability of phe-nological phases in central Europe. Int J Climatol 22:1739–1755 (2002).
95 Trouet V, Esper J, Graham NE, Baker A, Scourse JD and Frank DC, Persistent positive North Atlantic oscillation mode dominated the Medieval climate anomaly. Science 324:78–80 (2009).
96 Mariani L, Parisi SG, Cola G and Failla O, Climate change in Europe and effects on thermal resources for crops. Int J Biometeorol