Service deregulation, competition and
the performance of French and Italian firms*
Francesco Daveri Rémy Lecat Maria Laura Parisi
Università di Parma,
Banque de France Università di Brescia
and CESifo
Abstract
This paper estimates the impact of service regulation reform on the productivity of French and Italian firms in 1998-2007. We find that entry barriers lower firm productivity by raising mark-ups and rents, while they do not appear to directly affect productivity if not through the mark-up channel. Our results are based on two-stage least squares estimates implying that, if French and Italian firms had adopted the OECD best practices in terms of entry barriers, their TFP level would have increased by some five percentage points. We found no robust evidence of a non-linear relation between mark-up and productivity.
Keywords: regulation, services, performance, TFP, productivity JEL codes: D24, K20, L51, O40, O57
* This work is part of a research project on “Regulation and firm performance” funded by the Fondation Banque de France. We would like to thank, without implicating, Davide Castellani, Gilbert Cette, Emanuela Ciapanna, Francesca Lotti, Paul Maarek, Jacques Mairesse, Francesco Nucci, Ottavio Ricchi, Alfonso Rosolia, Cyrille Schwellnus and seminar participants in the OECD-Banque de France workshop on “Structural reforms, crisis exit strategies and growth”, T2M conference in Lyon, the XII EWEPA Conference in Verona, and the II Economic Governance and Innovation Conference at the University of Greenwich as well as in internal seminars at the Banque de France, the Bank of Italy and Italy’s Ministry of the Economy (Department of the Treasury) for their very useful comments on an earlier draft. We are very grateful to Gilbert Cette for encouraging our collaboration. Our warm thanks also go to our very dedicated research assistants, Jocelyn Boussard and Alessia Savoldi.
1. Introduction
The OECD policy makers who slashed regulatory barriers in many countries over the thirty years preceding the current crisis acted under the assumption that lower regulation allows firms to achieve a better economic performance. The policy stance in favour of deregulation has generally been supported by a large body of literature pointing to negative effects of entry barriers, red-tape or legal requirements on economic performance, notably firm productivity. Yet, while considerable effort has been devoted to the search for significant correlation, less attention has gone to spell out the details of the transmission mechanism through which the relation between regulation and firm productivity is expected to materialize.
Our paper lies in this area of empirical research. However, rather than concentrating the attention on a broad cross-section of countries and on deregulation as such, we study the details of this process looking at one specific - but in our view crucial - aspect of deregulation, the reduction of entry barriers in the service industries in two regulation-riddled countries, France and Italy.
As of 1998, both countries posted the highest values (behind Greece) for the Product Market Regulation (PMR) index constructed by OECD. Since then, extensive deregulation of professional business activities, network industries and retail have been implemented in both countries, although in a scattered fashion across industries and over time. This process has occurred with special emphasis on the entry barriers’ side to which we devote our attention. In our paper, we exploit this country-industry variation building time-varying qualitative variables that summarize the change in entry barriers for retail, road freight, airlines, post, telecommunications and business services. We contrast the variation of regulation in such diverse industries over 1998-2007 with firm-level variation in the behavior of total factor productivity, the most commonly accepted - though by no means perfect - measure of efficiency. If deregulation is aimed to be efficiency enhancing, it should positively affect total factor productivity. And indeed this is what Nickell (1996), Blundell, Griffith and van Reenen (1999) and Griffith, Harrison and Simpson (2010) found: a negative relation between regulation and productivity. This also stems from the results of
Schivardi and Viviano (2011) where barriers to entry in the Italian retail sector had been found to be positively related to profit margins and negatively to productivity.
Yet a full-fledged empirical analysis of the efficiency effects of regulation may and perhaps should go beyond and ask why and how the correlation is there. To tackle such identification issues we look at the mark-up as an intermediate variable. Regulation is bad for a firm, in the first place, if it reduces competitive pressures, giving rise to rents. As long as rents are associated to managerial slack and other inefficiencies, a measure of rent, such as the mark-up, is expected to bear a negative correlation with firm’s observed productivity. Following previous research in this field (Griffith, Harrison and Simpson, 2010; Ospina and Schiffbauer, 2010), we test this idea through a two-step procedure. First we look at whether changes in barriers to entry have impacted the mark-up of firms in the industry where reform took place and in the expected direction (lower entry barriers bringing about a diminished scope for rent). In the second stage, we ask whether the induced changes in mark-up, originated from lower barriers, have translated into TFP changes. This is not obvious. Within the so called neo-Schumpeterian approach, as documented by Aghion, Bloom, Blundell, Griffith and Howitt (2005), the empirical relation between the mark up and efficiency indicators most directly related to innovation, resembles an inverted U shape. We test the relationship between entry barriers, mark-up and productivity using a two-stage least square estimation strategy on a panel of French and Italian firms, with barriers to entry as an instrument for mark-up in the first stage and mark-mark-up as a determinant of total factor productivity (TFP) in the second stage. All in all, our results indicate that barriers to entry in France and Italy are linearly associated to higher mark-ups and lower total factor productivity, with an overall impact of barriers to entry on productivity stronger in France than in Italy. This effect appears to be 1.5 higher in the long run than in the short run. The relationship holds true for small and large firms as well as in retail firms - which make about two thirds of our data set. Overall, our results withstand changes of specification, changes of instruments and exclusion of specific observations.
The paper is structured as follows. Section 2 sums up the relations between our research questions and findings and the literature on regulation, productivity and growth. In section 3, we describe our empirical
strategy. In section 4, we describe our data set and indicators. In section 5, our main results and robustness checks are presented and discussed. Section 6 concludes.
2. Background discussion on regulation and efficiency
As discussed in Schiantarelli (2010), the negative relation between regulation and efficiency stems from first principles. When regulatory reforms lead to more competitive output markets, the wedge between prices and marginal costs is reduced and the allocation of goods and resources, in the absence of other distortions, becomes more efficient in a static sense, due to the pressure triggered by fiercer competition onto individual firms. Additional efficiency gains may originate through economies of scale and scope. Over time, a more competitive climate will also drive the less efficient firms to exit and, through this channel, market shares will shift from lower to higher productivity firms, leading to a more efficient factor allocation in the industry. Yet, as discussed by Nickell, Nicolitsas, and Dryden (1997), the details of the transmission mechanism through which competition raises efficiency are not always clear-cut. Altogether, on the theory side, there are sufficient ambiguities or caveats that empirical research in this area is essential to reach definite conclusions about the impact of product market regulation.
On the empirical side, there is an established tradition of firm and industry studies investigating the direct effects of regulation on the performance of firms in the regulated sectors. Sector-specific restrictions, such as those prevailing in utilities and services, are shown to decrease productivity growth (Nicoletti and Scarpetta, 2003), investment (Alesina, Ardagna, Nicoletti and Schiantarelli, 2005) and employment (Bertrand and Kramartz, 2002), as well as to increase prices (Martin, Roma and Vansteenkiste, 2005) in the regulated sectors. Of particular relevance for our analysis, Nickell (1996) used firm-level data for the UK to investigate whether changes in competition affect productivity levels and growth rates. In this study, competition was measured in several ways, including industry level measures of monopoly rents, concentration, import penetration, and number of competitors. By estimating a dynamic production function, Nickell found that greater competition has a positive effect both on the level and the growth of
productivity.1 The results in Nickell have been confirmed by Disney, Haskel, and Heden (2000), with a bigger UK data set.
Apart from the direct effects on the firms within the same industry where the regulatory measure is enacted, regulation may also have relevant indirect effects on resource allocation in downstream industries. Barone and Cingano (2011) and Bourles, Cette, Lopez, Mairesse and Nicoletti (2010) - with some methodological differences - have employed input-output matrices to construct indicators of dependence of downstream activities (typically manufacturing) on upstream industries (typically services). They were thus able to study how regulation in the supply of a variety of services (energy and utilities, professional services) affects the economic performance of downstream manufacturing industries. Their results indicate that the indirect costs of regulation are the bulk of the costs of regulation. Our analysis is narrower in scope and therefore we cannot calculate these second-round effects. Yet, by specifically addressing one aspect of regulation, our study can keep track of the transmission mechanism through which regulation affects performance.
The elusiveness of the competition-efficiency relation has also to do with measurement and specification issues. Investigating the impact of deregulation on economic performance may be problematic for, as discussed by Winston (1993), regulation is inherently multidimensional. It involves pricing, entry and exit decisions within an industry as well as health and safety of workplaces and products, and the accuracy of the information disseminated about products. Different bits of deregulation may be successful in one respect and less in others. Different bits may be collinear with each other, thereby making the task of identifying the effect of each bit, separately, a daunting one. Griffith and Harrison (2004, Table 30-33) showed that the estimates of coefficients of electricity, gas and water supply are heavily specification-dependent in industries’ employment and productivity regressions.
1 In Nickell’s paper, firm-level variables are instrumented within a dynamic panel GMM approach while competition variables are not. However, if fast-growing firms gain market shares, the market becomes more concentrated and less competitive. Hence this may cause a downward bias to the estimates of the effect of competition on productivity. In this case, the estimated effect represents a lower bound on the true effect of competition on productivity.
Finally, while the expected correlation between the extent of regulation and the mark up is relatively clear-cut and positive in most cases, the expected sign of the relation between mark-up and economic performance is more ambiguous. Lower mark-ups may indeed be associated to better economic performance but only if the static efficiency gains more than offset the fixed costs of research and innovation, enabled by the extra profits originating in a close-to-monopoly setting. Within the so called Neo-Schumpeterian tradition (Aghion and Howitt (1998), Aghion, Bloom, Blundell, Griffith and Howitt (2005)), the relation between competition and productivity turns out to take an inverted U shape, because of the interplay between the “escape competition” and “Schumpeterian” effects. When regulation is high, more competition through lower mark-ups fosters innovation, as firms are encouraged to innovate in order to escape competition. As competition becomes fiercer and average profits decrease, the benefits from catching-up diminish for laggards, which are then discouraged from the fact that convergence has largely taken place. Hence, from a certain degree of competition, the latter effect dominates the former and the relation becomes negative. This effect is more likely to be observed for innovation-related variables but it may be there for productivity as well. Askenazy, Cahn and Irac (2013) showed that the quadratic relationship between competition and R&D held mostly for large firms, while the relationship was largely linear for smaller firms.
3. Empirical strategy
To analyze the relationship between (de)regulation and firm productivity, we use a two-stage estimation strategy. In the first stage we investigate whether changes in regulation has changed the mark-up of firms in the industry where reform took place, and in the expected direction (in most cases, deregulation bringing about less rent). In the second stage, we test whether the induced changes in mark-up, originating from diminished barriers to entry, have translated into TFP changes.
We model the efficiency-competition relation as a second stage, i.e. the relation between TFP and mark-up. In equation (1) we assume that productivity is related to rents as measured by the mark-up, as well as to controls, according to the following log-linear dynamic specification:
(1)
where TFP indicates the level of total factor productivity, µ is the mark-up, DS is a demand shifter at the firm level (the growth rate of turnover at current prices), btc is a matrix of country-year dummies, hi is a
vector of firm specific fixed effects, and the i, c, j and t subscripts indicate – respectively - firm, country, industry and time. Finally, is an idiosyncratic shock to productivity. Equation (1) says that TFP depends on the level of competition, persistence, a demand shifter (firm turnover/sales at current prices), country-year and firm fixed effects.
A problem with equation (1) is the potential correlation between the mark-up and the error term: if more productive firms exhibit higher mark-up, this would lead to simultaneity bias. To make up for this, following previous research in this field (Griffith, Harrison and Simpson, 2010; Ospina and Schiffbauer, 2010), a first stage equation relating the mark-up to the index of product market regulation (PMR) and other variables is estimated. We retrieve the predicted value of the mark-up and use it in the second stage. In some previous studies (such as Griffith and Harrison (2008) and Griffith, Harrison and Simpson, 2010) the exclusion of the indicator of entry barriers from the second stage is an identifying assumption. We rather use it as a starting point and test for its empirical validity by comparing how second stage results vary with and without entry barriers.
An issue raised by equation (1) is that the mark-up is unlikely to be the only determinant of TFP in a country, industry or firm. Factors such as infrastructure, skills, and technological opportunity may play a substantive role. TFP is usually affected by unmeasured factor utilization (Cette, Dromel, Lecat and Paret, forthcoming). The lack of consideration of these elements would lead to omitted variables bias. Unmeasured factor utilization is proxied by firm-level demand shifters DS. We use country by year dummies b to account for the influence of country-specific macroeconomic fluctuations. Firm-specific fixed effects capture residual time-independent heterogeneity in firm size, geographic location, industry or unobserved management quality. Finally, given that competition acts only gradually over time by altering market structure and firm behavior, we also include a lagged value of TFP to allow persistence on TFP. In
ijtc i tc ijtc c ijt ijtc ijtc TFP DS b TFP =
b
0 +b
1µ
+d
1ln -1 +d
2 + +h
+e
lne
turn, given that by construction - as is always the case in linear dynamic panel-data models - unobserved fixed effects are correlated with the lagged dependent variable, we will estimate the parameters by the consistent GMM. Competition may also act by forcing unproductive firms to exit and allowing new firms to enter, as predicted through the allocative efficiency effect discussed in section 2. Yet our sample do not embody information on whether a firm enters/exits the market or the databases.
The first stage of our model is as follows:
(2)
The mark-up is assumed to be a linear function of a specific PMR indicator (barriers to entry, BAR, whose rationale and main features are discussed in the data section). This instrument is sector specific, as well as time and country-varying. Hence, we need to correct the standard errors of the estimates for clustering at the sector level (Moulton, 1990). We also include country–time effects, btc, to control for unobservables
that may be correlated with product market reforms, as well as unobserved firm fixed effects. Finally, to control for mark-up pro-cyclicality, we also append the demand shifter DS as we did for the TFP equation, to control for firm-specific cyclicality.
Our parameter of interest is l1 the coefficient of the BAR variable. The inclusion of industry–time and
country–time effects means that l1 is identified using differential variation over time within countries,
industries and firms. If product market reforms (lower BAR) are associated with increased competition (i.e., lower average rents) we would expect l1 to be positive. The implicit assumption is that the expected
effects of changes in BAR are exogenously influencing rents. To account for reverse causation effects on the estimated coefficient of BAR (lagging behind firms being protected by high barriers to entry), in the robustness checks we append lagged employment and TFP as control variables to equation (2).
The list of excluded instruments encompasses lagged BAR, third lag of turnover, firm age, lag of the first difference of employment, while the endogenous variables to be instrumented are the mark-up, the demand shifter and lagged TFP. The lag of turnover instruments changes in turnover like Anderson and Hsiao (1982); firm age captures learning-by-doing and firm development process, instruments of
lagged-ijtc i tc ijtc c jt ijtc =
l
BAR - +l
DS +b +a
+uµ
1 1 2TFP; lag of the first difference of employment captures changes in factor level, again for lagged-TFP, and it captures shifts in demand to instrument changes in turnover. We run the Sargan-Hansen tests to verify the validity of these instruments, which is never rejected by the test results.
Note that, being excluded from the second stage, in our baseline specification BAR affects TFP only through the mark-up, not directly. This implies that the full-fledged (impact + delayed) effect of liberalizing entry on productivity can be computed by combining the estimated coefficients from the first and the second stage. We test this assumption in two ways. First, we allow for an alternative specification where BAR enters directly into the second stage. Second, we also implement C-test of endogeneity of excluded instruments. It runs out that the impact of BAR is crucially intermediated by the mark-up.
4. Data and indicators
4.1 Data
We use firm level annual data on France and Italy in 1998-2007, to derive the productivity indicator (TFP) and other factors. We merged data from FiBEn for French firms, constructed by Banque de France, and AIDA for Italian firms, a Bureau van Dijk database. Both databases contain individual accounts, balance sheet items provided by firms to the tax administration. FiBEn includes most French firms with sales exceeding €750,000 per year or credit outstanding of at least €380,000; hence its coverage is excellent for large firms but rather limited for small firms. AIDA has a better coverage of small firms, with no minimum limit for sales, but only for limited companies and limited liability companies. Our period of analysis is long enough to include a few regulatory policy changes taking place in both countries. We use the OECD Product Market Regulation (PMR) database to derive the barrier-to-entry indicator.
Firms belong to nine service sectors that include retail, freight road and passenger air transportation, post, telecommunications and professional services (see Table 1). In these sectors there are barriers to entry due to regulatory constraints. In the other sectors of the economy, regulatory barriers to entry are estimated to be non-existent by the OECD over the estimation period. This by no means implies overall absence of barriers to entry: sectors, particularly the manufacturing ones, may in fact face other kind of barriers to
entry due to strategic behavior of competitors or a very high minimum scale of production to reach a break-even point (natural monopoly case). Yet these barriers are largely unrelated to policy and are thus outside the domain of this work.
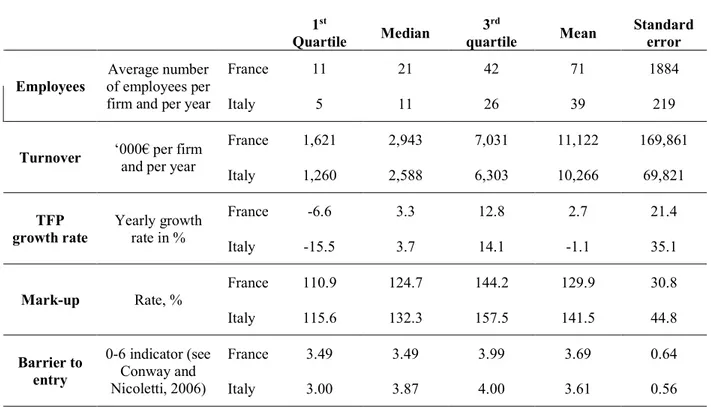
The main descriptive statistics for the database are presented in Table 1. The upper panel (Table 1.1) shows that Italy’s AIDA is a larger database, with 15 070 service firms over the 1998-2007 period, against 13 349 firms for FiBEn over the same period of time. The two datasets are rather similar in their industry composition. More than 90 per cent of the firms in both datasets are from just three sectors: retail (some two thirds of the total in each sample), road freight transports (some 20 per cent of the total) and accounting services (about 5 per cent). As to the other business services, a bigger share of engineering and consultancy services in France is by and large offset by a bigger share of architectural services in Italy. In order to control for these differences, we use fixed effect estimators and country-year dummies.
Table 1.1 also shows firm size distribution. Eighty per cent of the firms in the AIDA sample are small firms, i.e. employing less than twenty employees. In France this share is slightly above one half of the total. This is partly the result of a database bias (the French database under-estimates the share of small firms as said) but it also reflects the actual underlying size distribution in the two countries.
4.2 Total Factor Productivity
AIDA and FiBEn allow to calculate firm-level value added (Q), capital (K) and employment (L). These are the ingredients in our output variable, TFP.
Value added (Q) is computed as sales of merchandise minus its cost, less the change in inventory, plus the amount of production sold (goods and services) and stocked, plus the amount of production incorporated in the capital stock, less the cost of raw materials, the change in raw-material inventories, and the other costs and external charges (including wages of external workers) plus net-of-tax production subsidies.2 The volume of value added is obtained dividing Q by a national account index of value added price at the
two-digit industry level. As we do not have prices at the firm level, we may wrongly measure - and thus misinterpret - an increase in the firm’s relative price of output with an increase in firm’s productivity; our control for changes in turnover should however limit this bias.
The initial total capital stock is estimated as deflated gross value of all non-financial assets. Gross capital at historical price is divided by a national index for investment price, lagged by the average age of gross capital (itself calculated from the share of depreciated capital over gross capital at historical prices). The average employment level (L) is directly available in FiBEn and AIDA, while data for hours worked or workers employed through Temporary Work Agencies are not provided. Our data include workers on fixed-term contracts as long as they are hired by the firm, not by an Agency. For France, data on costs of using temporary work agencies are available. A correction of employment on the basis of an average wage showed a very limited impact of temporary workers on TFP.
With these data we derive a measure of total factor productivity (TFP). When evaluating the consequences of deregulation, employing a productivity concept that is invariant to the intensity of observable factor inputs is advisable. Ours comes from a growth accounting methodology within a Cobb-Douglas framework, with factor shares equal to the share in revenue and constant returns to scale. We do test these assumptions in the robustness check part, where labor and capital parameters are allowed to vary freely without constraining them under constant returns to scale. Our main results do not change.
This growth accounting methodology is however the best choice for our specification. First, parameter estimation methodologies are not totally reliable in this context. As emphasized by Griliches and Mairesse (1998), parameter estimates for capital will be biased downwards due to attenuation bias. In the robustness check (Table 8, column 5), we estimate capital and labor coefficients at the sector level according to the preferred Griliches and Mairesse specification (OLS in level) and find slightly decreasing returns to scale, which can be attributed to attenuation bias.
The alternative methodology of Olley and Pakes (1996) would not be feasible in our framework for it implies restricting the analysis to those firms with non-zero investment flows. Levinsohn and Petrin (2003) use intermediate inputs as a proxy for unobserved productivity shocks. However, the use of
intermediate inputs is not appropriate in our service sector database: for most of the sectors that we cover (accounting, legal, architecture, engineering) intermediate inputs represent only a small share of turnover3 and are weakly correlated to production given that sales in professional services may change with no change to their intermediate inputs. Hence, the monotonicity condition required by Levinsohn and Petrin is not fulfilled for these sectors.4 As a result, this methodology leads to very low returns to scale and even negative capital coefficients in some sectors.
Nonetheless, assuming constant returns to scale for the computation of TFP may lead to bias the coefficient of the mark-up in equation (1). Following Griffith, Harrison, and Macartney (2007) and Buccirossi, Ciari, Duso, Spagnolo and Vitale (2013), mark-ups and returns to scale should be positively correlated. Hence, the difference between constant returns to scale TFP and actual TFP, i.e. the measurement bias in TFP, is positively correlated with the mark-up. This creates an upward bias in the estimated coefficient b1 in equation (1). If this estimate is significantly negative, as we expect, despite this
upward bias, the negative relationship between rents and TFP would be well established.
Table 1.2 shows that the turnover of Italian firms is on average about 10% lower than the turnover of French firms, consistently with higher frequency of small firms in AIDA. The median Italian firm exhibits a faster TFP growth than the median French firm, but the dispersion is larger, as can be expected from smaller firms. These differences are partly controlled for by firm fixed effects and country-year dummies.
4.3 Regulation
The Appendix describes competition indicators in detail. We built two main variables: barriers to entry, as a regulatory indicator, and mark-up which, in line with some previous studies, we take as the main channel through which regulatory impediments to competition impact productivity.
The extent of market openness in each sector is captured by our PMR index. Barriers to entry are industry-wide indicators derived from the OECD Product Market Regulation database. For each of the two
3 In our sample, intermediates represent 71% of turnover, but only 33% in the accounting sector and 38% in the legal sector. 4 The correlation between changes in value added and intermediate consumption is only .33.
countries, we built this indicator on the basis of the OECD Regulatory Indicators methodology, detailed in Wöelfl, Wanner, Kozluk and Nicoletti (2009). We use Conway and Nicoletti (2006) to derive barrier to entry indicators for retail, professional services (legal, accounting, engineering, and architecture professions) and network industries (telecoms, post, air passenger transport, and road freight).5 The OECD officially releases a non-manufacturing index (NMR), that can be divided into three sub-indicators: (1) Energy, transport and communication (ETRC); (2) Retail distribution and business services (RBSR); (3) Regulatory impact (RI). Being interested in ETRC and RBSR, we used all available information and legislation sources to update these indicators for each year in the interval 1998-2007. Out of the three available indicators of sector-specific PMR (barriers to entry, public ownership, price controls), we kept Barriers to Entry as our index to instrument the mark-up. We took directly the OECD indicators when available in the period of analysis (1998-2007), while filling the blanks when the indicator was missing. The sectors were selected based on the availability of non-zero indexes of regulatory barriers to entry. For information not available through the OECD, we referred to official legislation, documents and publications of the appropriate Department or Regulation Authority, the Antitrust Authority in Italy, associations (for professional services, we referred to professional registers), the Bank of Italy, the appropriate European DG, the MICREF database and OECD. We used the same questions and weights to compute the low level indicator for each sector separately, rather than the average for all sectors as in OECD.
4.4 Mark-up
Barriers to entry as such are not enough to hamper the productivity performance of purchasing firms, unless the high barriers translate into high mark-ups. This is why we constructed firm-level measures of average mark-ups, following previous studies (Nickell, 1996, Aghion et alii, 2005 and Griffith et alii, 2010). They are computed as follows:
5 The OECD list of network industries would also include electricity, gas and rail. We left them out for we had too few observations for these industries.
Mark-up =
where “capital costs” are computed multiplying a measure of the net rate of returns – the interest rates on ten-year Government bonds - times the sum of capital stock and inventories. The mark-ups computed like this are somewhat higher on average in Italy than in France. The extreme values for all the main variables
are cleaned using Tukey’s method, as recommended by Kremp (1995).6
5. Results
5.1 Baseline regressions
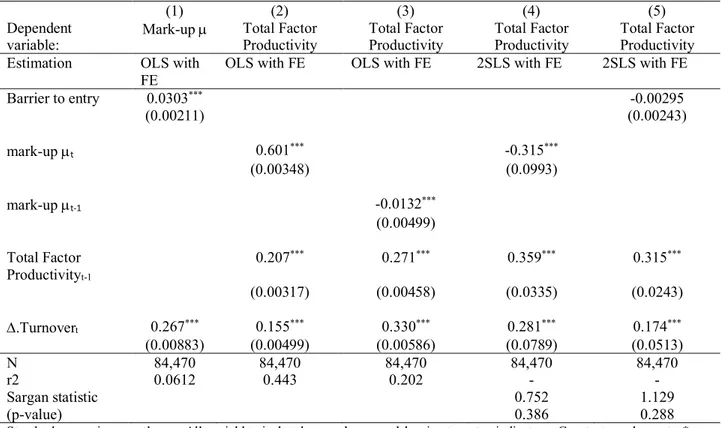
We start reporting the first stage results. Table 2 (column 1) shows that mark-up levels positively depend on the level of barriers to entry: this is consistent with the idea that barriers to entry protect the incumbents and make them benefit from rents. The demand shifter variable is also - as expected - positively correlated to mark-ups. The barriers-to-entry coefficient is strongly statistically significant and not too far from 0.03. Hence the impact of barriers to entry on mark-ups is large, at least for some industries: a 5-point decrease in entry barriers – i.e. the actual decline in the indicator for Telecom in France over the 1995-2007 period - would chop off more than 15 percentage points in the mark-up.
The second stage results for the TFP equation (1) are reported in column (2-4) of Table 2: the OLS results in column 2 and 3, the 2SLS results in column 4. The mark-up coefficient is positive in column 2, when introduced contemporaneously to TFP. This could be expected as both measures are strongly pro-cyclical and potentially endogenous. However, if the mark-up is lagged in order to limit this simultaneity bias (as in Disney, Haskel and Heden, 2003), its coefficient turns negative (column 3).
We devote most of our comments to the 2SLS results. Column 4 reports the 2SLS results, where the mark-up is instrumented to explicitly control for endogeneity. The list of instruments includes the entry barrier indicator, third lag of turnover, the lagged first-differenced employment and firm age. All tests show that
6 I.e. removing those firms whose value in logs of a variable is greater than the third quartile plus three times the inter-quartile gap or is less than the first quartile minus three times the inter-quartile gap.
Costs
Capital
Costs
Labor
Added
Value
+
=
µ
we have strong and valid instruments for the equation and, as shown in the next section, results are robust to changes in instruments, specifications and exclusion of outliers.
The lagged dependent variable - log TFPt-1 - is statistically significant and fairly sizable. The point-wise
estimate is around 0.35. This result indicates that the short-run and long-run correlation of mark up (and entry barriers) with TFP are different: based on our estimates, the long-run effects of PMR (and other exogenous variables) are 1.5 times bigger than their impact effects. Yet, given that the estimated coefficient is markedly lower than one, we also find that such effects are not too persistent. This result is consistent with a well-known finding from the applied growth literature (see Barro, 2012): controlling for fixed effects in a panel regression (as we do) raises the speed of convergence. In our regressions, the
convergence parameter (one minus the estimated d1) is negative 0.65, which implies a very fast speed of
convergence.
As expected, the demand shift has a positive impact on TFP, as greater use of capacity is not fully captured in our measure of TFP.
As to our main variable of interest, the level of mark-up is negatively correlated with TFP. This is consistent with the results in Nickell (1996), Blundell, Griffith and van Reenen (1999) and Griffith, Harrison and Simpson (2010). The point-wise estimate for the mark-up is negative (-0.315). When multiplied by +0.03 (the average coefficient of entry barriers on the mark-up), this would give an estimated effect of entry barriers on TFP of -0.01 in the short run and -0.015 in the long-run. This is a sizable effect: if both countries were to adopt OECD best practices for service sector regulations, this would increase TFP in services by 5 per cent in France and 4.5 per cent in Italy. This effect may be seen as a lower bound. Our estimates in fact suffer from an upward bias due to the constant returns to scale assumption for TFP (cf. section 4.2). Moreover, our inability to observe entry and exit of firms prevents us from capturing the allocative efficiency gains stemming from the effect of lower barriers to entry on the entry of more productive firms in the market and the exit of the unproductive ones.
It should also be pointed out that our results in column 4 take into account the impact of barriers to entry on productivity only indirectly, namely through the mark-up. The reduction of barriers to entry could
instead have a direct effect on TFP over and above the mark-up pass-through, for example by enabling shareholders to better monitor the performance of managers (Holmström, 1982). However, as shown in column (5), the coefficient of barriers to entry when directly plugged into the second-stage is not significant. Moreover, the C-tests of individual instrument validity (cf. section 5.6 and Table 7) confirm the exogeneity of barriers to entry. Hence, we conclude that the mark-up seems to intermediate the statistical bulk of the impact of barriers to entry on productivity. This also confirms that our results in column (4) can be regarded as plausible.
Finally, our preferred baseline specification takes a linear shape. This may not be the case, as suggested, e.g. in Aghion, Bloom, Griffith and Howitt (2005), where a theoretical and empirical case for a quadratic specification is made. In our specification we could not identify correctly and separately the linear and the quadratic terms, and the results (not reported here, but available upon requests) were very fragile. This may be because, as discussed by Askenazy, Cahn and Irac (2013) with reference to the French case, the quadratic relationship between competition and R&D mostly hold for large firms (where R&D plays a bigger role), while the relationship is linear for smaller firms, where R&D is less likely to play a role. Moreover R&D may be less important for the service industries which represent our object of study for they rely less on R&D than manufacturing firms.
In the end, we retain a linear specification as our preferred one. As shown in what follows, this specification appears highly robust to changes of specifications.
5.2 Country heterogeneity
In Table 3, we allow BAR and mark-up slopes to differ between the two countries. The BAR estimate for France is larger than the Italian one: 0.03 versus 0.02. This is partly due to a size composition effect of the two databases as discussed in section 4.1, and that BAR coefficient is significantly larger for 250 employees or above (section 5.3 and Table 4).
The estimated slopes of the second stage appear, as well, not to be equal in the two countries. The mark-up coefficient is bigger - in absolute value - for Italy than France: -0.9 versus -0.25. We conjecture that
firms in Italy, when faced with stringent regulation, may divert a bigger fraction of their value added into the black market. Taking these estimates at face value, one can obtain the short-run and the long-run impact of entry barriers on TFP. The long-run effect of a one-point increase in BAR amounts to a TFP variation of -2.9% for Italy and -1.4% for France.
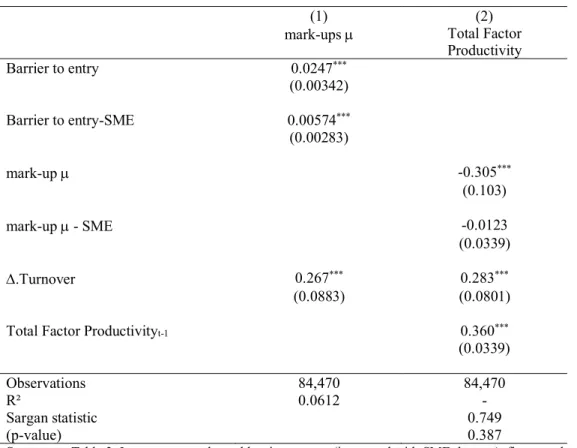
5.3 Size heterogeneity
In Table 4, we let the slopes differ according to firm size. Small and medium-sized enterprises (SMEs), traditionally defined as firms with less than 250 employees, may have a different sensitivity to competition and regulation, although it is hard to determine theoretically in which direction. Bankruptcy is more threatening for small firms, making them more sensitive to the impact of competition (Nickel et alii, 1997); on the other hand, small firms suffer less from manager-shareholders agency problems as there is a larger proportion of small firms owned by their managers (Hölmstrom, 1982). Our results reflect this balanced theoretical analysis: BAR tends to have a larger impact on mark-up for SMEs, although the difference is not very large; no significant effect is found of mark-up on TFP for SMEs.
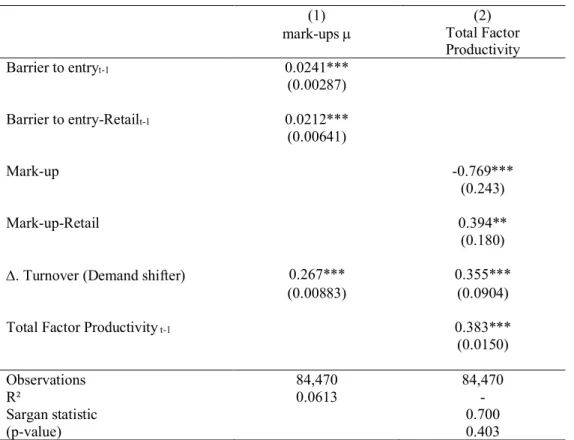
5.4 Industry heterogeneity: Retail sector evidence
Our analysis includes a set of qualitatively diverse industries, ranging from utilities to retail and professional services. Retail firms represent two thirds of our sample. In order to test whether the estimates hold true for this sector in some special way, we add a Retail sector dummy interacted with BAR in equation (2) and with mark-up in equation (1). A statistically significant interaction term would imply that firms in the retail sector display a different elasticity from the rest of the sample. The results are presented in Table 5.
For the first stage, the retail sector mark-up is significantly more sensitive to barriers than other sectors: a one-point decrease in Retail barrier to entry leads to 4.5 percentage points decrease in mark-up, compared to 2.5 points elsewhere. This result is quite appealing given that entering Retail has lower fixed cost compared to other sectors (in particular network industries). Entry is easier when regulatory barriers are
lifted. In the second stage, up has a significantly lower impact on TFP: a one-point increase in mark-up leads to a 0.37% decrease in TFP in the retail sector against 0.77% elsewhere. However, the overall impact of a one point fall in BAR on TFP is not significantly different between retail firms and others.
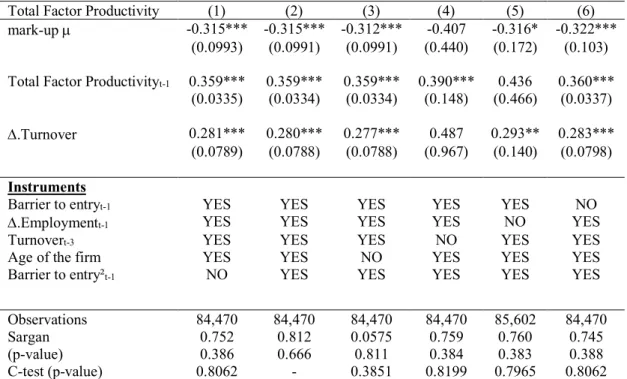
5.5 More robustness checks
We perform a number of additional robustness checks. First, we test for robustness to the exclusion of specific observations (Table 6). Column 1 presents the reference regression. Column 2 presents the regression removing the top and bottom 10% highest sector-year decile of TFP. Columns 3-8 show estimates removing one by one the sectors representing more than 2% of the total observations. Coefficient signs and significance appear robust to all of these exclusions. The mark-up coefficient is stronger when removing the top and bottom 10%, which is a particularly good sign of robustness. The second set of robustness checks concerns the choice of the instruments (Table 7). In the reference result (column 1), the excluded instruments are BAR, lagged differenced employment, third lag of turnover and firm age. In order to test for the robustness of this instrumentation, we first remove sequentially our instruments and replace them with the square of BAR (column 3-6). The results are robust to removing all instruments, although the mark-up estimate is not significant when removing turnover, although the Sargan test remains valid. A difference-in-Sargan or C-test is conducted to check the validity of instruments individually. They turn out to be exogenous, in particular BAR, which supports the hypothesis of an intermediated impact of regulation on TFP through the mark-up.
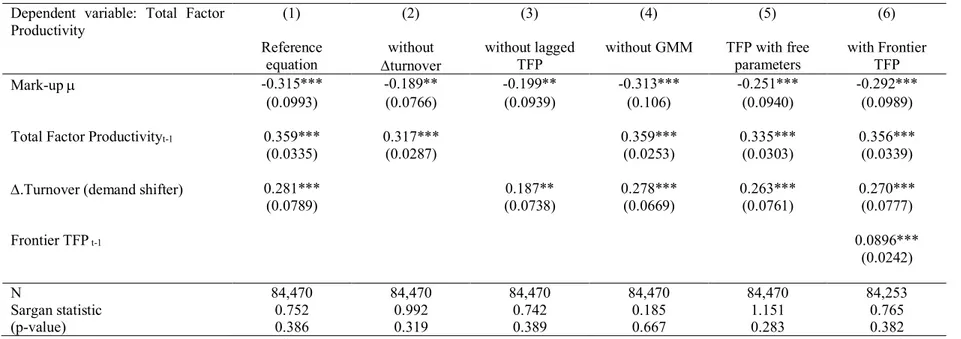
Finally, we test robustness to changes in specification and estimation methods (Table 8). We first remove the demand-shifter (turnover) and the lagged dependent variable (columns 2 and 3). The mark-up coefficient remains negative and significant, although it is lower. The within-group estimator barely affects the results, as shown in column 4. Then we change the way we compute TFP, by freeing the capital and labor coefficients by sector and allowing non-constant returns to scale. This is not our preferred formulation, though, as discussed in section 4.2. The coefficient of mark-up is barely changed by the use of these “free parameters”. In line with Aghion et alii (2009), we introduce a distance to frontier variable,
based on mean TFP of the last sector-year decile of TFP. This variable is positive as expected and significant, and the mark-up coefficient is significant and similar to the one estimated in the baseline equation. We conclude that our benchmark specification withstands most, although not all, the sensitivity and robustness analyses. Our preferred linear formulation appears to be robustly estimated.
6. Conclusions
In this paper we have studied the relationship between one specific type of regulation, namely barriers to entry, and total factor productivity of firms in the same industry where regulation is present. We find a negative relation: entry barriers are associated to higher mark-up, which in turn is negatively correlated to productivity. The estimated competition-productivity relation appears to be crucially intermediated by the firm mark-up. Our results indicate that the effect of entry barriers is smaller (by about 1.5 times) in the short-run than in the long-run. If both countries were to adopt OECD best practice for services regulation, their long-run productivity in these sectors would increase by 5 per cent in France and 4.5 per cent in Italy. Whether the partial correlation between our variables of interest is the result of a quadratic specification - measuring the so called “Aghion effect” – remains an objective of further research. The latter effect is more likely to materialize in high-tech industries, where the “escape competition” effect is plausible, rather than in the service industries we are looking at here. And it is also more likely to be important for variables measuring innovation efforts such as R&D and productivity growth, as opposed to productivity levels.
References
Aghion P. and P. Howitt (1998), “Market Structure and the Growth Process,” Review of Economic
Dynamics, January, vol.1(1), 276-305
Aghion P., Bloom N., Blundell R., Griffith R. and P. Howitt (2005), “Competition and innovation: an inverted U relationship,” Quarterly Journal of Economics, vol.120(2), May, 701-728.
Aghion P., Askenazy, P., Bourlès, R., Cette, G. and N. Dromel (2009), “Education, market rigidities and growth,” Economics Letters, Elsevier, vol.102(1), January, 62-65
Alesina A., Ardagna S., Nicoletti G. and F. Schiantarelli (2005), “Regulation and Investment,” Journal of
the European Economic Association, MIT Press, vol. 3(4), 791-825
Anderson T. W. and Hsiao, C. (1982), “Formulation and estimation of dynamic models using panel data,”
Journal of Econometrics, vol. 18(1), January, 47-82
Askenazy P., Cahn C. and D. Irac (2013), “Competition, R&D, and the Cost of Innovation: Evidence for France,” Oxford Economic Papers, April, vol.65(2), 293-311
Barone G. and F. Cingano (2011), “Service Regulation and Growth: Evidence from OECD Countries,”
Economic Journal, September, vol.121(555), 931-57
Barro R. (2012), “Convergence and modernization revisited”, Harvard University, mimeo, August
Bertrand M. and F. Kramartz (2002), “Does Entry Regulation Hinder Job Creation? Evidence From The French Retail Industry,” Quarterly Journal of Economics, vol.117(4), 1369-1413
Blundell R., Griffith R. and J. Van Reenen (1999), “Market Share, Market Value and Innovation in a Panel of British Manufacturing Firms,” Review of Economic Studies, vol.66, 529-554
Bourlès R., Cette G., Lopez J., Mairesse J. and G. Nicoletti (2010), “The Impact on Growth of Easing Regulation in Upstream Sectors,” CESifo DICE Report, vol.8(3), 8-12, October
Buccirossi P., Ciari L., Duso T., Spagnolo G., and C. Vitale (2013), “Competition Policy and Productivity Growth: An Empirical Assessment,” Review of Economics and Statistics, vol. 95(4), 1324-1336 Cette G., Dromel N., Lecat R. and A.C. Paret (forthcoming), “Production factor returns: the role of factor
utilization,” Review of Economics and Statistics
Conway P. and G. Nicoletti (2006), “Product Market Regulation in the Non-Manufacturing Sectors of OECD Countries: Measurement and Highlights,” OECD Economics Department WP n. 530 Daveri F. and M.L. Parisi (2010), “Experience, Innovation and Productivity: Empirical Evidence from
Italy’s Slowdown,” CESifo Working Paper n. 3123, July
Disney R., Haskel J. and Y. Heden (2003), “Restructuring and productivity growth in UK manufacturing,”
Economic Journal, vol.113(489), 666-694
Griffith R. and R. Harrison (2004), “The link between product market reform and macro-economic performance,” European Commission Economic Papers n. 209, August
Griffith R., Harrison R. and G. Macartney (2007), “Product Market Reforms, Labor Market Institutions and Unemployment,” Economic Journal, vol.117(519), C142-166
Griffith R., Harrison R. and H. Simpson (2010), “Product Market Reform and Innovation in the EU,”
Scandinavian Journal of Economics, vol.112(2), 389-415
Griliches, Z. and Mairesse, J. (1998), “Production Function: The Search for Identification,” in S. Strøm (ed.), The Ragnar Frisch Centennial Symposium, Cambridge University Press, 169–203
Kremp E. (1995), “Nettoyage de fichiers dans le cas de données individuelles. Recherche de la cohérence transversal,” Economie et prévision, 171–193
Levinsohn J. and A. Petrin (2003), “Estimating Production Functions Using Inputs to Control for Unobservables,” The Review of Economic Studies, vol.70(2), April, 317-341
Martin R., Roma M. and I. Vansteenkiste (2005), “Regulatory Reforms in Selected EU Network Industries,” ECB Occasional Papers Series, n. 28
Moulton R. B. (1990), “An illustration of a pitfall in estimating the effects of aggregate variables on micro units,” Review of Economics and Statistics, vol.72(2), 334-338
Nickell S. J. (1996), “Competition and corporate performance,” Journal of Political Economy, vol.104(4), 724-46
Nickell S., Nicolitsas D. and N. Dryden (1997), “What makes firms perform well?” European Economic
Review, April, vol.41(3-5), 783-96
Nicoletti G. and S. Scarpetta (2003), “Regulation, productivity and growth: OECD evidence,” Economic
Policy, 1-45
OECD (1996), “International trade in professional services: Assessing Barriers and Encouraging Reform,” OECD, Paris
Olley S. and A. Pakes (1996), “The Dynamics Of Productivity In The Telecommunications Equipment Industry,” Econometrica, vol.64, 1263-1297
Ospina S. and M. Schiffbauer (2010), “Competition and Firm Productivity: Evidence from Firm-Level Data,” IMF Working Papers 10/67
Schiantarelli F. (2010), “Product Market Regulation and Macroeconomic Performance: A Review of Cross Country Evidence,” Business Regulation and Economic Performance, 23-63
Schivardi F. and E. Viviano (2011), “Entry Barriers in Retail Trade,” Economic Journal, 145-170, March Wöelfl A., Wanner I., Kozluk T. and G. Nicoletti (2009), “Ten years of product market reforms in OECD
Table 1 – Descriptive statistics
Table 1.2 Main variable statistics
1st
Quartile Median 3
rd
quartile Mean Standard error Employees
Average number of employees per firm and per year
France 11 21 42 71 1884
Italy 5 11 26 39 219
Turnover ‘000€ per firm and per year
France 1,621 2,943 7,031 11,122 169,861
Italy 1,260 2,588 6,303 10,266 69,821
TFP
growth rate Yearly growth rate in %
France -6.6 3.3 12.8 2.7 21.4
Italy -15.5 3.7 14.1 -1.1 35.1
Mark-up Rate, % France 110.9 124.7 144.2 129.9 30.8
Italy 115.6 132.3 157.5 141.5 44.8 Barrier to entry 0-6 indicator (see Conway and Nicoletti, 2006) France 3.49 3.49 3.99 3.69 0.64 Italy 3.00 3.87 4.00 3.61 0.56
Table 1.1 Database statistics FiBEn AIDA
Number of firms 13 349 15 070
Size (number of employees)
0-20 51% 80%
20-50 34% 12%
50-250 13% 7%
250 and more 2% 1%
Sectoral composition
Retail trade, except of motor vehicles and motorcycles 67,1% 68,2% Freight transport by road 21,5% 20,4% Passenger air transport 0,1% 0,1% Postal and courier activities 0,1% 0,4%
Telecommunications 0,0% 1,0%
Legal activities 0,3% 0,1%
Accounting, bookkeeping and auditing activities; tax consultancy 5,2% 5,1% Architectural activities 0,5% 1,2% Engineering activities and related technical consultancy 5,0% 3,4%
Table 2 – Baseline regressions
(1) (2) (3) (4) (5)
Dependent
variable: Mark-up µ Total Factor Productivity Total Factor Productivity Total Factor Productivity Total Factor Productivity Estimation OLS with
FE
OLS with FE OLS with FE 2SLS with FE 2SLS with FE
Barrier to entry 0.0303*** -0.00295 (0.00211) (0.00243) mark-up µt 0.601*** -0.315*** (0.00348) (0.0993) mark-up µt-1 -0.0132*** (0.00499) Total Factor Productivityt-1 0.207*** 0.271*** 0.359*** 0.315*** (0.00317) (0.00458) (0.0335) (0.0243) D.Turnovert 0.267*** 0.155*** 0.330*** 0.281*** 0.174*** (0.00883) (0.00499) (0.00586) (0.0789) (0.0513) N 84,470 84,470 84,470 84,470 84,470 r2 0.0612 0.443 0.202 - - Sargan statistic 0.752 1.129 (p-value) 0.386 0.288
Standard errors in parentheses. All variables in log but mark-ups and barrier to entry indicators. Constants and country*year dummies are included. Column (1): Fixed effect estimates with clustering by sector. Column (2) and (3): Fixed effects estimates. Column (4) and (5): estimation by two-stage least square, GMM estimators, robust standard errors and individual fixed effects. For column (4), instruments include lagged barrier to entry, firm age, lag of the first difference of employment, third lag of turnover; for column (5), same instruments but barriers to entry. First-step estimates’ F tests indicate that instruments are strongly significant. Sargan-Hansen tests of over-identification do not reject the null hypothesis of orthogonality of instruments. Hausman test rejects the null hypothesis of exogeneity of mark-ups. * p < 0.1, ** p < 0.05, *** p < 0.01.
Table 3 – Country heterogeneity
(1) (2)
mark-ups µ Total Factor Productivity Barrier to entry-France 0.0333*** (0.00211) Barrier to entry-Italy 0.0181*** (0.00552) mark-up µ - France -0.247* (0.129) mark-up µ - Italy -0.940*** (0.315) D.Turnover 0.269*** 0.327*** (0.0088) (0.0946)
Total Factor Productivityt-1 0.405***
(0.0558)
Observations 84,217 84,217
R² 0.0626
Sargan statistic 0.799
(p-value) 0.371
See note to Table 1. Columns (1): Fixed effect estimates with clustering by sector. Column (2): Estimation by two-stage least square, with GMM estimators, robust standard errors and individual fixed effects. Instruments are lagged barrier to entry, firm age, lag of the first difference of employment, third lag of turnover, lagged differenced mark-up (interacted with country dummy). First-step estimates’ F tests indicate that instruments are strongly significant. Hausman test rejects the null hypothesis of exogeneity of mark-ups. * p < 0.1, ** p < 0.05, *** p < 0.01.
Table 4 – Size heterogeneity: Small and medium enterprises - SME (<250 employees)
(1) (2)
mark-ups µ Total Factor Productivity Barrier to entry 0.0247*** (0.00342) Barrier to entry-SME 0.00574*** (0.00283) mark-up µ -0.305*** (0.103) mark-up µ - SME -0.0123 (0.0339) D.Turnover 0.267*** 0.283*** (0.0883) (0.0801)
Total Factor Productivityt-1 0.360***
(0.0339)
Observations 84,470 84,470
R² 0.0612 -
Sargan statistic 0.749
(p-value) 0.387
See note to Table 3. Instruments are lagged barrier to entry (interacted with SME dummy), firm age, lag of the first difference of employment, third lag of turnover. First-step estimates’ F tests indicate that instruments are strongly significant. Sargan-Hansen tests of instruments over-identification do not reject the null hypothesis of orthogonality of instruments. Hausman test rejects the null hypothesis of exogeneity of mark-ups.* p < 0.1, ** p < 0.05, *** p < 0.01.
Table 5 – Industry heterogeneity: the Retail sector
(1) (2)
mark-ups µ Total Factor Productivity Barrier to entryt-1 0.0241*** (0.00287) Barrier to entry-Retailt-1 0.0212*** (0.00641) Mark-up -0.769*** (0.243) Mark-up-Retail 0.394** (0.180) D. Turnover (Demand shifter) 0.267*** 0.355***
(0.00883) (0.0904)
Total Factor Productivity t-1 0.383***
(0.0150)
Observations 84,470 84,470
R² 0.0613 -
Sargan statistic 0.700
(p-value) 0.403
See note to Table 4. Instruments are lagged barrier to entry (interacted with Retail dummy), firm age, lag of the first difference of employment, third lag of turnover. First-step estimates’ F tests indicate that instruments are strongly significant. Sargan-Hansen tests of instruments over-identification do not reject the null hypothesis of orthogonality of instruments. Hausman test rejects the null hypothesis of exogeneity of mark-ups. * p < 0.1, ** p < 0.05, *** p < 0.01
Table 6 - Robustness - Sensitivity to specific observations
TFP (1) (2) (3) (4) (5) (6) (7) (8)
Excluding… Reference
equation 10% extreme values of TFP above and below NACE 4711 Sector Retail-food Sector NACE 4759 Retail-furniture Sector NACE 4771 Retail-clothing Sector NACE 4941 Freight-road Sector NACE 6920 Accounting Sector NACE 7490 Engineering mark-up µ -0.315*** -0.415*** -0.233** -0.409*** -0.336*** -0.773** -0.404*** -0.355*** (0.0993) (0.0924) (0.105) (0.110) (0.104) (0.303) (0.111) (0.115) Total Factor Productivityt-1 0.359*** 0.312*** 0.358*** 0.380*** 0.369*** 1.421*** 0.370*** 0.368*** (0.0335) (0.0257) (0.0406) (0.0369) (0.0326) (0.285) (0.0359) (0.0351) D.Turnover 0.281*** 0.242*** 0.302*** 0.311*** 0.280*** 0.634*** 0.316*** 0.282*** (0.0789) (0.0617) (0.0936) (0.0884) (0.0795) (0.193) (0.0834) (0.0832) Observations 84,470 68,409 68,209 76,553 78,742 65,172 80,148 81,679 Sargan 0.752 0.322 0.818 0.652 0.731 0.534 0.967 0.723 (p-value) 0.386 0.571 0.366 0.419 0.393 0.465 0.326 0.395
See note to Table 5. First-step F tests indicate that instruments are strongly significant. Sargan-Hansen tests of instruments over-identification do not reject the null hypothesis of orthogonality. Hausman test rejects the null hypothesis of exogeneity of mark-ups. * p < 0.1, ** p < 0.05, *** p < 0.01.
Table 7 - Robustness - Sensitivity to changes in instruments
Total Factor Productivity (1) (2) (3) (4) (5) (6) mark-up µ -0.315*** -0.315*** -0.312*** -0.407 -0.316* -0.322***
(0.0993) (0.0991) (0.0991) (0.440) (0.172) (0.103) Total Factor Productivityt-1 0.359*** 0.359*** 0.359*** 0.390*** 0.436 0.360***
(0.0335) (0.0334) (0.0334) (0.148) (0.466) (0.0337) D.Turnover 0.281*** 0.280*** 0.277*** 0.487 0.293** 0.283*** (0.0789) (0.0788) (0.0788) (0.967) (0.140) (0.0798) Instruments
Barrier to entryt-1 YES YES YES YES YES NO
D.Employmentt-1 YES YES YES YES NO YES
Turnovert-3 YES YES YES NO YES YES
Age of the firm YES YES NO YES YES YES
Barrier to entry²t-1 NO YES YES YES YES YES
Observations 84,470 84,470 84,470 84,470 85,602 84,470
Sargan 0.752 0.812 0.0575 0.759 0.760 0.745
(p-value) 0.386 0.666 0.811 0.384 0.383 0.388
C-test (p-value) 0.8062 - 0.3851 0.8199 0.7965 0.8062
See note to Table 6. First-step estimates’ F tests indicate that instruments are strongly significant. Sargan-Hansen tests of instruments over-identification do not reject the null hypothesis of orthogonality. Hausman test rejects the null hypothesis of exogeneity of mark-ups. The C-test is a complementary test for the orthogonality of subsets of instruments: the statistics p-value is presented for the instrument which is not in the instrument list and do not reject the exogeneity of any instruments. *
Table 8 - Robustness - Sensitivity to different specifications
Dependent variable: Total Factor
Productivity (1) (2) (3) (4) (5) (6)
Reference equation
without
Dturnover without lagged TFP
without GMM TFP with free parameters
with Frontier TFP
Mark-up µ -0.315*** -0.189** -0.199** -0.313*** -0.251*** -0.292***
(0.0993) (0.0766) (0.0939) (0.106) (0.0940) (0.0989)
Total Factor Productivityt-1 0.359*** 0.317*** 0.359*** 0.335*** 0.356***
(0.0335) (0.0287) (0.0253) (0.0303) (0.0339)
D.Turnover (demand shifter) 0.281*** 0.187** 0.278*** 0.263*** 0.270***
(0.0789) (0.0738) (0.0669) (0.0761) (0.0777) Frontier TFP t-1 0.0896*** (0.0242) N 84,470 84,470 84,470 84,470 84,470 84,253 Sargan statistic 0.752 0.992 0.742 0.185 1.151 0.765 (p-value) 0.386 0.319 0.389 0.667 0.283 0.382
See note to Table 6. GMM estimator applies but for column 4 (without GMM estimators). First-step estimates’ F tests indicate that instruments are strongly significant. Sargan-Hansen tests of instruments over-identification do not reject the null hypothesis of orthogonality of instruments. Hausman test rejects the null hypothesis of exogeneity of mark-ups. * p < 0.1, ** p < 0.05, *** p <
Appendix: PMR data methodology
The OECD PMR incorporates two distinct indices: the non-manufacturing sectors (NMR)7 indicator
and the FDI-restrictiveness indicator. The NMR comprises network sectors (ETRC indicator)8, retail
trade and professional services. The indexes are built on the basis of codes associated to questions answered by each OECD member state – typically related to sector’s entry regulation, ownership share of public authorities, and price controls.
We focus on the NMR index in the particular low level indicator of entry regulation called “Barriers to Entry”. We use the same questions and weights of the OECD survey to compute the (low) level indicator for each sector separately, updating the value for each year in 1995-2007 period.
As for “Barriers in network sectors”, the PMR weighted index is computed as entry regulation9 for air, road, post and TLC.
The “Barriers in Retail sector” weighted index is calculated as: ⅓ Licenses or permits needed to engage in commercial activity+ ⅓ Specific regulation of large outlets+
⅓ Protection of existing firms.
“Barriers in Professional Services sectors” are calculated on the basis of the following main issues: ⅓ Licensing +
⅓ Education requirements + ⅓ Quotas and economic needs test.
7 For a complete list of the questions and coding of answers of the indicators, see Conway P., Nicoletti G., Product market regulation in non-manufacturing sectors of OECD countries: measurement and highlights, 2006, ECO/WKP(2006)58 (No. 530).
8 ETRC indicator refers to electricity, gas, air transport, rail, road freight transport, post and telecommunications. 9 See table 13 page 51 of Wöefl A., Wanner I., Kozluk T., Nicoletti G. (2009).