The independent association between altered renal arterial resistance
and loop diuretic dose in chronic heart failure outpatients
Massimo Iacoviello
a,⁎
, Annalisa Doronzo
a, Valeria Paradies
a, Valeria Antoncecchi
a, Francesco Monitillo
a,
Gaetano Citarelli
a, Marta Leone
a, Agata Puzzovivo
a, Loreto Gesualdo
b, Marco Matteo Ciccone
aa
Cardiology Unit, Department of Emergency and Organ Transplantation, University of Bari, Bari, Italy
b
Nephrology Unit, Department of Emergency and Organ Transplantation, University of Bari, Bari, Italy
a b s t r a c t
a r t i c l e i n f o
Article history:
Received 28 September 2014 Received in revised form 17 March 2015 Accepted 18 March 2015
Available online 25 March 2015 Keywords:
Renal resistance index Chronic heart failure Diuretic
Therapy Renal function
Background: In chronic heart failure (CHF) patients there is a wide variability in the minimal effective diuretic dose. The aim of this study is to evaluate whether renal resistance index (RRI) is associated to baseline diuretic dose and the changes at one year.
Methods and results: 250 outpatients in a stable condition and in conventional therapy were enrolled. Baseline RRI was calculated by renal arterial Doppler. The total daily dose of loop diuretics was assessed at baseline and after one year. High diuretic dose (HDD) was defined as a daily furosemide equivalent dose N100 mg. RRI was independently associated with baseline HDD at univariate (OR 1.39; 95% CI: 1.233–1.58; p b 0.001) and multivariate analysis (OR 1.27; 95% CI: 1.09–1.49; p: 0.002) after correction for other univariate predictors (age, NYHA class, left ventricular ejection fraction, tricuspid annulus peak of systolic excursion, NT-proBNP, glomerularfiltration rate by EPI formula and central venous pressure). Moreover, baseline RRI was independently associated to one year stable increase in loop diuretic dose at univariate and multivariate regression analyses. Conclusions: RRI is independently associated with high dose loop diuretics and their increase during a mid-term follow-up thus suggesting its usefulness in detecting an altered diuretic response in CHF outpatients.
© 2015 Published by Elsevier Ireland Ltd. This is an open access article under the CC BY-NC-ND license (http://creativecommons.org/licenses/by-nc-nd/4.0/).
1. Introduction
In chronic heart failure (CHF) patients diuretic therapy plays a key role in the relief of symptoms due tofluid overload as well as the control of both intracardiac and intravascularfilling pressure[1]. However, diuretics are also affected by possible negative effects [2,3] and consequently, the minimum dosage necessary to keep patients in stable clinical conditions is generally prescribed[1]. It is worth noting that this dosage can vary greatly among patients due to the variability of dose– response curves. When a diuretic dose–response curve shifts down-wards and to the right in CHF, a higher dose of diuretics is necessary in order to achieve the same level of sodium excretion[3].
The alterations of dose–response curves in CHF are related to several renal factors responsible for a reduced nephron response, such as a reduction in glomerularfiltration rate, distal convoluted tubule cell hypertrophy, and the activation of adrenergic and renin–angiotensin– aldosterone systems[4]. Moreover, all these mechanisms can cause abnormalities in renal perfusion which can further contribute to a
reduced diuretic response and to the progressive evolution towards diuretic resistance[5]. In this setting, the estimation of renal perfusion and renal arterial resistances could help the clinician to better charac-terise the pathophysiological background and the need for higher dose diuretics.
Renal arterial resistance index (RRI), a parameter reflecting vascular
[6]and parenchymal renal abnormalities[7], has recently been pro-posed as a useful tool in detecting renal perfusion abnormalities and identifying patients prone to heart failure progression[8]. The aim of this study was to evaluate whether RRI is also independently associ-ated to diuretic dose and to its mid-term increase in a group of CHF outpatients.
2. Methods
Outpatients with CHF of any origin who had been referred to the Heart Failure Unit of the University of Bari between January 2010 and January 2013 were enrolled in the study. At enrolment, those who had been clinically stable for at least 30 days and had been on conventional medical and electrical therapy for at least 3 months were included. Pa-tients with acute decompensated heart failure (ADHF), acute worsening of kidney function or renal failure requiring dialysis or transplantation
⁎ Corresponding author at: Cardiology Unit, Department of Emergency and Organ Transplantation, University of Bari, Piazza Giulio Cesare 11, 70124 Bari, Italy. Tel.: +39 0805478622; fax: +39 0805478796.
E-mail address:[email protected](M. Iacoviello).
http://dx.doi.org/10.1016/j.ijcha.2015.03.004
2352-9067/© 2015 Published by Elsevier Ireland Ltd. This is an open access article under the CC BY-NC-ND license (http://creativecommons.org/licenses/by-nc-nd/4.0/).
Contents lists available atScienceDirect
IJC Heart & Vasculature
were excluded from the study. Written informed consent was obtained from all patients.
This was a secondary analysis of a study that had been approved by the local ethics committee, the mainfindings of which have already been published[8].
2.1. Baseline evaluations
At enrolment, a medical visit, an ECG, an echocardiographic exami-nation and a renal arterial Doppler evaluation were performed. 2.2. Medical examination and electrocardiogram
A documented record of the patients' ischemic heart disease, arterial hypertension and diabetes mellitus was made. Cardiovascular drugs taken by patients were accurately documented. The New York Heart Association (NYHA) class, weight, height, systolic and diastolic arterial pressure were also evaluated and a 12-lead ECG was performed to evaluate heart rhythm and heart rate.
2.3. Echocardiographic evaluation
Echocardiographic images were obtained using an echocardiograph (Vivid 7, GE Vingmed Ultrasound, General Electric, Milwaukee, WI) equipped with a 4 MHz probe. Left ventricular diastolic and end-systolic volume and left ventricular ejection fraction (LVEF) were calcu-lated using Simpson's rule[9]. Right ventricular systolic function was assessed by measuring the systolic peak of tricuspid annular plane excursion (TAPSE).
Colour Doppler semi-quantitative evaluation of mitral regurgitation (MR) and tricuspid regurgitation (TR) was performed, with arbitrary units ranging from 0 to 4. Dilatation of the inferior vena cava and its col-lapsibility during inspiration were evaluated in order to estimate central venous pressure (CVP). In presence of a vena cava of normal diameter with good collapse CVP was estimated at 3 mm Hg, a dilated vena cava with poor collapse was estimated at 15 mm Hg, in intermediate cases the estimate was 8 mm Hg[10]. Pulmonary arterial systolic pres-sure (PASP) was evaluated by calculating the peak velocity of tricuspid regurgitation and estimated CVP[10].
2.4. Chemical evaluations
Blood samples were taken to evaluate amino-terminal brain natri-uretic peptide NT-proBNP (immunoassay Dade Behring, Eschborn, Germany) and serum creatinine (mg/dl). The glomerularfiltration rate was calculated using the abbreviated CKD-EPI formula (GFR-EPI, ml/min/1.73 m2)[11].
2.5. Renal arterial echo-colour Doppler
Renal arterial Doppler was performed after echocardiographic ex-amination with the same echograph (Vivid 7, GE Vingmed Ultrasound, General Electric, Milwaukee, WI) and the same 4 MHz probe, by moving the patient to the sitting position and using a posterior approach to the kidney. The course of right or left renal segmental arteries was visualised by colour Dopplerflow and pulsed Doppler was performed at the mid-tract level of the best one visualised. Every effort was made to obtain the best alignment of the ultrasonic beam. An average of 2 to 3 measurements of peak systolic velocity and end-diastolic velocity was used to calculate the renal arterial resistance index according to Peurcelot's formula, i.e. 100 × [1− (end diastolic velocity / peak systolic velocity)][12]. Patients with a Doppler pattern suggesting renal artery stenosis[13,14]were excluded. A single operator, blinded to baseline diuretic dose, measured RRI.
2.6. Diuretic therapy and follow-up
The clinical practice in our Heart Failure Unit is to progressively re-duce diuretic dose, if possible, based on the clinical conditions and changes in echocardiographic examinations. The minimum diuretic dose which can maintain patients in a stable clinical condition is gener-ally prescribed. Patients are followed-up with scheduled visits (every one to six months according to NYHA functional class impairment) or with unscheduled visits in cases of worsening clinical status. The diuret-ic dose is increased in the case of worsening of symptoms or signs of congestion or after acute decompensated heart failure admission.
At the time of enrolment, all patients had been taking the minimum dose of diuretics for at least 30 days. The daily furosemide equivalent dose was calculated for each patient taking loop diuretics. High diuretic dose (HDD) has been defined as an equivalent furosemide doseN 100 mg/die, that is 4 times the minimal basal dose[15]. The furo-semide equivalent dose was reassessed after 1 year. The stable increase of≥50% in the equivalent furosemide basal dose at 1 year follow-up was considered as the end-point reflecting a significant increase in diuretic dose.
2.7. Statistical analysis
Continuous variables are expressed as mean ± standard deviation. Categorical variables are reported as frequencies and percentages. The between-group comparisons were made by analysis of variance (ANOVA) followed by the Newman–Keuls test for multiple comparisons for continuous variables. For categorical variables chi-squared and McNemar tests were used as appropriate. The receiving operating char-acteristic (ROC) curves for sensitivity and specificity were constructed in order to evaluate the diagnostic accuracy of RRI in predicting diuretic increase by the areas under the curves (AUC). The best cut-off for the end-point analysed was defined on the basis of the greatest sum of sensitivity and specificity.
A multivariate logistic regression analysis was performed in order to define the parameters independently correlated to HDD and to the increase of diuretic dose from baseline. Due to skewed distribution, NT-proBNP was assessed using logarithmically transformed values (base 10). Variable selection in multivariate models was based on statis-tical significance at univariate analysis. To avoid multicollinearity, re-dundant variables were dropped from the multivariate regression models in the case of pairwise correlations between continuous vari-ables[16].
The odds ratios and 95% confidence intervals were also computed to estimate the association between RRI and/or CVP and the significant increase in loop diuretic dose.
A p value ofb0.05 was considered statistically significant. The anal-yses were made using Statistica 6.1 (StatSoft Inc., Tulsa, Oklahoma) and R software (R Development Core Team, R Foundation for Statistical Computing, Vienna, Austria).
3. Results
Two hundred andfifty patients out of a total of 262 were enrolled in the study[8]. Twelve patients were excluded for the following reasons: two had a Doppler pattern of renal arterial stenosis, three had a poor quality pulsed Doppler that did not permit a reliable RRI evaluation and the remaining seven patients because of either acute decompensat-ed heart failure or early loss to follow-up. Of the remaining 250 patients, 30 were not taking loop diuretic at baseline, andfive were taking thia-zides. Of the remaining 215 patients, 28 were excluded at one year eval-uation (14 died, 2 underwent urgent heart transplantation, 12 did not perform 1 year evaluation). Therefore the 187 patients who made up our study cohort underwent a 1 year evaluation. Their baseline clinical characteristics are shown inTable 1.
3.1. Determinants of high diuretic dose at baseline
One hundred andfifty three of the patients enrolled were on low di-uretic dose (LDD) and 34 were on high didi-uretic dose (HDD) therapy.
Table 2shows the univariate predictors of baseline diuretic dose. HDD was associated with diabetes, higher NYHA functional class, lower LVEF and TAPSE, greater right ventricular systolic pressures, more severe MR and TR, greater values of NT-proBNP serum levels and RRI.
At multivariate logistic regression analysis RRI remained signi ficant-ly associated to baseline HDD in the different multivariate regression models, including other univariate predictors, as shown inTable 3. In these models CVP, PASP and TR were included separately because they were too closely correlated to each other.
3.2. RRI and 1 year increase of loop diuretic dose
Of the patients enrolled, 35 (19%) reached the end-point of the sta-ble increase in loop diuretic dose. In 12 patients the increase was conse-quent to hospitalization due to acute decompensated heart failure and in 23 to NYHA class worsening. Patients with increased one year diuretic dose, when compared to those without increased dose, did not show a significant difference of baseline daily furosemide equivalent diuretic dose (67 ± 67 vs. 90 ± 90 mg/die, p: 0.9). At univariate Cox regression analysis a one year increase in loop diuretic dose≥50% was significantly associated with age (OR: 1.26; 95% CI: 1.09–1.45; p: 0.002), GFR-EPI (OR: 0.85; 95% CI: 0.74–0.98; p: 0.023), logarithm NT-proBNP (OR: 1.32; 95% CI: 1.14–1.51; p b 0.001), LVEF (OR: 0.86; 95% CI: 0.75–0.99; p: 0.044), CVP (OR: 1.28; 95% CI: 1.12–1.48; p b 0.001) and RRI (OR: 1.37; 95% CI: 1.19–1.57; p b 0.001). At multivariate regression analysis only CVP (OR: 1.214; 95% CI: 1.05–1.4; p: 0.008) and RRI (OR: 1.21; 95% CI: 1.01–1.44; p: 0.040) remained associated to the end-point.
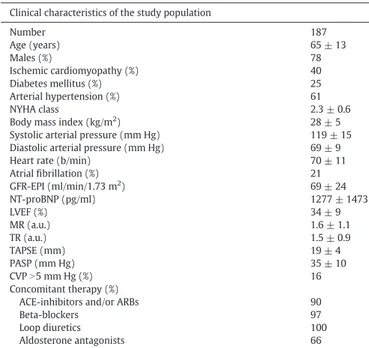
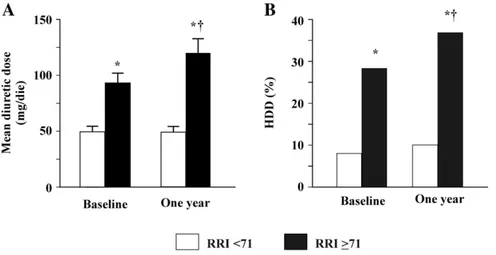
At ROC curve (AUC: 0.71; 95% CI: 0.61–0.80) a RRI cut-off of 71 showed the best value in predicting an increase in loop diuretic dose with a sensitivity of 79% and a specificity of 58%.Fig. 1shows the com-parison between groups of patients with a RRI≥ 71 and b71 who underwent both baseline and 1 year evaluation. Patients with higher RRI were characterised by significantly higher baseline loop diuretic dosage. Moreover, diuretic dosage further and significantly increased after 1 year (panel A). Similarly, a greater percentage of patients with HDD was observed in the group with higher RRI which further and sig-nificantly increased at 1 year (panel B).
Finally, in 79 patients with RRI≥ 71 or CVP N5 mm Hg a higher prob-ability of an increase in loop diuretic dose≥50% was observed com-pared to patients without this risk factor (OR: 1.31; 95% CI: 1.13–1.52; pb 0.001). This risk was even greater in 21 patients with both these risk factors at baseline (OR: 1.64; 95% CI: 1.39–1.94; p b 0.001). 4. Discussion
The mainfinding of this study is the independent association be-tween RRI, basal high diuretic dose and one-year increase of furosemide dose in a population of CHF outpatients.
RRI is a parameter reflecting abnormalities in renal perfusion, which we have recently found to be independently associated with heart fail-ure progression[8]. Interestingly, even though it was strictly correlated to the world-wide accepted marker of renal dysfunction, its predictive value was incremental to that of estimated GFR, thus suggesting its
Table 1
Patient baseline clinical characteristics. Clinical characteristics of the study population
Number 187 Age (years) 65 ± 13 Males (%) 78 Ischemic cardiomyopathy (%) 40 Diabetes mellitus (%) 25 Arterial hypertension (%) 61 NYHA class 2.3 ± 0.6
Body mass index (kg/m2
) 28 ± 5
Systolic arterial pressure (mm Hg) 119 ± 15 Diastolic arterial pressure (mm Hg) 69 ± 9 Heart rate (b/min) 70 ± 11 Atrialfibrillation (%) 21 GFR-EPI (ml/min/1.73 m2 ) 69 ± 24 NT-proBNP (pg/ml) 1277 ± 1473 LVEF (%) 34 ± 9 MR (a.u.) 1.6 ± 1.1 TR (a.u.) 1.5 ± 0.9 TAPSE (mm) 19 ± 4 PASP (mm Hg) 35 ± 10 CVPN5 mm Hg (%) 16 Concomitant therapy (%)
ACE-inhibitors and/or ARBs 90
Beta-blockers 97
Loop diuretics 100
Aldosterone antagonists 66
CVP: central venous pressure. GFR-EPI: glomerularfiltration rate by CKD-EPI formula; LVEF: left ventricular ejection fraction; MR: mitral regurgitation; NT-proBNP: N-terminal pro-brain natriuretic peptide; PASP: systolic peak of pulmonary arterial pressure; TAPSE: peak of tricuspid annular plane systolic excursion; TR: tricuspid regurgitation.
Table 2
Baseline clinical and therapeutic characteristics of patients at enrolment according to low or high loop diuretic dose. The association among studied variables and baseline high diuretic dose at univariate regression analysis is reported.
Baseline LDD Baseline HDD Univariate regression analysis OR (95% CI) p Number 153 34 Age (years) 65 ± 13 67 ± 12 1.04 (0.90–1.21) 0.556 Ischemic cardiomyopathy (%) 37 53 1.13 (0.98–1.31) 0.092 Diabetes mellitus (%) 21 41 1.19 (1.04–1.38) 0.013 Arterial Hypertension (%) 61 65 1.03 (0.89–1.19) 0.673 NYHA class 2.2 ± 0.5 2.36 ± 0.5 1.32 (1.15–1.51) b0.001
Body mass index (kg/m2
) 28 ± 4 28 ± 5 0.99 (0.86–1.14) 0.880
Systolic arterial pressure (mm Hg) 120 ± 15 115 ± 14 0.87 (0.75–1.0) 0.052 GFR-EPI (ml/min/1.73 m2) 71 ± 24 63 ± 23 0.87 (0.76–1.01) 0.066 NT-proBNP (pg/ml)a 1035 ± 1219 2356 ± 1974 1.42 (1.24–1.62) b0.001 LVEF (%) 35 ± 9 29 ± 10 0.77 (0.67–0.88) b0.001 MR (a.u.) 1.5 ± 0.9 2.2 ± 1.4 1.3 (1.13–1.49) b0.001 TR (a.u.) 1.3 ± 0.9 1.9 ± 1.1 1.29 (1.12–1.48) b0.001 TAPSE (mm) 19 ± 4 17 ± 5 0.77 (0.67–0.89) b0.001 PASP (mm Hg) 35 ± 10 43 ± 12 1.44 (1.25–1.66) b0.001 CVPN5 mm Hg (%) 11 38 1.34 (1.17–1.54) b0.001 RRI 69 ± 9 76 ± 6 1.39 (1.22–1.60) b0.001
LDD: low diuretic dose. HDD: high diuretic dose. For the remaining abbreviations see table 1.
ability to better characterise renal dysfunction in CHF outpatients. The incremental information carried by RRI is strictly related to the patho-physiological conditions underlying the increase in renal vascular resis-tance. Firstly, a high RRI may reflect the abnormalities of the renal arteries related to vascular lesions[17]and/or an increased arterial stiff-ness[6]. Secondly, intra-renal hemodynamic changes due to both pa-renchymal and vascular abnormalities can cause an RRI increase[7]. Thirdly, a high RRI could be caused by increased CVP, as the latter deter-mines higher intra-abdominal and intra-renal pressures[18,19]. Finally, neurohormonal hyperactivity can worsen systemic congestion and con-tribute to increased intravascular resistance[20].
All the abovementioned pathophysiological factors can explain the independent relationship we found with high diuretic dose.
A decreased response of the nephron to diuretic therapy in CHF pa-tients when compared to normal papa-tients has been widely demonstrat-ed. The dose–response curve shows a downward and right shift, thus requiring a higher dose in order to achieve the same level of sodium ex-cretion[21]. However, in CHF patients, there is a high interindividual variability in loop diuretic response. Consequently, there could be pa-tients with a similar left ventricular dysfunction who require either very high or low doses in order to maintain a euvolemic state[22]. Nev-ertheless, it is not unlikely that changes in renal perfusion can play a key role in determining differences in the dose–response curve of diuretics. In fact, the increased renal arterial resistance can cause water and sodi-um retention because of the reduction in glomerularfiltration pressure
[23]. Moreover, the reduced GFR could lead to a reduced delivery of di-uretic molecules to their site of action at Henle's loop[24,25].
The decreased diuretic response could be further worsened when an increased arterial renal resistance is associated to a high CVP[19,25]. In this condition, a further decline in GFR could be determined by an increase in both renal interstitial pressure and renal tubular pres-sure[19]. As a consequence, the net hydrostatic pressure difference between the glomerular capillaries and the tubule (i.e. one of the main driving forces for GFR) is reduced and diuretic response can be affected
[25].
Ourfindings further support the potential harmful effects of RRI and CVP by demonstrating that these parameters are also independently as-sociated with diuretic dose increase during a mid-term follow-up. In fact, the presence of RRI or CVP is associated with a higher risk of diuret-ic dose increase and this risk becomes even greater when both factors are present. These results suggest that the coexistence of renal venous congestion and high arterial renal resistance can cause a progressive loss of response to diuretics and this self-perpetuating vicious circle could lead to diuretic resistance. However, it should also be considered that several other mechanisms might be involved in the diuretic dose increase at mid-term follow-up, such as neurohormonal activation, cytochines, adaptative changes of nephrons, and the bioavailability of oral furosemide influenced by delayed intestinal absorption.
Finally, in our study cohort no independent association was found between GFR estimated by EPI formula and diuretic dose. Chronic kid-ney failure can cause a change in the dose–response curve of diuretics. In particular, the curve shifts to the right and higher doses are required to obtain a significant diuretic effect[26]. Nevertheless, our results sug-gest that, the main determinant of the variability in diuretics response is
Table 3
Multivariate regression models to estimate the predictors of baseline high diuretic dose. Multivariate regression analysis
Model 1 Model 2 Model 3
OR (95% CI) P OR (95% CI) p OR (95% CI) p
Diabetes 1.11 (0.98–1.27) 0.116 1.11 (0.98–1.27) 0.111 1.11 (0.98–1.27) 0.113 NYHA 1.14 (0.99–1.31) 0.055 1.13 (0.99–1.29) 0.077 1.13 (0.99–1.30) 0.073 GFR-EPI 1.08 (0.93–1.27) 0.311 1.07 (0.91–1.26) 0.394 1.08 (0.93–1.27) 0.319 NT-proBNPa 1.12 (0.97–1.30) 0.139 1.09 (0.94–1.28) 0.240 1.15 (0.991–1.33) 0.067 LVEF 0.84 (0.73–0.96) 0.013 0.85 (0.74–0.97) 0.019 0.83 (0.72–0.96) 0.011 TAPSE 0.87 (0.77–0.99) 0.045 0.86 (0.76–0.98) 0.026 0.87 (0.76–0.99) 0.042 PVCN5 1.20 (1.05–1.38) 0.007 – – – – RRI 1.22 (1.04–1.44) 0.018 1.206 (1.021–1.425) 0.029 1.21 (1.02–1.42) 0.030 PASP – – 1.217 (1.059–1.398) 0.006 – – TR – – – – 1.16 (1.01–1.33) 0.041
aAfter log-transformation. For abbreviations seeTable 1.
Fig. 1. Results of patients at both baseline and 1 year evaluation, according to an RRI≥71 (92 patients) or less?? (95 patients). Panel A shows the baseline and one year mean diuretic dose in the two groups and panel B shows the percentage of patients taking high diuretic dose. * vs. RRIb 71;†vs. baseline. RRI: renal resistance index. HDD: high diuretic dose.
the complex inter-relationship between the hemodynamic parameters related to renal bloodflow as opposed to GFR.
4.1. Limitations of the study
Our study is a secondary analysis of a previously published paper. The analysis of diuretic dose was possible due to the fact that its use in our heart failure unit is standardised and conforms to current guidelines
[1]. We did not measure RRI after one year follow-up. These data could be interesting in order to evaluate how this parameter changes over time and how it is related to the therapy.
In conclusion, RRI is a parameter reflecting arterial renal perfusion which is independently associated with the high dose of loop diuretics as well as with its increase during a mid-term follow-up. High central venous pressure is also a condition independently related to the diuretic dose increase. These data suggest the potential usefulness of renal resis-tance index and central venous pressure assessment in order to detect patients with an altered diuretic dose–response curve which can also lead to the development of diuretic resistance. In addition, the present findings may represent the basis for further investigations aimed at optimizing therapies intended to improve renal perfusion and, as a consequence, the response of CHF patients to diuretic therapy. Conflict of interest
The authors report no relationships that could be construed as a conflict of interest.
References
[1] McMurray JJ, Adamopoulos S, Anker SD, Auricchio A, Böhm M, Dickstein K, et al. ESC Committee for Practice Guidelines. ESC guidelines for the diagnosis and treatment of acute and chronic heart failure 2012: the Task Force for the Diagnosis and Treatment of Acute and Chronic Heart Failure 2012 of the European Society of Cardiology. De-veloped in collaboration with the Heart Failure Association (HFA) of the ESC. Eur J Heart Fail 2012;14:803–69.http://dx.doi.org/10.1093/eurjhf/hfs105.
[2]Schrier RW. Role of diminished renal function in cardiovascular mortality: marker or pathogenetic factor? J Am Coll Cardiol 2006;47:1–8.
[3]Felker GM, Mentz RJ. Diuretics and ultrafiltration in acute decompensated heart fail-ure. J Am Coll Cardiol 2012;59:2145–53.
[4] Felker GM. Loop diuretics in heart failure. Heart Fail Rev 2012;17:305–11.http://dx. doi.org/10.1007/s10741-011-9245-3.
[5]Schrier RW, De Wardener HE. Tubular reabsorption of sodium ions: influence of fac-tors rather than aldosterone and glomerularfiltration rate. N Engl J Med 1971;285: 1292–303.
[6]Ohta Y, Fujii K, Arima H, Matsumura K, Tsuchihashi T, Tokumoto M, et al. Increased renal resistive index in atherosclerosis and diabetic nephropathy assessed by Dopp-ler sonography. J Hypertens 2005;23:1905–11.
[7] Bigé N, Lévy PP, Callard P, Faintuch JM, Chigot V, Jousselin V, et al. Renal arterial re-sistive index is associated with severe histological changes and poor renal outcome during chronic kidney disease. BMC Nephrol 2012;13:139.http://dx.doi.org/10. 1186/1471-2369-13-139.
[8] Ciccone MM, Iacoviello M, Gesualdo L, Puzzovivo A, Antoncecchi V, Doronzo A, et al. The renal arterial resistance index: a marker of renal function with an independent and incremental role in predicting heart failure progression. Eur J Heart Fail 2014; 16:210–6.http://dx.doi.org/10.1002/ejhf.34.
[9]Lang RM, Bierig M, Devereux RB, Flachskampf FA, Foster E, Pellikka PA, et al. American Society of Echocardiography's Nomenclature and Standards Committee; Task Force on Chamber Quantification; American College of Cardiology Echocardiog-raphy Committee; American Heart Association; European Association of Echocardi-ography, European Society of Cardiology. Recommendations for chamber quantification. Eur J Echocardiogr 2006;7:79–108.
[10]Rudski LG, Lai WW, Afilalo J, Hua L, Handschumacher MD, Chandrasekaran K, et al. Guidelines for the echocardiographic assessment of the right heart in adults: a re-port from the American Society of Echocardiography endorsed by the European As-sociation of Echocardiography, a registered branch of the European Society of Cardiology, and the Canadian Society of Echocardiography. J Am Soc Echocardiogr 2010;23:685–713.
[11]Levey AS, Stevens LA, Schmid CH, Zhang YL, Castro III AF, Feldman HI, et al. (CKD-EPI) Chronic Kidney Disease Epidemiology Collaboration. A new equation to esti-mate glomerularfiltration rate. Ann Intern Med 2009;150:604–12.
[12] Comnick M, Ishani A. Renal biomarkers of kidney injury in cardiorenal syndrome. Curr Heart Fail Rep 2011;8:99–105.http://dx.doi.org/10.1007/s11897-011-0052-x. [13]Stavros AT, Parker SH, Yakes WF, Chantelois AE, Burke BJ, Meyers PR, et al.
Segmen-tal stenosis of the renal artery: pattern recognition of tardus and parvus abnormal-ities with duplex sonography. Radiology 1992;184:487–92.
[14]Kliewer MA, Tulper RH, Carroll BA, Paine SS, Kriegshauser JS, Hertzberg BS, et al. Renal artery stenosis: analysis of Doppler waveform parameters and tardus–parvus pattern. Radiology 1993;189:779–87.
[15] Mielniczuk LM, Tsang SW, Desai AS, Nohria A, Lewis EF, Fang JC, et al. The association between high-dose diuretics and clinical stability in ambulatory chronic heart failure patients. J Card Fail 2008;14:388–93.http://dx.doi.org/10.1016/j.cardfail.2008.01. 015.
[16]Slinker BK, Glantz SA. Multiple linear regression: accounting for multiple simulta-neous determinants of a continuous dependent variable. Circulation 2008;117: 1732–7.
[17]Ikee R, Kobayashi S, Hemmi N, Imakiire T, Kikuchi Y, Moriya H, et al. Correlation be-tween the resistive index by Doppler ultrasound and kidney function and histology. Am J Kidney Dis 2005;46:603–9.
[18] Iacoviello M, Puzzovivo A, Monitillo F, Saulle D, Lattarulo MS, Guida P, et al. Indepen-dent role of high central venous pressure in predicting worsening of renal function in chronic heart failure outpatients. Int J Cardiol 2013;162:261–3.http://dx.doi.org/ 10.1016/j.ijcard.2012.06.088.
[19] Verbrugge FH, Dupont M, Steels P, Grieten L, Malbrain M, Tang W, et al. Abdominal contributions to cardiorenal dysfunction in congestive heart failure. J Am Coll Cardiol 2013;62:485–95.http://dx.doi.org/10.1016/j.jacc.2013.04.070.
[20]Boddi M, Sacchi S, Lammel RM, Mohseni R, Serneri GG. Age-related and vasomotor stimuli-induced changes in renal vascular resistance detected by Doppler ultra-sound. Am J Hypertens 1996;9:461–6.
[21]Cleland JG, Coletta A, Witte K. Practical applications of intravenous diuretic therapy in decompensated heart failure. Am J Med 2006;119:S26–36.
[22]Weber KT. Furosemide in the long-term management of heart failure: the good, the bad and the uncertain. J Am Coll Cardiol 2004;44:1308–10.
[23]Earley LE, Martino JA, Friedler RM. Factors affecting sodium reabsorption by the proximal tubule as determined during blockade of distal sodium reabsorption. J Clin Invest 1996;45:1668–84.
[24]Paul S. Balancing diuretic therapy in heart failure: loop diuretics, thiazides, and aldo-sterone antagonists. Congest Heart Fail 2002;8:307–12.
[25] Braam B, Cupples WA, Joles JA, Gaillard C. Systemic arterial and venous determinants of renal hemodynamics in congestive heart failure. Heart Fail Rev 2012;17:161–75.
http://dx.doi.org/10.1007/s10741-011-9246-2.
[26]Ellison DH. Diuretic therapy and resistance in congestive heart failure. Cardiology 2001;96:132–43.