DIPARTIMENTO DI SCIENZE ECONOMICHE E SOCIALI
Driving business performance:
innovation complementarities
and persistence patterns
Eleonora Bartoloni
Maurizio Baussola
Quaderno n. 113/marzo 2016
COP Bartoloni-Baussola_113_2016.qxd:_ 15/03/16 08:31 Page 1Università Cattolica del Sacro Cuore
DIPARTIMENTO DI SCIENZE ECONOMICHE E SOCIALI
Driving business performance:
innovation complementarities
and persistence patterns*
Eleonora Bartoloni
†Maurizio Baussola
‡Quaderno n. 113/marzo 2016
* This paper is a result of collaboration between the Italian National Institute of Statistics (ISTAT, Regional Office for Lombardy) and Università Cattolica del Sacro Cuore (UCSC). We would like to thank Manlio Calzaroni, Raffaele Malizia and Rosalia Coniglio of the Italian National Institute of Statistics (ISTAT) for providing access to the data. Needless to say, the usual disclaimers apply.
†ISTAT, Italian National Institute of Statistics, Via Porlezza, 12, Milano 20123, Italy.
Eleonora Bartoloni, ISTAT, Italian National Institute of Statistics,Via Porlezza,12, 20123 Milano
Maurizio Baussola, Dipartimento di Scienze Economiche e Sociali, Università Cattolica del Sacro Cuore, Piacenza
I quaderni possono essere richiesti a:
Dipartimento di Scienze Economiche e Sociali, Università Cattolica del Sacro Cuore
Via Emilia Parmense 84 - 29122 Piacenza - Tel. 0523 599.342 http://dipartimenti.unicatt.it/dises
www.vitaepensiero.it
All rights reserved. Photocopies for personal use of the reader, not exceeding 15% of each volume, may be made under the payment of a copying fee to the SIAE, in accordance with the provisions of the law n. 633 of 22 april 1941 (art. 68, par. 4 and 5). Reproductions which are not intended for personal use may be only made with the written permission of CLEARedi, Centro Licenze e Autorizzazioni per le Riproduzioni Editoriali, Corso di Porta Romana 108, 20122 Milano, e-mail: [email protected], web site www.clearedi.org.
Le fotocopie per uso personale del lettore possono essere effettuate nei limiti del 15% di ciascun volume dietro pagamento alla SIAE del compenso previsto dall’art. 68, commi 4 e 5, della legge 22 aprile 1941 n. 633.
Le fotocopie effettuate per finalità di carattere professionale, economico o commerciale o comunque per uso diverso da quello personale possono essere effettuate a seguito di specifica autorizzazione rilasciata da CLEARedi, Centro Licenze e Autorizzazioni per le Riproduzioni Editoriali, Corso di Porta Romana 108, 20122 Milano, e-mail: [email protected] e sito web www.clearedi.org.
© 2016 Eleonora Bartoloni, Maurizio Baussola ISBN 978-88-343-3194-1
Abstract
Complementarities between technological and non-technological innovation are crucial determinants of firm performance. This topic has not received the attention that it merits, as the focus has been primarily placed on technological innovation alone or on innovation efforts as measured by R&D or patent activities. The capacities to develop market-oriented behaviour and intro-duce new organisational innovations are the drivers - together with technological innovation - of a firm’s productivity and prof-itability. We also underline how the impact of such activities is larger when they persist over time, thus introducing a more gen-eral concept of innovation persistency. We present an empirical model based on a large and new panel of Italian manufacturing firms covering the period 2000-2012 that enables us to derive the precise impacts of a firm’s innovative effort - based on a broad definition that incorporates non-technological innovation and persistence - on its productivity and profitability.
JEL Classifications: L25, 030, 032, 033
Keywords: Technological and non-technological innovation,
Com-plementarities, European Community Innovation Survey, Prof-itability, Productivity, Unbalanced panel data
1
Introduction
The relationship between innovation and firms’ performance has long been debated within the economic and managerial literature. The former has focused on both macro- and microeconomic implications underlining, on the one hand, the role of innovation inputs (e.g., R&D activity) in determining long-run economic growth. This approach characterised the early R&D endogenous growth models (Romer, 1990; Jones, 1995; Aghion and Howitt, 1992).
On the other hand, the microeconomic approach has focused partic-ularly on the empirical estimation of the impact of innovation on firms’ productivity (Geroski, 1989; Cr´epon et al., 1998; L¨o¨of and Heshmati, 2002), thus emphasising the methodological issues underlying such em-pirical investigations.
On the managerial side, particular emphasis has been devoted to the impact of a firm’s attitude of being an innovator (product and or pro-cess) and, simultaneously, to its ability to be market-oriented (Roberts, 2001; Narver and Slater, 1990). This approach embraces a more com-prehensive definition of an innovative attitude, which typically brings about other forms of non-technological innovations, i.e., organisational and marketing innovations. Indeed, these forms of innovation play a crucial role in affecting firms’ performance in terms of productivity and even profitability, in that the innovation process affects the internal allocation and use of resources, thus enabling innovating firms to be more responsive to changing market conditions (Geroski et al., 1993).
All of these issues imply that for innovation to be effective, it should be persistent, thus enabling those continuously innovating firms to gain a premium with respect to peers that do not act accordingly. This view is also supported on theoretical grounds by theories addressing i) the existence of sunk costs in innovation activities (e.g., R&D expenditures) (Stiglitz, 1987; Ma˜nez et al., 2009); ii) the positive correlation with past successful innovations (success-breeds-success), which implies a positive impact on firms’ profitability and thus on their future ability to finance more innovative activities (Le Bas and Latham, 2006; Carpenter and Petersen, 2002); and iii) the dynamic accumulation of knowledge or, in other words, the dynamic process of innovation that enables a firm to learn and adapt its innovation strategy (Geroski et al., 1993, 1997; David, 1992).
Innovation persistence provides a firm with the ability to exploit competitive advantages with respect to competitors and thus to earn
profits that are systematically higher than those gained by non-innovating or at least only occasional innovating firms. (Bartoloni and Baussola, 2009; Mueller, 1992).
However, the role of non-technological innovation has not been com-pletely considered in this framework. Indeed, non-technological innova-tion is crucially associated with technological innovainnova-tion (e.g., product or process innovation) and generates technological activities related to new organisational and marketing activities, which affect the success of such new technological practices. In particular, process innovation and organisation innovation may be closely linked to one another, whereas product innovation may be more effectively related (although not ex-clusively) to marketing innovation. In a recent study, Bartoloni and Baussola (2016) underline how an emphasis on technological innova-tion alone is misleading and that a firm’s decision to innovate involves a more complex and general process that crucially affects its perfor-mance.
We propose an empirical investigation in which we explicitly con-sider the role of persistent technological and non-technological inno-vations in affecting firms’ performance in terms of productivity and profitability. We use a panel of Italian manufacturing firms over the period 1998-2012 derived from the Community Innovation Survey and matched with administrative data that enabled us to obtain informa-tion on firms’ balance sheets.
The paper is therefore structured as follows. In Section 2, we provide the interpretative framework used to develop the empirical analysis. In Section 3, we describe the characteristics of the data set, we present the empirical model in Section 4, and the results are discussed in Section 5. Section 6 concludes the paper.
2
The interpretative framework
The debate on the persistence of innovation has typically analysed the role of persistent activities as measured by R&D (input) or patents (output) and, to a lesser extent, by technology adoption without con-sidering the role of non-technological innovation. The impact of inno-vation on firms’ performance may be analysed with respect to both the input and output of the innovation process. Typically, the former is considered by using R&D expenditure as a proxy for knowledge cap-ital, which therefore contributes, akin to other production inputs, to
output growth. Innovation input is also considered, focusing on the adoption of new process technology, which implies the use of new and more efficient capital goods.
This approach has been particularly developed within the endoge-nous growth theoretical setting (Romer, 1990), in which an R&D sector interacts with a manufacturing sector producing new capital goods and final output. The model implies an equilibrium growth path crucially depending on the resources allocated to R&D.
Innovation output is considered the key variable that increases pro-ductivity in the seminal study by Cr´epon et al. (1998). In this model, innovation output is measured by expected patents per employee or by the share of innovative sales. This model, which has inspired an increasing number of studies based on such a methodological strategy, is focused on the empirical tools required - when using innovation sur-veys - to overcome the bias related to information available only for innovative firms.
L¨o¨of and Heshmati (2002) use such an approach to develop an em-pirical analysis of knowledge capital and productivity at the firm level for a sample of Swedish firms participating in the national Community Innovation Survey. They emphasise how intangible assets are crucial in affecting the results, thus underlining the implicit relevance of their measurement issue.
Another branch of the literature has focused, instead, on panel data investigations to address causality issues (Rouvinen, 2002; Frantzen, 2003; Battisti et al., 2010), finding support for a causal link running from R&D to productivity.
In our empirical specification, we focus on the relationship between productivity - as measured by real value added per worker - and produc-tion inputs while also accounting for the effect of persistently adopted technological and non-technological innovations. Thus, our aim is to investigate whether such a persistent innovative attitude - given by the previous definition that includes technological and non-technological innovations - significantly affects productivity. In addition, we aim to investigate the determinants of firms’ profitability. This is the other side of the coin represented by a firm performance measurement.
The relationship between innovation and profitability has received less attention, particularly in recent years, compared with the anal-ysis of the determinants of productivity. The traditional approach to analysing firms’ profitability refers to the structure-conduct-performance (SCP) paradigm (Bain, 1956), in that a firm’s performance is
deter-mined by structural characteristics of the industry. In contrast to this approach, the so-called firm efficiency view (Demsetz, 1973; Peltzman, 1977) emphasises the role of firms’ characteristics in determining their profits. However, empirical studies have generated controversial re-sults, which crucially depend on the characteristics of the data set used to implement such tests. Slade (2004), Allen (1983), and Delorme Jr. et al. (2002) find support for the SCP approach, whereas Roberts (1999, 2001) and Hawawini et al. (2003) recognise the role of managerial ca-pabilities in determining profitability.
Bartoloni and Baussola (2009) emphasise that the traditional SCP effect, although it was verified in a large panel of Italian manufactur-ing firms in the 1990s, had a very mild effect on profitability and its persistence, whereas firms’ innovative behaviour was more relevant in this respect.
The impact of innovation on profitability has also been analysed in the framework of technology adoption. Geroski et al. (1993) emphasise not only the role of adoption per se but also that such a decision implies a full process that involves other choices and actions within a firm (e.g., organisational changes) that determine different internal allocations of resources.
Mueller and Cubbin (2005) emphasise how technological adoption provides a competitive advantage to innovating firms, thus enabling them to increase their profitability. Technology adoption and prof-itability is considered in a dynamic perspective by Stoneman and Kwon (1996). They emphasise that multiple adoption may occur, and firms may thus introduce new technologies at different points in time. Prof-itability - as in the case of technological adoption - should be considered along the diffusion path together with the distinction between older and more recent innovations, as the former are more exposed to greater competition, thus affecting profitability.
Our aim is to conduct an empirical analysis in which the main fac-tors discussed within this framework are considered in the definition of a firm’s profitability, as described in Section 4.
3
Panel data description
Our main data source is the Micro-Manu dataset1, an unbalanced
panel of Italian manufacturing firms linking consecutive waves of the Italian Community Innovation Survey - which forms part of the EU sci-ence and technology statistics and is conducted every two years - with the ASIA archive (Statistical Register of Active Businesses)2 and an
administrative data source providing balance sheets and income state-ments for those firms included in the CIS samples of respondents. The richness of this data set allows one to enlarge the set of economic in-dicators typically explored in the innovation survey micro-data and to derive a set of financial and efficiency ratios that are not included in the CIS questionnaire. In accordance with international standards (OECD-Eurostat 2005), firms are classified by their type of innovation activity (technological and non-technological). Information on non-technological aspects of innovation (new marketing and/or organisa-tional methods) allows one to consider comprehensive innovative activ-ities by focusing on the reciprocal interactions between different aspects of innovation.
To analyse firms’ innovative pattern in a longitudinal context, we select an unbalanced panel of firms from the original dataset responding to at least two consecutive non-overlapped3 CIS waves (CIS1, years
1998-2000; CIS2, years 2002-2004; CIS4 years 2006-2008; and CIS6, years 2010-2012). We have more than 3,000 firms, corresponding to nearly 8,000 observations over the whole period 1998-2012.
A strictly technological innovating firm is defined as one that has implemented an innovation only in the technological domain (i.e., a product and/or process innovation, with the exclusion of other non-technological forms of innovation) during the observed period. A com-plementary innovating firm is defined as one that has innovated in all the technological and non-technological domains (product and process and organisation and marketing). We distinguish between persistent and occasional innovative profiles in both the technological and
com-1The Micro-Manu dataset is a result of collaboration between the Italian Na-tional Institute of Statistics (ISTAT, Regional office for Lombardy) and the Catholic University of the Sacred Hearth.
2This archive is the most relevant administrative register used by ISTAT as the basis for many sample surveys and even census investigations.
3A characteristic that merits attention is that the measurement of the degree of innovation persistence may be over-estimated when two consecutive waves are partially overlapped.
plementary domains by defining (i) a persistent innovator as one that has innovated in at least two consecutive CIS periods (pers tech and
pers tech ntech) and (ii) an occasional innovator as one that has
in-novated at least once during the entire time span but never in two consecutive periods (tech and tech ntech).
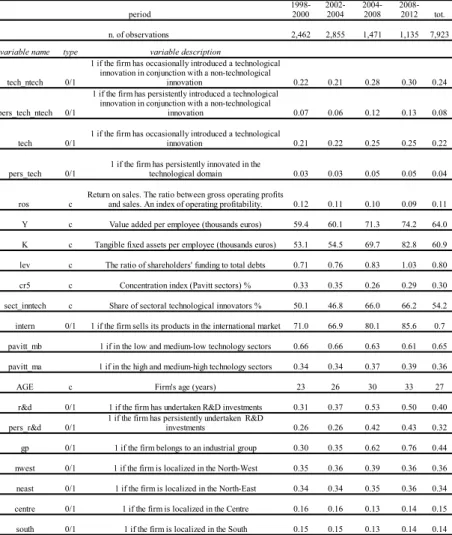
Table 1: Unbalanced panel of manufacturing firms with non-missing accounting information (CIS1, 1998-2000; CIS2, 2002-2004; CIS4, 2006-2008; CIS6, 2010-2012)
Notes. The patterns of inclusion indicate absence (0) or presence (1), during the
four consecutive innovation surveys. Innovative behaviour: tech - the firm has innovated occasionally only in the technological domain; pers tech - the firm has innovated persistently only in the technological domain; tech ntech - the firm has innovated occasionally in both the technological and non-technological domains; and pers tech ntech - the firm has innovated persistently in both the technological and non-technological domains.
It is worth noting that the specific nature of the CIS’s sampling design gives rise to potential selection bias when using a longitudinal framework. Indeed, whereas large firms with more than 250 employees are selected on a census basis, small firms are randomly selected, and this sampling mechanism may negatively affect the probability of a firm being selected in consecutive surveys. Table 1 reports descriptive statistics for each “feasible” pattern of inclusion4relative to the relevant outcomes of a firm’s innovative activity. Hence, we can observe, for example, that the mean size of firms that are present only in the first two waves is 37 employees, but the size increases to 365 employees when the balanced sample of firms present in all four waves is considered. If we decided to retain this restricted group, we could define a persistent innovator in a more stringent way (i.e., as one that has continuously
4According to the methodology proposed by Raymond et al. (2009), a pattern is “feasible” when the dynamics of innovation are potentially observable.
innovated during a four-period time span). However, by following this approach, we would probably confine our analysis to those firms with higher innovative propensity, with possible bias as a result. On the basis of this consideration, we decided to base our empirical investigation on the full set firms appearing in the unbalanced panel.
It is worth emphasising that balance-sheet information for the pe-riod 1998-2012 is provided on a yearly basis, whereas the qualitative variables derived from the CIS survey are defined on a three-year basis. To address the problem of different information timing, we averaged accounting information over a three-year period; thus, the economic and financial indexes are provided as average values over the reference CIS time span. One should note that the full samples of firms from the CIS surveys also include small individual firms for which balance-sheet information is not available from the Italian public register; thus, our analysis excludes these firms. We have compared the final sample of firms for which there is complete accounting information to the initial CIS samples in the “feasible” panel and then concluded that the loss of sampling units due to the use of out-of-sample information is negligi-ble. The variables used in the empirical model are described in greater detail below.
Economic performance
We use a measure of operating profitability, return on sales (ros), that is appropriate for investigating the profitability generated by the core business of a manufacturing firm and a measure of labour pro-ductivity (Y ), which is given by the value added per employee ratio and may be considered an intermediate measure of a firm’s innovation success5.
Financial efficiency indexes
Financial efficiency can be considered by using a measure of a firm’s exposure to external financing sources (lev ), which is given by the ratio of shareholders’ funds to total debt, thus reflecting the extent to which a firm uses internal resources instead of borrowing to finance its activity.
Capital deepening
The role of physical capital is captured by considering the capital-to-labour ratio (K, tangible fixed assets per employee). It measures
5We are aware that the relationship between innovation and productivity pro-duces diverse empirical results. However, following Mohnen and Hall (2013), inno-vation leads to an increase in productivity, although it is not possible to disentangle the price and output effects on growth, given the characteristics of the available data sets.
Table 2: Descriptive statistics
Notes. The variable Y and K have been deflated using sectoral deflators (base
year 2010). “Persistently” means in at least two consecutive periods. “Occasionally” means at least one time but never in two consecutive periods.
the extent of capital deepening in fostering productivity. Typically, the impact of this variable on labour productivity may be derived from growth-accounting exercises, together with the impact that may be exerted by Total Factor Productivity (TFP). Instead, we test its impact by using an econometric approach, which enables us to consider other possible determinants related, in particular, to a firm’s innovative effort. One should note that capital deepening may also incorporate process innovation; this latter determinant typically implies the acquisition of new machinery6.
Innovation input
As noted above, together with physical capital, a firm’s innova-tive effort should be considered when describing the core determinants of labour productivity. The proxy that we use, R&D activities, may also be considered a proxy for knowledge capital, which can contribute directly to labour productivity growth and exert a positive influence through TFP growth. Because we refer to the entire sample of inno-vative and non-innoinno-vative firms, the aforementioned information is not available for this latter group of firms, given the characteristics of the CIS survey. Therefore, we use a dummy variable indicating whether a firm has undertaken R&D activity occasionally (R&D) or persistently (pers R&D)7. Thus, the impact of R&D may be considered a shifting
parameter in the adopted specification (see the following Section 4).
Innovation output
The aim of our investigation is to explore the complementary role of technological and non-technological aspects of innovation in determin-ing a firm’s performance relative to innovation that is strictly technolog-ical. We aim to reveal the presence of possible performance gains that may be earned by firms developing innovation continuously over time compared with sporadic innovators. Thus, we consider the four differ-ent proxies for a firm’s attitude towards innovation that are described above. As in the case of R&D, these variables enter the productivity equation as shifting parameters.
Other firm-specific characteristics
6This argument is also considered in Hall et al. (2009), who estimate a produc-tivity equation that depends on product and process innovation together with fixed investment.
7Otherwise, a different modelling strategy would have been in order, i.e., focusing only on innovative firms or using a Tobit model with a selection equation. This approach, however, is beyond the scope of our investigation, the aim of which is to specify the different behaviour and performance of innovative and non-innovative firms.
Firms’ age (years, log values) may positively affect their growth; thus, firm age exerts an indirect impact on profitability8. Moreover, another two variables - available from the CIS survey - reflect a firm’s ownership structure and its propensity to internationalise. Thus, we use two dummy variables: the first indicates whether a firm belongs to a corporate group (gp), and the second indicates whether a firm sells its products in the international market (intern). The first variable may affect a firm’s efficiency, whereas the latter is closely related to the ability to expand internationally and thus increase turnover.
Sectoral structure and localisation
Industry-specific characteristics are accounted for by considering two sectoral dummies that, in line with the Pavitt taxonomy, identify the high- and medium-high-technology sectors (pavitt mh) and the low-and medium-low-technology sectors (pavitt ml ). Geographical charac-teristics are captured by four regional dummies (nwest, neast, centre,
south), reflecting a firm’s location in the north-west, north-east, central
or southern regions of Italy.
Additionally, we consider the cr5 ratio to capture the SCP mech-anism described in Section 2 and the ratio of the sectoral number of technological-innovating firms to the total number of firms in that sec-tor (sect inntech). Descriptive statistics on the full set of variables are reported in Table 2.
4
The empirical model
We model productivity and profitability using an empirical specifi-cation that can be derived from an augmented production function and a profit function.
In particular, productivity, which is defined in terms of real value added per employee, may be derived from equation 1, assuming con-stant returns to scale9.
8This variable is available from the Statistical Register of Active Businesses (ASIA).
9One can specify this equation without imposing constant return to scale. We also estimated such a specification, which provides, however, similar results in terms of capital and shifting factor parameters. A Wald test for constant returns to scale is rejected, but returns to scale are only slightly increasing. Given these issues, we prefer a specification that enables us to explicitly consider the capital deepening factor - which may include a firm’s innovative attitude - as a determinant of productivity. Otherwise, we would have had to consider capital and labour separately, thus losing such an interpretation.
yit= ait+ βkit+ uit (1)
where y is the log of per capita real value added of firm i, k is the log of physical capital per employee, and aitis a shifting factor that
de-pends on a firm’s attitude towards technological and non-technological innovation and R&D effort. This latter factor also depends on other firms’ characteristics that may be relevant in shifting productivity. uit
is a one-way error component:
uit= µi+ ϵit (2)
where:
µi∼ IID(0, σ2u) and ϵit∼ IID(0, σϵ2) (3)
are independent of each other and themselves. In addition, the error term ϵitis assumed to be white noise, that is:
E(ϵit, ϵis) = 0 for t̸= s (4)
We account for the persistent innovative attitude of a firm by adopt-ing the definition described in the previous section, i.e., a firm is con-sidered a persistent innovator - from both the strict technological and complementary perspectives (thus including non-technological innova-tion) - if it has adopted such innovations in at least two consecutive innovation surveys. The persistent R&D effort may be described in the same way, thus defining a persistent R&D firm as one that has under-taken R&D activities over at least two consecutive surveys. We can therefore use two different dummy variables to represent a firm’s per-sistent innovative attitude from both an innovation input and output perspective10.
In addition, aitdepends on a firm’s specific characteristics, i.e., age,
being part of a group, sectoral innovative characteristics and location. Thus, we can define ait as follows:
ait= γ0+ γ1Iit+ γ2Xit (5)
where Iitrepresents a firm’s innovation attitude and Xitis a vector
of firms’ additional characteristics that may affect productivity.
The profitability equation is derived while accounting for both tra-ditional SCP effects and firm efficiency view considerations. Addition-ally, we account for the role of innovation by considering its effect on productivity and, through the latter, on profitability.
Thus the empirical specification may be represented as follows:
yit= γ0+ γ1Iit+ γ2Xit+ βkit+ τ Tt+ uit (6)
rosit=α0+ α1yit+ α2cr5it
+α3levit+ α4internit+ α5sect inntechit+ vit
(7)
where Tt is a time dummy common to every firm and refers to a
three-year time span and vitis a one-way error component.
From equations 6 and 7, it appears that the model may be thought of as a recursive system because the matrix of endogenous variables is triangular. Productivity does affect profitability and not vice-versa. In this case, OLS estimates are appropriate, provided that the model is also diagonal recursive, i.e., stochastic disturbances are not corre-lated11.
Specifically, the productivity equation includes the following ex-planatory variables:
- a dummy variable reflecting a firm’s attitude towards persistent (occasional) innovation (pers tech, pers tech ntech, tech, tech ntech, depending on the specific case), which is included in the I vector of variables in equation 7;
- another dummy variable that is also included in the I vector, re-flecting whether a firm has persistently (occasionally) undertaken R&D activities (pers r&d or r&d ). This variable also reflects a firm’s absorptive capacity, as discussed in Cohen and Levinthal (1990), and its attitude towards sustaining this capability over time;
- physical capital deepening (k );
- sectoral innovation characteristics (pavitt mh and pavitt ml );
11We also estimated a SURE model to account for such a correlation. The results are very similar to the OLS estimates, thus suggesting that such a correlation is feeble and that the use of OLS is therefore appropriate.
- localisation (nwest, neast, centre and south) and other firm-specific characteristics (age and gp).
All variables except for physical capital may considered shifting fac-tors for a firm’s production function, as we have previously discussed.
The explanatory variables in the profitability equation represent, on the one hand, the SCP mechanism (industry concentration) and, on the other, firms’ characteristics related to subjective efficiency (leverage), the ability to sell products on international markets and productivity. This latter variable also reflects a firm’s ability to compete through innovation, as productivity is crucially affected - as shown in equation 6 - by a firm’s innovative attitude12.
We also include a sectoral variable to reflect the possible effects on profitability related to the number of innovative firms in each industry. This is a proxy for new technological opportunities brought about by the increase in an industry’s technological knowledge. In this frame-work, two different mechanisms are operational. On the one hand, we can have a positive effect as an increasing number of sectoral innovators increases a firm’s probability of introducing an innovation (epidemic effect) (Mansfield, 1968). This fact may have a positive effect on prof-itability. On the other hand, this information effect may be offset by a competitive mechanism that implies that the number of competitors in an industry increases, thus squeezing the profits of firms operating in the same market (stock effect) (Karshenas and Stoneman, 1993). Thus, the explanatory variables entering the profitability equation are the following:
- market structure (cr5 ); - financial efficiency (lev );
- ability to sell products on international markets (intern); - productivity (y);
- technological spill-over (sect inntech).
12We have not included an innovative dummy reflecting a firm’s innovative atti-tude in the adopted profitability specification, as it was not significant in regressions in which it was included. Indeed, the productivity variable does incorporate a firm’s innovative attitude, which therefore determines the non-significant effect of such an innovative dummy variable.
5
Results
Table 3 presents the estimates over the entire period while account-ing for the fact that the time variable we are consideraccount-ing refers to a three-year time span according to the time interval of the CIS survey , as discussed in Section 3. The estimates that are presented in Table 3 refer therefore to contemporaneous relationships over a three-year time span.
We are aware of the possible endogeneity issue related to the innova-tive variables. In the Appendix, we present estimates that account for this issue by using predicted values of the innovation variables derived from logit models that explain innovation propensities in terms of firm and sectoral characteristics, following previous studies in which such determinants have been successfully used to derive a firm’s innovative behaviour (Bartoloni, 2012).
In addition we have estimated a model in which innovation is treated as predetermined, thus avoiding the possible endogeneity problem de-termined by the correlation between the error term uit and the
inno-vative variables. In other words, we introduce a calendar time lag be-tween innovation and the balance sheet information, in that the former precedes the latter. Thus the innovation variables refer to the conven-tional time t associated to the three-year-time span of the CIS Survey, whereas the economic performance variables refer to the time averages covering three years after the CIS Survey. Thus given a firm’s innova-tive behaviour at time t, we estimate productivity and profitability in a successive calendar time13. Such estimates generate results that are in line with those presented in Table 3, which therefore represent the evidence to be analysed.
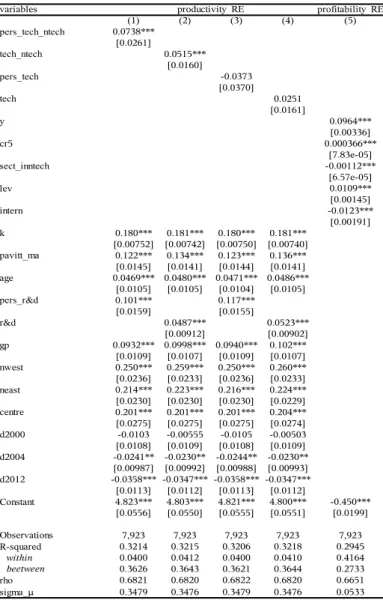
The estimates are derived by applying random effect (RE) estima-tion techniques to the system of equaestima-tions 6 and 7. Regarding the results, the productivity equation shows that a persistent technological and non-technological attitude increases productivity by nearly 7.4%, compared with firms that do not engage in such behaviour. Firms that introduce technological and non-technological innovations, but not sistently, exhibit a lesser increase in productivity. Thus, being a per-sistent innovator - using such a broad definition that incorporates non-technological innovation - provides a significant productivity premium. It is worth noting that such a premium vanishes if a firm is only a technological innovator, i.e., it does not introduce organisational or
Table 3: Firms’ economic performance - period 2000-2012
Notes. The variables y, k and age are in log values. Robust standard errors in
brackets. *** p<0.01, ** p<0.05, * p<0.1. Rho is an estimation of the contribution of unobserved heterogeneity to the total unexplained variance. Sigma µ is the
marketing innovations. This result does not depend on the fact that a firm is persistent in its technological innovation.
A positive effect of a firm’s persistent innovating attitude is provided by the impact of the R&D variable, reflecting such an attitude. The premium in terms of the productivity gain is more than 10%, compared with a corresponding premium for those firms that do not persistently undertake R&D of almost 5%.
Given these findings concerning the persistent innovation premium, we can discuss the other results in greater detail, concentrating on columns 1 and 2.
The capital-to-labour ratio (k ) implies an elasticity of almost 0.2, which is consistent with estimates presented in other empirical studies (Mairesse and Sassenou, 1991; Cr´epon et al., 1998).
We have not estimated the return on knowledge capital, as our choice has been to estimate an equation in which we show the impact on productivity of a persistent technological and non-technological at-titude, on the one hand, and of positive and persistent R&D expen-ditures, on the other hand, conditional on a set of firm-specific con-trol variables and the capital-to-labour ratio. However, these estimates provide an indirect measure of the impact of knowledge capital, which implies, on the whole, a significant and non-negligible productivity pre-mium comparable with the impact of the capital deepening variable (k ).
Another significant impact reflecting technological opportunities avail-able at the industry level is captured by the dummy variavail-able represent-ing an industry’s technological level (pavitt mh). Its impact is signifi-cant and relevant because it implies a productivity gain of more than 12% (column 1) for those firms operating in medium-high-tech sectors according to the Pavitt taxonomy.
The age and group dummy variables show a positive and signifi-cant effect, suggesting that older firms have a productivity premium of approximately 5% and that those firms which belong to a group experience a positive impact on their productivity of more than 9%.
Regional differentials are significant and reflect the disadvantage of the South, in that North and Centre Italy exhibit a gain in productivity that is, on average, more than 20%.
Regarding profitability, we can argue that the effect of the variable reflecting the SCP mechanism (cr5 ) - although significant - is mild, whereas the other variables reflecting firms’ efficiency condition are sig-nificant and show non-negligible impacts.
in-crease brings about a 0.1 p.p. inin-crease in profitability, thus signalling that internal resources are crucial in affecting a firm’s ability to finance its activity and then earn profits. In other words, as the cost of bor-rowing increases - in particular because of an increasing economy-wide risk caused by the financial crisis - internal resources play a significant role in affecting firms’ investment decisions, as suggested by the pecking order theory (Myers and Majluf, 1984).
A negative sign, i.e., a condition in which highly indebted firms earn higher profits, is plausible but prevailing in financial market conditions in which risk is relatively low and a firm’s external debt may amplify the potential gain from investment.
The intern dummy variable represents a proxy for a firm’s interna-tionalisation propensity. Its impact is negative and significant but very limited (0.01 p.p.). This evidence suggests that firms that sell products on international markets earn profits slightly lower than those earned by firms that do not internationalise. This observation may be contro-versial, as one would expect the opposite result, i.e., a positive sign on the coefficient of this dummy variable. However, one can argue that operating on international markets implies additional costs that may be not fully compensated by the potential increase in revenues that the internationalisation process generates.
Table 4: Marginal effects on performance for persistent conjunct inno-vators (selected variables)
Notes. Recall that profitability (ros) is a ratio, whereas productivity (y) is
The sect inntech variable shows a very mild and negative impact on profitability, thus signalling that the previously mentioned technologi-cal competitive mechanism may prevail, although its effect is feeble. Table 5: Persistent vs. occasional innovators: fitted values and sample means
Notes. y and ros: sample means; ˆy and ros: fitted values.ˆ Fitted values for productivity referring to only technological innovators are not reported as the cor-responding dummy variables are not significant in the estimated equations.
Productivity, which reflects both a firm’s efficiency characteristic and a technological attitude, positively enters the profitability equa-tion. Highly productive firms receive a premium in terms of profits corresponding to 0.9 p.p. when productivity increases by 10%.
In the adopted specification we have not included, a dummy vari-able reflecting the persistent attitude of firms in introducing technolog-ical and non-technologtechnolog-ical innovation, as this variable is not significant when included. It does significantly affect productivity, and through this route it indirectly affects profitability. With reference to comple-mentary innovation (i.e., technological and non-technological) we can observe the difference in productivity and profitability between persis-tent and non-persispersis-tent innovating firms by analysing the data from sample means and fitted values of the regressions (Table 5).
Firms that are persistent innovators experience an average produc-tivity that is nearly 15% higher with respect to firms that innovate but not persistently. The difference is higher if one considers the average productivity of firms, which also includes non-innovating firms. It is worth noting that such a positive difference is confirmed in comparison with the average productivity of firms that persistently introduce only technological innovation (+16.9%), thus underlining - as suggested by
the estimates - the relevance of the entire process of innovation that necessarily includes new organisational practices and market-oriented behaviour.
This pattern is also confirmed in terms of profitability, in that persis-tent technological and non-technological innovators exhibit an average profitability that is higher than that of occasional and only technolog-ical persistent innovators.
6
Conclusions
We have presented an empirical model of the determinants of a firm’s productivity and profitability that has enabled us to ascertain the role of factors related to technological and non-technological in-novations. In addition, we have underlined how such activities - if undertaken persistently - provide a significant additional increase in a firm’s productivity and profitability.
On the contrary, technological innovation alone does not have a significant effect on firm performance. This finding emphasises the relevance of the innovation process, in that skills, learning, organisa-tional adjustments and market orientation- together with technologi-cal innovation- determine a firm’s performance. Specifitechnologi-cally, we find that the productivity premium for those firms that persistently intro-duce complementary innovations (technological and non-technological) is more than 7%. Firms that do so only occasionally experience a reduc-tion in this premium of approximately 2 p.p. Firms that introduce only technological innovations do not experience any productivity premium. We also use an input measure of innovative knowledge, related to a firm’s R&D effort. The model’s empirical specification includes a dummy variable reflecting the fact that a firm’s has (persistently) un-dertaken R&D activity. The underlying productivity premium is signif-icant and large, particularly for those firms that persist in their R&D activity (more than 10%).
Capital deepening, i.e., the capital-labour ratio, exhibits a positive and significant impact that implies an elasticity of 0.2. This finding emphasises the role of physical capital accumulation, although a direct comparison with the impact of knowledge capital (R&D activities) can-not be derived, as we proxy for this effect by using a dummy variable. Additional firm characteristics are taken into account, suggesting that older firms experience a significant and non-negligible productivity
premium, which is also acquired by those firms that are part of a group. Sectoral characteristics related to innovative criteria (Pavitt tax-onomy) suggest an increasing relationship between productivity and technological levels.
We also analysed firms’ profitability by estimating a profit func-tion that summarises different mechanisms affecting profits. Thus, we have considered the traditional SCP and efficiency view mechanisms, together with the role played by a firm’s innovative attitude. The effect of the SCP mechanism (proxied by a concentration index) is negligible, although positive and significant, whereas other firm-level efficiency variables (leverage and the ability to sell products on international markets) show a negative mild impact. This latter effect in particu-lar - although negative - is feeble, suggesting that possible gains from internationalisations may be offset by increasing fixed costs associated with it, particularly for small and medium-sized enterprises.
According to the specified empirical model, productivity reflects a firm’s efficiency variable that also incorporates the impact of innovative advances - considered in their extensive definition - on profitability. Its impact on profitability is much larger than that represented by the traditional SCP mechanism, thus underlining the relevance of a firm’s innovative attitude in driving its profitability.
Appendix - Firms’ productivity with
endoge-nous innovative behaviour (I) - period
2000-2012
Notes. Standard errors in brackets. *** p<0.01, ** p<0.05, * p<0.1.
Following Bartoloni (2012), it is possible to estimate a firm’s innovation probability using logit models that incorporate explanatory variables causing different firms’ innovative behaviours. We use the following explanatory variables: firm’s size (size, number of employees, log values), financial efficiency (lev ), physical capital deepen-ing (K ), industrial group membership (gp), ability to sell products on international markets (intern), market structure (cr5 ), technological spill-over (sect inntech), and regional, sectoral and time dummies. We derive predicted probabilities that can then be used to predict the estimated events (pers tech, pers tech ntech, tech,
References
Aghion, P. and Howitt, P. (1992). A model of growth through creative destruction.
Econometrica, 60(2):323–351.
Allen, R. F. (1983). Efficiency, market power, and profitability in american manu-facturing. Southern Economic Journal, pages 933–940.
Bain, J. S. (1956). Barriers to new competition: their character and consequences
in manufacturing industries, volume 3. Harvard University Press Cambridge,
MA.
Bartoloni, E. (2012). The persistence of innovation: a panel data investigation on manufacturing firms. International Review of Applied Economics, 26(6):787–810. Bartoloni, E. and Baussola, M. (2009). The persistence of profits, sectoral hetero-geneity and firms’ characteristics. International Journal of the Economics of
Business, 16(1):87–111.
Bartoloni, E. and Baussola, M. (2016). Does technological innovation undertaken alone have a real pivotal role? product and marketing innovation in manufactur-ing firms. Economics of Innovation and New Technology, 25(2):91–113. Battisti, G., Mourani, A.-G., and Stoneman, P. (2010). Causality and a firm-level
innovation scoreboard. Economics of Innovation and New Technology, 19(1):7– 26.
Carpenter, R. E. and Petersen, B. C. (2002). Capital market imperfections, high-tech investment, and new equity financing. The Economic Journal,
112(477):F54–F72.
Cohen, W. M. and Levinthal, D. A. (1990). Absorptive capacity: A new perspective on learning and innovation. Administrative science quarterly, pages 128–152. Cr´epon, B., Duguet, E., and Mairessec, J. (1998). Research, innovation and
pro-ductivity: An econometric analysis at the firm level. Economics of Innovation
David, P. A. (1992). Knowledge, property, and the system dynamics of technological change. The World Bank Economic Review, 6(suppl 1):215–248.
Delorme Jr., C. D., Kamerschen, D. R., Klein, P. G., and Voeks, L. F. (2002). Structure, conduct and performance: a simultaneous equations approach. Applied
economics, 34(17):2135–2141.
Demsetz, H. (1973). Industry structure, market rivalry, and public policy. Journal
of Law and economics, 16:1–9.
Frantzen, D. (2003). The causality between R&D and productivity in manufac-turing: an international disaggregate panel data study. International Review of
Applied Economics, 17(2):125–146.
Geroski, P. A. (1989). Entry, innovation and productivity growth. The Review of
Economics and Statistics, pages 572–578.
Geroski, P. A., Machin, S., and Van Reenen, J. (1993). The profitability of innova-tive firms. RAND Journal of Economics, 24:198–211.
Geroski, P. A., Van Reenen, J., and Walters, C. F. (1997). How persistently do firms innovate? Research Policy, 26(1):33–48.
Hall, B. H., Lotti, F., and Mairesse, J. (2009). Innovation and productivity in SMEs: empirical evidence for Italy. Small Business Economics, 33(1):13–33.
Hawawini, G., Subramanian, V., and Verdin, P. (2003). Is performance driven by industry-or firm-specific factors? a new look at the evidence. Strategic
manage-ment journal, 24(1):1–16.
Jones, C. I. (1995). R&D-based models of economic growth. Journal of political
Economy, pages 759–784.
Karshenas, M. and Stoneman, P. L. (1993). Rank, stock, order, and epidemic effects in the diffusion of new process technologies: An empirical model. The RAND
Le Bas, C. and Latham, W. (2006). The Economics of Persistent Innovation.
Springer.
L¨o¨of, H. and Heshmati, A. (2002). Knowledge capital and performance heterogene-ity: A firm-level innovation study. International Journal of Production
Eco-nomics, 76(1):61–85.
Mairesse, J. and Sassenou, M. (1991). R&D productivity: A survey of econometric studies at the firm level. Working Paper 3666, National Bureau of Economic Research.
Ma˜nez, J. A., Rochina-Barrachina, M. E., Sanchis, A., and Sanchis, J. A. (2009). The role of sunk costs in the decision to invest in R&D. The Journal of Industrial
Economics, 57(4):712–735.
Mansfield, E. (1968). Industrial research and technological innovation; an econo-metric analysis.
Mohnen, P. and Hall, B. H. (2013). Innovation and productivity: an update.
Eurasian Business Review, 3(1):47–65.
Mueller, D. C. (1992). The persistence of profits. Springer.
Mueller, D. C. and Cubbin, J. (2005). The dynamics of company profits. Cambridge University Press.
Myers, S. C. and Majluf, N. S. (1984). Corporate financing and investment decisions when firms have information that investors do not have. Journal of financial
economics, 13(2):187–221.
Narver, J. C. and Slater, S. F. (1990). The effect of a market orientation on business profitability. The Journal of Marketing, 54(4):20–35.
Peltzman, S. (1977). The gains an losses from industrial concentration. Journal of
1
Printed by Gi&Gi srl - Triuggio (MB)
DIPARTIMENTO DI SCIENZE ECONOMICHE E SOCIALI
Driving business performance:
innovation complementarities
and persistence patterns
Eleonora Bartoloni
Maurizio Baussola
Quaderno n. 113/marzo 2016
COP Bartoloni-Baussola_113_2016.qxd:_ 15/03/16 08:31 Page 1Raymond, W., Mohnen, P., Palm, F. C., der Loeff, V., and Schim, S. (2009). Innovative sales, R&D and total innovation expenditures: panel evidence on their dynamics. CESifo Working Paper Series.
Roberts, P. W. (1999). Product innovation, product-market competition and per-sistent profitability in the US pharmaceutical industry. Strategic Management
Journal, 20(7):655–670.
Roberts, P. W. (2001). Innovation and firm-level persistent profitability: a schum-peterian framework. Managerial and Decision Economics, 22(4-5):239–250. Romer, P. M. (1990). Endogenous technological change. journal of Political
Econ-omy, 98(5).
Rouvinen, P. (2002). R&D-productivity dynamics: Causality, lags, and ‘dry holes’.
Journal of Applied Economics, 5(1):123–156.
Slade, M. E. (2004). Competing models of firm profitability. International Journal
of Industrial Organization, 22(3):289–308.
Stiglitz, J. E. (1987). Learning to learn, localized learning and technological progress. Economic policy and technological performance, pages 125–153. Stoneman, P. and Kwon, M. J. (1996). Technology adoption and firm profitability.