THE IMPACT OF OUTDOOR METEOROLOGICAL PARAMETERS ON THE
PERFORMANCE OF DYE-SENSITIZED SOLAR CELLS
Cristina Cornaro 1, 3, Angelo Spena 1, 3
Thomas M. Brown 2, 3, Aldo Di Carl0 2, 3, Andrea Reale 2,3 1 Department of Enterprise Engineering,
2Department of Electronic Engineering, 3CHOSE
University of Rome Tor Vergata Via del Politecnico 1, 0133 Rome, ITALY
ABSTRACT
The paper presents a first study of the impact of meteorological parameters on outdoor performance of DSC. A DSC cell has been tested in real operating conditions while located in the University of Rome Tor Vergata ESTER outdoor facility, where global, direct, diffuse and reflected solar radiation, air and cell temperature, wind speed and direction, humidity are continuously monitored.
Outdoor measurements have been performed on cloudless days at normal incidence of the incoming solar beam radiation, mounting the cell on a sun tracker.
Cell performances have been expressed in terms of solar radiation intensity and cell temperature. Thanks to the complete set of environmental data it has been possible to fully explain the temperature behaviour of the cell. Wind conditions have shown to play a fundamental role, together with radiation intensity.
INTRODUCTION
The great interests arising from the potentialities of Dye-Sensitized Solar Cell (DSC) technology [1, 2] has been mainly concentrated on the analysis of the cell performances in conventional indoor measurement conditions. Less attention has been paid to systematically monitoring the behaviour of DSC and organic cells in realistic outdoor operating conditions and few works can be found in the literature [3, 4). This is generally a key point for a correct evaluation of the actual performances of any photovoltaic technology. Especially for some innovative devices such as thin film, DSC or fully organic photovoltaic systems, indoor characterization at Standard Test Conditions (STC) can be a limiting factor.
This paper presents a first study of the impact of meteorological parameters on outdoor performances of a dye-sensitized solar cell while operating in the ESTER outdoor test facility [5] of the Environmental Technical Physics laboratories of the University of Rome Tor Vergata, in the framework of a systematic outdoor test activity that is going to be carried out at ESTER on dye sensitized solar cells and modules.
978-1-4244-1641-7/08/$25.00 ©2008 IEEE
EXPERIMENTAL SET UP
The cell has been tested on the ESTER meteorological station where global, direct, diffuse and reflected solar radiation, air and cell temperature, wind speed and direction, humidity are continuously monitored.
Fig. 1. Sun tracker with the cell support plate at ESTER facility.
The solar device has been mounted on a support plate fixed to the station sun tracker where a pyrheliometer measures direct solar irradiation and a shaded pyranometer measures horizontal diffuse irradiation (fig. 1). Global Irradiation on the test plane has been calculated with the simple geometrical model transposing the available data of the separate irradiation components (direct, diffuse and reflected). Combined standard uncertainty on radiation intensity measurements has been estimated as ±2%. A custom made and calibrated k-type thermocouple has been positioned on the rear side of the cell to monitor its temperature. Cell temperature measurement accuracy is ±1 °C.
First outdoor measurements have been performed on cloudless days at normal incidence of the incoming solar radiation beam durin~ the central hours of the day from 16th of April till the 19t of April 2007.
The cell has been maintained at MPP conditions using a Keithley 2612 source-meter and dedicated Labview ® VI routines and every minute current, voltage, power and cell
temperature have been measured. Every 15 minute I-V curve has been traced. During night the cell has been stored in the dark and I-V curves in indoor conditions have been traced before and after the outdoor exposition. I-V measurements are affected by ±1 % uncertainty due to instrumentation. Great care has been also devoted to the interlock between cell measurements and irradiation measurements from the meteorological station.
Dye-Sensitized Cell description
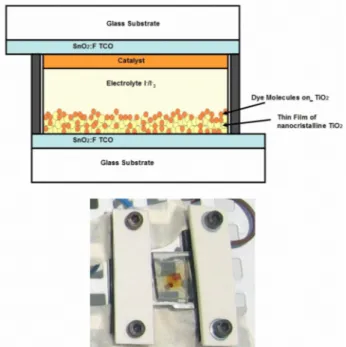
The scheme together with a picture of the cell built in the CHOSE laboratory is shown in fig. 2. The cell built is of the Graetzel type [1]. A nano-structured Ti02 film is deposited in the form of liquid suspension by means of blade coating on a TCO substrate (Rs
=
8 Ohm/square). After sinterization at 450°C the 10 Ilm thick Ti02 is dip coated with N719 Solaronix ® Ru-based dye for twelve hours. The counter-electrode is covered by aPt-catalyst film and the cell is assembled in the form of a sealed structure. The DSC cell is then filled with r/l3- liquid electrolyte solution (Solaronix R150®) through vacuum assisted liquid injection technique.G .... Substrate
G .... Substrate
Thin Film of nanocristailine 002
Fig. 2. Scheme of the DSC cell (top) and picture of the cell mounted on the test plate (bottom).
RESULTS Meteorological conditions
Climatic conditions and solar radiation availability for the days of test have been evaluated using data from the meteorological station. Fig. 3 shows the wind speed and average air temperature trends from 16th till 19th of April. Quite high temperatures values have been experienced especially during the first day of test; average wind speed
978-1-4244-1641-7/08/$25.00 ©2008 IEEE
in the prevalent direction reached 6 m/s in the central part of the days and only on the 19th of April a maximum of 3 m/s has been measured.
~~--~--r-~~~~~~-r---r--110 .-..26 9.-.. U 24 8 .!!1 ~
E
j!!227";;
:::lI20 6CUi!
18 58.
cu ~ c.. 16 4 "C ~ 14 3 ~ I- 12 2 ~ 10 8 0 4116 4116 4117 4117 4118 4118 4119 4119 4120 Time (days)Fig. 3. Average air temperature (AT) and wind speed (WS) in the prevalent direction for the days of test.
Fig. 4 shows global irradiation (GR) on a horizontal plane together with the direct (DR) and diffuse (SR) components on the same plane. All days where almost clear even if some instability in the solar irradiation trend can be observed due to some irregular cloud cover. During the central part of the day irradiation values as high as 800 W/m2 have been experienced on a horizontal plane.
1000 900 ~800 E ~ 700 600 II:
.2500
:!400
"C i!!300...
200 100o
4116I=~I
-ORI
,I'
~ 411711
/I
4118 Time (days)~\.",
...j 4119 ~,
4120Fig. 4. Global (GR), direct (DR) and diffuse (SR) irradiation on a horizontal plane for the days of test.
DSC performance and environmental parameters Cell performance has been expressed in terms of solar radiation intensity and cell temperature. Fig. 5 shows cell efficiency (black) and radiation intensity (red) versus time expressed in minutes from the beginning of the experiment. An average efficiency of approximately 5% has been observed. During the first day an efficiency decrease has been noted. After a partial overnight recovering a subsequent decrease can be observed in the second day, while the last day of test shows an unexpected efficiency growth. This behaviour does not
appear correlated just to the radiation intensity but rather to the cell temperature.
1200 8.0 - I n plane irradianee -11 7.5
~
!
1000 7.0 GI 800..,
c ,... 01 5.5e
'6~
600 4/16 4/17 4/18 4/19 4.5 400 4.0 0 200 400 600 800 1000 1200 Time (min)Fig. 5. In plane irradiance and cell efficiency versus time. Figure 6 shows a good correlation of the cell efficiency with the cell temperature trend.
45 7.0 40
~
35e
::I ~ 30 GI~
CLe
GI I- 25 20 o 200 400 600 800 1 000 1200 Time (min)Fig. 6. Cell temperature and efficiency versus time. The increase in efficiency of the last day could be due to the temperature increment of the cell. To confirm the link between the two parameters, data have been correlated at a fixed value of irradiance (910 W/m2) , as shown in fig. 7.
6.0
In Plane Irradiance = 91 OW/m'
5.5 R = 0.68 ,... "#. ~ 5.0 4.5 4.0 f-.---r-~""""'---.-.,...,~-r-... ~.,...,.---'-~~~ ~ ~ ~ U U ~ ~ ~ ~ ~ ~ Cell Temperature (OC)
Fig. 7. Correlation between cell temperature and efficiency
978-1-4244-1641-7/08/$25.00 ©2008 IEEE
The trend confirms an efficiency increase with increasing cell temperature. The linear correlation results in a quite good correlation coefficient of 0.68.
From fig. 6 it can also be noted a high variability of cell temperature with time. This behaviour can be explained by analysing the influence of wind conditions on the cell.
Figure 8 shows the cell temperature and wind speed for the days of test. Cell temperature originates from the heat balance between solar radiation that heats the cell surface and forced convection that provides to remove heat from the cell; when the wind speed is high a decrease in cell temperature is observed due to efficient heat removal by forced convection. The last day of measurements have experienced a low wind intensity (below 3 m/s) with consequent increase in cell temperature. 40 12
~
35 10 ~ I!! 8 ::Ii
CL III "C GI 30 6 CD CL CDe
CL {!!. 4"3
25.!
20+--r-'-~-r~-;~~r-~-r-~~ o 200 400 600 800 1000 1200 Time (min)Fig. 8. Cell temperature and wind speed versus time. Temperature measured on the cell surface can also be explained by analysing air temperature. As it can be noted from fig. 8 maximum wind intensity was almost constant during the first three days of test, consequently cell temperature should have reached approximately the same values for all days. Focusing on the 4/18 we can observe, instead, an initial abrupt cell temperature decreasing from 36°C registered on the 16th and the 1 ih to approximately
31°C even if the wind intensity was comparable with the previous days.
20
19 -.-loe(4/16) Ise (4/18) -.-lse(4/17) -.-Ise (4/19)
18 17
V'\,--if'.~
Ne
16~
15 ~'V-§. 14..,
13 .!! 12v·~·-"t\.-"'-r
-.
11 10./
24 26 28 30 32 34 36Cell Temperature (OC)
Fig. 9. Isc versus cell temperature for the days of test.
Part of this can probably due to the decreasing of minimum air temperature registered on the 18th (see fig. 3).
Some indications of cell initial degradation has been observed during the four days of test as shown in fig. 9. Black line shows Isc trend versus cell temperature for the first day in outdoor conditions: an Isc increase with increasing cell temperature can be observed. The second day shows an abrupt reduction in Isc with a following increase with increasing cell temperature. A sort of cell "recovery" is then observed for the last two days.
CONCLUSIONS
A DSC cell built by CHOSE laboratories has been tested in the outdoor ESTER facility at the University of Rome Tor Vergata. The first results obtained show the importance of environmental parameter control in order to explain the cell behaviour in real operating conditions. Wind intensity have shown to playa key role.
Cell efficiency of approximately 5% have been experienced by the cell during the outdoor exposure and an initial degradation has been observed with a subsequent recovery during the test.
At fixed in plane irradiance, efficiency increase has been observed with increasing cell temperature.
As further investigation, systematic outdoor tests are planned in order to get a complete characterization of the cell in the outdoor environment.
978-1-4244-1641-7/08/$25.00 ©2008 IEEE
AKNOWLEDGEMENTS
The authors wish to acknowledge ing. Pierluigi Braghese for the help in carrying on the measurements.
The work has been funded by Regione Lazio in the framework of the research activities of the Centre for Hybrid and Organic Solar Energy (CHOSE, www.chose.it).
REFERENCES
[1] M. Graetzel, "Applied physics: Solar cells to dye for", Nature, 421, 2003, pp.586-587.
[2] B. O'Regan, M. Graetzel, A low-cost, high-efficiency solar cell based on dye-sensitized colloidal titanium dioxide films, Nature, 353, 1991, pp.737-739.
[3] E.A. Katz, S. Gevorgyan, M.S. Orynbayev , F.C. Krebs. "Outdoor testing and long term stability of plastic solar cells", European Physical Joumal- Applied Physics, 2007, in press.
[4] T. Toyoda et aI., "Outdoor performance of large scale DSC modules", J. of Photochemistry and Photobiology A:
Chemistry, vol. 164,2004, pp. 203-207.
[5] A. Spena, C. Cornaro, S. Serafini, "Outdoor ESTER facility for testing of advanced technologies PV modules",