Alma Mater Studiorum - Universit `a di Bologna
DOTTORATO DI RICERCA IN ASTRONOMIA
Ciclo XXII
Settore scientifico-disciplinare di afferenza: Area02 - Scienze Fisiche
FIS/05 Astronomia e Astrofisica
YOUNG AND OLD STAR CLUSTERS IN M31:
AN HST VIEW
Presentata da: Sibilla Perina
Coordinatore Dottorato:
Relatore:
Ch.mo Prof. Lauro Moscardini
Ch.mo Prof. Francesco Ferraro
Co-Relatori:
Dott. M. Bellazzini
Dott.ssa L. Federici
Prof. F. Fusi Pecci
Tesi di Dottorato discussa alla presenza della commissione
costituita da:
Prof. B. Marano
Prof. R. Buonanno
Prof. A. Marconi
Prof.ssa E. Tolstoy
Prof. E. Brocato
Abstract
In this thesis I present a set of photometric studies of the
stellar populations in star clusters belonging to the nearby giant
spiral in Andromeda (M31), performed with instruments on
board of HST.
The core project is a HST-WFPC2 survey of candidate Young
Massive Clusters (YMC). Previous analyses had identified a
conspicuous set of bright candidate clusters (M
V
< −6.5) having
disk kinematics and displaying blue color and strong H
β
absorption lines typical of populations younger than 1 Gyr. It
remained to be established (a) if that sample of candidates
was dominated by real clusters or significantly contaminated
by spurious sources, and (b) what it was the actual age of the
clusters, an essential piece of information to establish if they
are significantly more massive than Galactic Open Clusters or
they are more akin to the YMCs found in the Magellanic Clouds.
To answer these questions HST-WFPC2 images of 19 candidate
YMC were obtained.
The sample appeared to be composed
almost entirely by real clusters (19/20). The reddening, age and
metallicity of the surveyed clusters were robustly estimated by
comparison of the observed Color Magnitude Diagrams (CMD)
and completeness-corrected Luminosity Functions with proper
theoretical models. The light profiles have been also derived and
the structural parameters of the clusters have been obtained by
fitting with models (as, for example King (1966) models). All the
bona-fide candidate YMC were found to have ages in the range
25-500 Myr. The sample has been complemented with six further
young clusters whose CMD was derived from archival HST-ACS
images that we reduced in a fully homogenous way with respect
to the main targets of the survey. The derived ages and the
integrated J,H,K magnitudes obtained from 2MASS were used
to estimate stellar masses ranging from ∼ 10
4
M
⊙
to ∼ 10
5
M
⊙
.
The young target clusters turn out to be significantly brighter
(and more massive) than Galactic OC in the same age range
and are similar to the YMCs found in the LMC, SMC and M33.
Eighty-nine low-luminosity clusters serendipitously falling into
the survey images were identified and studied.
A search of HST-ACS data for M31 cluster lead to a firm
re-classification for 63 objects; useful CMDs were obtained for 17 of
them, and new estimates of the age and metallicity was obtained
for these clusters.
Lastly, new deep HST ACS/HRC photometry revealed a
previously undetected blue plume of young stars at the center
of the dwarf elliptical galaxy NGC 205, a satellite of M31. With
these data we have investigated the star formation history in
the central 30
′′
of the galaxy, estimating a star formation rate of
Contents
1 Introduction and summary
1
1.1 Star cluster species . . . .
1
1.1.1
Young massive clusters . . . .
3
1.1.2
Cluster survival . . . .
5
1.2 The star cluster system of M31 . . . .
7
1.2.1
Globular clusters in M31 . . . .
7
1.2.2
Open clusters in M31 . . . 12
1.2.3
Blue Luminous Compact Clusters: YMC in M31 . . . 13
1.3 Summary of contents . . . 20
1.3.1
Part I: Young clusters in M31 . . . 21
1.3.2
Part II: Old globular clusters in M31 . . . 22
1.3.3
Part III: NGC 205 . . . 22
1.4 Publications . . . 24
2 Open Clusters in the log Age vs. M
Vplane.
25
2.1 Introduction . . . 25
3 An HST/WFPC2 survey of bright young clusters in M31. I. VdB0 a
massive star cluster seen at t≃ 25 Myr
29
3.1 Introduction . . . 30
3.1.1
The cluster van den Bergh 0 (VdB0) . . . 33
3.2 Observations and Data Reduction . . . 34
3.2.1
Artificial stars experiments . . . 36
3.2.2
Theoretical stellar models . . . 37
3.2.3
Reddening and Distance . . . 39
3.2.4
Accessible age range . . . 40
3.3 The CMD and structure of the cluster VdB0 . . . 40
3.3.1
Distribution of resolved stars . . . 40
3.3.2
Supergiant Stars . . . 43
3.3.3
Age and metallicity . . . 45
3.3.4
Integrated photometry, surface brightness profile and structural
parameters . . . 47
3.4 Summary and discussion . . . 50
4 An HST/WFPC2 survey of bright young clusters in M31. IV. Age and
mass estimates
55
4.1 Introduction . . . 56
4.2.1
Observations, data reduction and assumptions. . . 63
4.2.2
Radial selection and first classification . . . 63
4.3 Age and metallicity . . . 67
4.3.1
Clusters with bright MS (age< 200 Myr) . . . 67
4.3.2
Clusters with faint MS (200 Myr≤age≤ 500 Myr) . . . 69
4.3.3
Clusters whose MS is not detected (age> 500 Myr) . . . 70
4.4 Masses from ages and J,H,K integrated photometry . . . 71
4.4.1
Comparison with Galactic open clusters . . . 76
4.4.2
Comparisons with Caldwell et al. (2009) . . . 78
4.5 Summary and Discussion
. . . 80
4.5.1
The nature of M31 YMC . . . 82
4.5.2
Radial trends
. . . 85
4.5.3
Final remarks . . . 86
4.A RBC clusters serendipitously imaged in our survey . . . 87
4.B Other candidate M31 YMCs with archival HST imaging
. . . 88
5 An HST/WFPC2 Survey of Bright Young Clusters in M31 III. Structural
Parameters
93
5.1 Introduction . . . 94
5.2 Data and analysis methods
. . . 95
5.2.1
Cluster sample
. . . 95
5.2.2
Data reduction and surface brightness profiles . . . 96
5.2.3
Profile-fitting methods . . . 97
5.2.4
Profile-fitting: results . . . 98
5.3 Discussion: young and old clusters in M31 and other galaxies . . . 102
5.4 Summary and Directions for Future Work . . . 107
5.A Artificial cluster tests . . . 109
6 An HST/WFPC2 survey of bright young clusters in M31.
II.
Photometry of less luminous clusters in the fields
117
6.1 Introduction . . . 117
6.2 Observations . . . 118
6.2.1
The Images . . . 118
6.2.2
Cluster Identification . . . 118
6.3 Data Reduction . . . 120
6.3.1
Integrated Photometry . . . 120
6.3.2
Stellar Photometry . . . 123
6.4 Properties of the clusters . . . 124
6.4.1
The Cluster Catalog
. . . 124
6.4.2
The Integrated Cluster Color-Magnitude Diagram . . . 124
6.4.3
The Integrated Cluster Luminosity Function . . . 126
6.4.4
Individual Cluster CMDs
. . . 126
6.5 Ages and reddenimgs . . . 129
6.5.1
From the CMDs . . . 129
6.5.2
From the Integrated Cluster Photometry . . . 129
6.5.3
The Age Distribution . . . 131
7 HST/ACS colour-magnitude diagrams of M31 globular clusters
135
7.1 Introduction . . . 136
7.2 The targets . . . 136
7.3 Data reduction and the colour-magnitude diagrams . . . 138
7.3.1
Comparison with Fuentes-Carrera et al. (2008) photometry . . . 143
7.4 M31 vs. Galactic GCs: direct comparisons of the CMDs . . . 144
7.5 Comments on the individual clusters . . . 145
7.5.1
B008 = G060 . . . 145
7.5.2
B010 = G062 . . . 147
7.5.3
B220 = G275 . . . 148
7.5.4
B224 = G279 . . . 148
7.5.5
B255D
. . . 148
7.5.6
B366 = G291 . . . 148
7.5.7
B023 = G078 . . . 152
7.5.8
B088 = G150 . . . 152
7.5.9
B158 = G213 . . . 152
7.5.10 B225 = G280 . . . 152
7.5.11 B407 = G352 . . . 154
7.5.12 The candidate young clusters . . . 155
7.6 Clusters in Streams . . . 158
7.7 Summary and conclusions . . . 160
8 The young stellar population at the center of NGC 205
161
8.1 Introduction . . . 161
8.2 Data reduction . . . 162
8.2.1
Comparison with previous photometries . . . 163
8.3 Star formation history . . . 163
8.3.1
Recent star formation history . . . 164
8.4 Summary and discussion . . . 166
1
Introduction and summary
1.1
Star cluster species
The Milky Way (MW) has long been the main playground for studies of star
clusters. The first comprehensive discussion of the properties of star clusters was
given by Sir William Herschel in a series of papers published in the Phil. Trans.
R. Soc. London
. Herschel noted significant differences in the visual appearances
of clusters. He used the term globular clusters (GC) to describe the richest and
most concentrated of them (Herschel, 1814). The term open cluster (OC) emerged
during the early 20th century (Shapley, 1916) as a common label for all non-globular
clusters. Originally, this classification was purely morphological, based simply on the
visual appearance of a cluster through a telescope or on a photograph. Differences
in spatial distribution, with the OCs concentrated near the Galactic plane and the
GCs tending to avoid it, were recognized early on Shapley (1916); and references
therein). The developement of instrumentation as well as of the photographic and
spectroscopic techniques allowed us to compare star clusters regarding the
spectro-photometric properties of the constituent stars. However, even if the first CMDs
go back to the early 1910’s (Rosenberg, 1910; Shapley, 1915), it is only after Baade
(1935) resolved the nucleus of the Andromeda galaxy and differentiated between
stellar population I and II, that the CMD was been recognized universally as an
excellent criterion to discriminate between star clusters. Therefore, the distinction
between OCs and GCs as objects made of population I stars and population II stars
respectively, started in the 1930’s (even if we have to wait the post-war works with
the large reflectors on Mount Wilson and Palomar to locate the connection of the
observed GCs sequences with the main sequence well known in the OCs diagrams).
From this moment the star cluster nature will be defined by the age and the chemical
composition of the constituent stars, as well as the location into the galaxy and the
morphology of the cluster as a whole. Today we know that OCs are, in general,
metal-rich with metallicities similar to, or even exceeding, the solar value (Friel et al., 2002)
and are associated with the thin disk of our Galaxy, while the Milky Way GCs are
1.1. STAR CLUSTER SPECIES
associated with the spheroid (bulge/halo/thick disk) and have a bimodal metallicity
distribution, with both peaks at subsolar values (logarithmic iron abundance, relative
to solar, of [Fe/H] ≈ −1.5 and −0.5 dex; Zinn 1985). While the GCs are all ancient,
with ages on the order of 10
10years and a spread of perhaps a few ×10
9years
(Mar´ın-Franch et al., 2009), the OCs are mostly younger than a few ×10
8years (Wielen,
1971), although some older OCs are also known (Friel, 1995; Bragaglia & Tosi, 2006).
The lack of young GCs in the halo and bulge can be attributed to a cessation of star
formation in these components long ago, but the field stars in the Galactic disk have
a continuous range of ages and OCs are likely to have formed there also in the distant
past. The relative deficit of old OCs, therefore, illustrates that cluster dissolution is
important.
The globular cluster system (GCS) of the MW consists of over 150 known members
(Harris, 1996). The majority of them were discovered through optical searches, biased
against highly obscured objects. Since the Galaxy is estimated to have 160 ± 20 GCs
(Harris, 1991), a certain number of GCs may still be hidden behind the Galactic disk.
Recent all-sky near-infrared (IR) surveys (2MASS, Skrutskie et al. 1997; DENIS,
Epchtein et al. 1997; GLIMPSE, Benjamin et al. 2003) made it possible to carry out
a more uniform census of highly obscured Milky Way clusters (Borissova et al., 1993;
Ivanov et al., 2010; Reyle & Robin, 2002; Kurtev et al., 2007, 2008).
The known Galactic OCs are over 1000, but the true total may be up to ten times
higher than that. Current catalogues of OCs can only be considered reasonably
complete within
1 Kpc of the Sun (Piskunov et al., 2008), in fact, extinction by
interstellar dust in the Galactic plane, combined with the high stellar density along
the line of sight, strongly limit our ability to detect distant OCs.
With the progress of the observational studies the distinction between OCs and
GCs, that traditionally characterize the Galactic star cluster system, has become
increasingly blurred. Currently in the MW we know OCs quite bright and old to be
confused with the faintest GCs (e.g. Phelps & Schick 2003); on the other hand, some
GCs are very faint (e.g. Koposov et al. 2007) and, at least one, Palomar 1, has an age
consistent with the OCs age distribution (Sarajedini et al., 2007b)
1. In Figure 1.1 the
luminosity distribution of MW GCs and old MW OC are compared. Moreover, in even
the nearest external galaxies (the Magellanic Clouds, M31 and the other Local Group
galaxies), this convenient dichotomy disappears. The Clouds for example, contain
small numbers of classically old, massive, metal-poor GCs as well as many analogues
of open clusters, but we also find numerous examples of high-mass, young clusters
that likely resemble GCs as they would have been closer to their formation time. This
new category of star clusters is commonly termed young massive clusters (YMC).
The launch of the
Hubble Space Telescope (HST) led to a revolution in this field.
With careful modeling of the
HST point-spread function, a typical cluster with a
half-light radius of ∼ 3 pc remains recognizable as an extended object out to distances of
at least 40 Mpc (Harris, 2009). This leads to a formidable increase in the number
of galaxies accessible to detailed study of their cluster populations also beyond the
Local Group.
Large number of objects with the properties expected of young globular clusters
was discovered in extragalactic starburst and merging galaxies (Holtzman et al.,
1992; Whitmore et al., 1999; de Grijs et al., 2005; Smith et al., 2007) which are
1However, it has to be recalled that catalogues for OCs typically collects data of widely variyng
1.1. STAR CLUSTER SPECIES
Figure 1.1: Integrated absolute V magnitude histograms of the MW GCs (red line, from the 2003 revision of Harris 1996) and of the MW OCs with a reported age & 1 Gyr (shaded green, from the WEBDA database).
experiencing vigorous star formation. These data suggest that the common physical
condition for the production of dense, young star clusters is a strong starburst. Where
cluster masses have been derived, they are often in the range 10
4− 10
6M
⊙or higher,
comparable to the most massive old GCs (Zhang & Fall, 1999; McCrady & Graham,
2007), with the lower end of the range usually being set by detection limits.
An increasing amount of data for normal spiral galaxies have also become
available. Young clusters in the mass range 10
5− 10
6M
⊙have been found in some
spirals (Larsen & Richtler, 2000; Larsen, 2004), showing that such objects are not
unique to starbursts and interacting systems, although they may be more common
there.
YMC are thought to be absent in the MW. It is only very recently that a few of
these objects have been observed in the direction of the Galactic center (Clark et al.,
2005; Figer, 2008; Messineo et al., 2009). Probably, their census is quite incomplete
due to observational selection effects.
1.1.1
Young massive clusters
In the previous section we have established that the MW star cluster system
separate out rather cleanly into the two classical subsystems: the open clusters and
the globular clusters, but in the external galaxies this dichotomy disappears.
When the only well studied GCS was that of the MW, it was generally thought
that this separation was because globular clusters were fundamentally different from
other star clusters, perhaps because of conditions in the early universe (Peebles &
Dicke, 1968; Fall & Rees, 1985). However, it is possible to produce this apparent
bimodality from clusters formed in a single process, with the same cluster initial mass
function. In this picture, cluster disruption mechanism, which are more effective at
1.1. STAR CLUSTER SPECIES
Figure 1.2: Evolution of a single-burst stellar population with a mass of 2 × 10⁵M
⊙. Absolute V
magnitude (upper panel) and (B-V) color (lower panel) are plotted versus age in Gyr. The general trend of brighter magnitudes and bluer colors is common to all stellar population models. This figure is specifically based on Maraston (1998, 2005) models with solar metallicity, Salpeter (1955) stellar initial mass function and intermediate horizontal branch morphology.
destroying low-mass clusters in particular because of two-body relaxation (Spitzer,
1958; Spitzer & Harm, 1958), would remove almost all of the low-mass older clusters.
If all clusters were born with similar cluster mass functions, than we would expect
to see the occasional high-mass young cluster. In fact, we do see these in other
galaxies.
Rather than representing distinct entities, OCs, YMCs and GCs may
represent regions within a continuous of cluster properties dependent upon local
galaxy conditions (Larsen, 2003).
The lifetime of a star cluster is dependent upon its mass and environment.
Most low-mass star clusters in the disk are rapidly destructed via interactions with
giant molecular clouds (GMCs) (Lamers & Gieles, 2006; Gieles et al., 2007). These
disrupted star clusters are thought to be the origin of much of the present field star
populations Lada & Lada (2003). Surviving disk clusters may then be regarded as
OCs or YMCs, depending upon their mass. Star clusters in the halo may survive
longer since they are subjected to more gradual dynamical processes of two body
relaxation and evaporation. The clusters which survive for an Hubble time – more
likely to occur away from the disk – are termed GCs (see also Krienke & Hodge 2007).
To date no known thin disk GCs have been identified in the MW.
Can YMCs be considered as proto-globular clusters? Predicting what GCs are
expected to look like when they are young is straightforward.
They should be
bright, blue and compact (e.g. Ashman & Zepf 1992). The compactness is a basic
characteristic of GCs, without which they would not survive within the tidal field
of their host galaxy for a Hubble time. The bright luminosity and blue color comes
from the fact that young stellar populations have massive stars, which are bright
and blue. The luminosity and color evolution can be predicted using models of stellar
1.1. STAR CLUSTER SPECIES
populations. As an example, Figure 1.2 shows the evolution with time of the absolute
V magnitude and (B-V) color for an instantaneous burst of star formation of mass of
2 × 10
5M
⊙, assuming a Salpeter (1955) stellar initial mass function and the models
of Maraston (1998, 2005), for solar metallicity and intermediate horizontal branch
morphology. This figure shows that young globular clusters were several order of
magnitude brighter and substantially bluer in the past. Precise predictions of color
and luminosity depend on the IMF and metallicity, but generally high luminosities,
blue colors, and compact sizes are identifying signatures of candidate young globular
clusters. It is clear that the presence of compact, young star clusters is a necessary
condition for the recent formation of GCs, even thought it is not a sufficient one. The
observational task is to determine if objects consistent with the properties of young
globular clusters are found in various galaxies, and then to determine if these objects
are likely to evolve to become GCs like those in the Milky Way or M31.
As introduced in Section 1.1, young star clusters with masses and compactness
typical of GCs are observed to exist not only in starburst and merging galaxies but
also in normal spiral galaxies with high star formation rates, then, the formation of
GCs, which was once thought to be limited to the earliest phases of galaxy formation,
appears to be continuing at the present time. Whether these YMCs will evolve to
become old GCs by the time they reach an age of 13 Gyr depends to a very large
extent on their environment, as we will see in the next section.
For a comprehensive and very recent review about YMCs, the reader is referred
to the work of Portegies Zwart et al. (2010).
1.1.2
Cluster survival
Star clusters evolve due to a number of dissolution mechanisms.
The most
precarious stage in the evolution of a star cluster may be soon after it has formed,
when short-term stellar evolutionary processes can lead to his disruption.
This
phenomenon is termed infant mortality, it is caused by the removal of gas left over
from the cluster formation process by stellar winds and/or the first supernovae, see
e.g. Lada & Lada (2003) and Bastian & Goodwin (2006). The star clusters that
survive the infant mortality phase are still subject to long-term destructive dynamical
processes. Bound star clusters in a tidal field lose mass due to internal and external
effects (Spitzer, 1987). The internal effects are
1. mass loss by stellar evolution (dominant in the first ∼ 10
8years);
2. evaporation. Stars in clusters experience two and three body encounters, in
which they can gain velocity, reach the escape velocity and leave the cluster.
The external effects are
1. galactic tides. Isolated clusters experience evaporation, but the presence of an
external gravitational field (due to the host galaxy) tends to make the process
more efficient (e.g. see the case of the GC Pal5 in Odenkirchen et al. 2003).
2. disk/bulge-shocking. Stars gain energy after crossing the high-density galactic
disk/bulge;
1.1. STAR CLUSTER SPECIES
The combination of these effects results in decreasing the cluster mass until
complete destruction. The time scale of disruption depends on the initial conditions
of the clusters, e.g. the stellar initial mass function and its concentration, and on the
tidal forces experienced by the cluster during its galactic orbit. Low-mass clusters are
particularly susceptible to evaporation and if they are formed in the disk experience
also external perturbations by spiral arms and by GMCs. These perturbations are
not present in the halo of a galaxy, where most of the GCs reside.
Theory predicts that the dissolution time of isolated clusters depends on their
initial mass, in that massive clusters survive longer than low mass clusters (e.g.
Spitzer 1958; Wielen 1985; Chernoff & Weinberg 1990; Gnedin & Ostriker 1997, and
reference therein). However, for cluster in a tidal field (the real case), the mass loss
rate is much higher and the lifetime shorter then for clusters in isolation since these
parameters depends also by the local conditions in the host galaxy. The condition
for tidal stability of a cluster is when the gravitational acceleration of its stars, that
is due to the matter belonging to the cluster, is much larger then the differential
acceleration felt by the stars themselves with respect to cluster center because of the
galactic potential. This condition can be written in term of density as
ρ
cl(x) > ρ
gal(R)
where the densities are the mean density within a sphere of radius R (for the
galaxy) and a radius x (for the cluster). The distance from the cluster center where
ρ
cl(x) = ρ
gal(R) is
r
t= R
p(m
3 cl/
M
gal(R)
where mcl
is the cluster mass, R is the cluster distance from the galactic center and
M
gal(R) is the mass of the galaxy enclosed within a sphere of radius R. r
tis the
cluster tidal radius that define the conventional limit between bound and unbound
stars. As a consequence, for clusters in a tidal field tdis
depends also on the cluster
density. As density and mass are correlated, the dependence of tdis
on density can be
conventionally expressed as a function of mass.
The first empirical determination of the lifetime of clusters in the MW is by
Oort (1958), who noticed the lack of clusters older then a few Gyr in the solar
neighborhood. Later, Wielen (1971) derived a mean dissolution time of 0.2 Gyr from
the age distribution of clusters. Since most of the observed clusters within about 1
Kpc from the Sun have a mass in the range of 10
2to a few 10
3M
⊙
, the value derived
by Wielen is for clusters in that mass range. Boutloukos & Lamers (2003) assume
that the disruption time of clusters, defined as tdis
= (dlnM/dt)
−1, depends on the mass
M as
t
dis= t
4× (Mcl
/
10
4)
γwhere M
clis the initial cluster mass (in M
⊙) and t
4is the disruption time (in yrs) of a
cluster with an initial mass of Mcl
= 10
4M
⊙. These authors found empirically that the
constant t
4differ greatly between regions in different galaxies, indicating that the
disruption time depends strongly on the local conditions in the host galaxy. Using
the results of N-body simulation (Baumgardt & Makino, 2003) Lamers et al. (2005)
shown that t
4is expected to scale with the inverse square root of the mean density
1.2. THE STAR CLUSTER SYSTEM OF M31
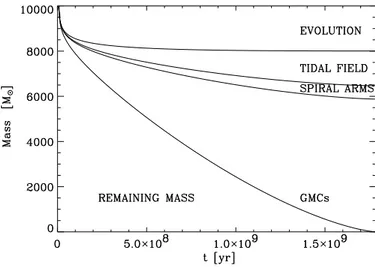
Figure 1.3: The mass evolution of a cluster with an initial mass of 104M
⊙in the solar neighbourhood.
The mass loss due to the four separate effects is indicated. Encounters with GMCs are the dominant dissolution effect in the solar neighbourhood. (From Lamers & Gieles (2006)).
disruption times of star clusters due to tidal interactions in different extragalactic
environment
t
dis= Cenv
(M
cl/
10
4M
⊙)
0.62(ρ
gal/
M
⊙pc
−3)
−0.5where Cenv
≃ 300 − 800Myr.
If encounters with GMCs or disk/bulge shocking becomes important, the
disruption times result even more shorter. Lamers & Gieles (2006), taking into
account stellar evolution, tidal stripping, shocking by spiral arms and encounters
with giant molecular clouds find tdis
= 1.7(Mi
/
10
4M
⊙)
0.67for clusters in the solar
neighborhood in the mass range of 10
2<
M
i
<
10
5M
⊙(see Lamers & Gieles 2006 for a
detailed discussion). The evolution of a 10
4M
sun
cluster according to these formulas
is shown in Figure 1.3 (Fig. 1 of Lamers & Gieles 2006). The figure shows the mass
lost by each mechanism independently. Encounters with GMCs are the dominant
dissolution effect in the solar neighborhood, contributing about as much as the three
other effects combined. Figure 1.4 (Fig. 2 of Lamers & Gieles 2006) shows the ages
of clusters when their remaining mass is 0 and 100 M
⊙as a function of the initial
mass. The figure also shows the dissolution times due only to the Galactic tidal field,
predicted by Baumgardt & Makino (2003) from N-body simulations.
1.2
The star cluster system of M31
In this chapter the main properties of M31 star clusters are summarized,
classifying them in three category in terms of brightness, age, spatial distribution
and kinematics: globular clusters, open clusters and young massive clusters.
1.2.1
Globular clusters in M31
Among the Local Group galaxies, M31 is our nearest bright spiral galaxy neighbor
and the most prominent member; moreover it hosts the largest population of globular
clusters(GCs).
1.2. THE STAR CLUSTER SYSTEM OF M31
Figure 1.4: The predicted dissolution times of clusters in the solar neighbourhood due to the combined effects of stellar evolution, tidal field, spiral arm shocks and encounters with GMCs, as a function of the initial mass. Full line: total dissolution time. Dashed line: time when the remaining mass is
100M⊙. Squares and dotted line: dissolution time due to stellar evolution and the Galactic tidal field only, predicted by BM03. Cross with error bar: the value of t4empirically derived by L05. (From Lamers
& Gieles (2006).
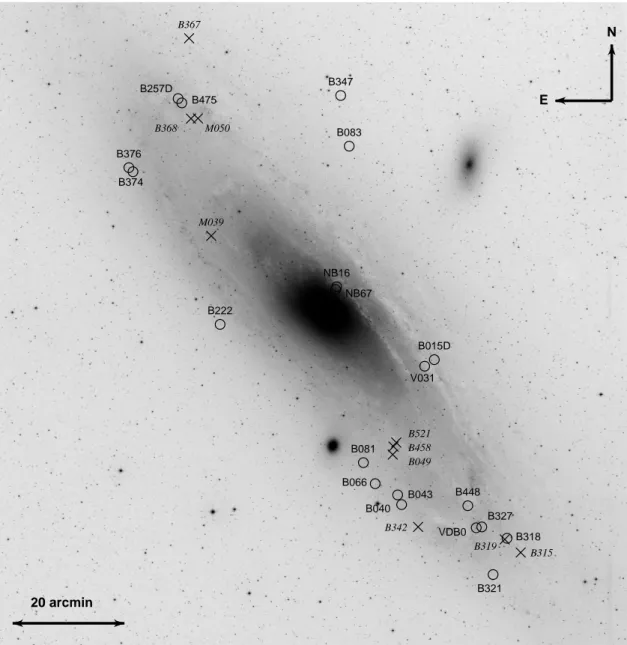
Hubble (1932), using the 100-inch telescope at Mount Wilson, identified 140
objects near M31 that, on photographic plates, had the appearance of “nebulous stars”
and proposed that they were star clusters associated with the galaxy itself. Since
Hubble’s pioneering observations, many studies have contributed to take inventory
of the M31 GCS (see review by Hodge 1992 and reference therein) and have revealed
an M31 GCS population that is more than three times the size of the MW GCS. As
part of a major photographic survey of cluster candidates around M31, the Bologna
Group published a compendium that included a large number of M31 GC candidates
having 14 ≤ V ≤ 19.5 mag within 3
◦of the M31 center.
This Bologna Catalogue
(Battistini et al., 1987, 1993) and the recently updated and expanded Revised Bologna
Catalogue
2(RBC, Galleti et al. 2004) have become widely used by later studies that
have continued the endeavour of adding positive identifications, photometry and
spectroscopy, for M31 GCs. The last RBC version (V4, 2009) contains 654 confirmed
star clusters and 606 candidate clusters (see Figure 1.6.
The distance to M31 is ∼ 780 kpc, it is large enough that the dispersion in
distance modulus within the GC system is relatively small [50 kpc corresponds to
δ
(M − m) ∼ 0.15 mag] at thet distance. Hence the GCs can be considered as lying
all at the same distance for many usefull purposes (e.g.
the derivation of the
M
V(HB)vs.[Fe/H] relation in Rich et al. 2005). Also, their almost stellar appearance
(10 pc correspond to ∼ 2.
′′6) allows an easy study of their integrated properties from
the ground. On the other hand, M31 is also close enough that individual stars in
GCs can be resolved and measured with the Hubble Space Telescope and with very
large ground-based telescopes equipped with powerful adaptive optics systems. At
present, riliable optical CMDs have been published for 44 old GCs in M31. Except for
one that was observed from the ground (MGC1, Martin et al. 2006), a good fraction of
these have been obtained with the HST/WFPC2 reaching well below the horizontal
branch (HB) (Ajhar et al., 1996; Rich et al., 1996; Fusi Pecci et al., 1996; Holland et
1.2. THE STAR CLUSTER SYSTEM OF M31
Figure 1.5: Upper panels: (a) ground-based (DSS2) image, (b) HST/WFPC2 20′′× 20′′image, and CMD
from WFPC2 data for the GC B012-G064 in M31 (from Rich et al. 2005). Lower pannels: (c) HST/ACS
24′′× 24′′image, and CMD from ACS data for the GC SKHB-312 in M31 (from Brown et al. 2004b). The green circle in the panel (a) has a radius of 10′′.
1.2. THE STAR CLUSTER SYSTEM OF M31
Figure 1.6: Left panel: Absolute integrated V magnitude distribution of the whole genuine star clusters in the RBC. Right panel: RBC’s star clusters in the dereddened two-color diagram (v − k)0vs. (b − v)0; the
blue circles are genuine and candidate YMCs with Hβ>3.5 Å.
al., 1997; Jablonka et al., 2000; Meylan et al., 2001; Rich et al., 2005; Perina et al.,
2009b). The better resolution and sensitivity of the ACS allowed even more accurate
CMDs at fainter limiting magnitudes (Brown et al., 2004b; Huxor et al., 2004, 2005,
2008; Galleti et al., 2006b; Mackey et al., 2006, 2007). In Figure 1.5 (upper panel) a
ground-based image from the Digitalized Sky Survey II (DSS2) of the M31 GC
B012-G064 (a) is compared with a WFPC2 image of the same cluster (b). From the ground
the cluster is unresolved, on the other hand the resolved stellar population cleary
visible in the high-resolution WFPC2 image allowed to obtain the good CMD on the
upper-right panel reaching the base of the red giant branch (Rich et al., 2005). In the
lower pannels an ACS image of the GC SKHB-312 (c) and the CMD from very deep
ACS data (lower-right panel) are shown.
In this framework, the GC system of the Andromeda galaxy (M31) plays a twofold
role: as a natural reference to compare with the Milky Way (MW) GC population and
as a fundamental test bed for the techniques to be applied to systems in more distant
galaxies (see Barmby et al. 2000; Puzia et al. 2002; Rich 2003; Barmby 2003; Galleti
et al. 2004; and references therein). Indeed, the comparison of the GC system of M31
and the MW has revealed both fundamental similarities and interesting differences,
whose complete understanding may have a deep impact on our knowledge of galaxy
formation and evolution (Hodge, 1992; van den Bergh, 2000; Morrison et al., 2004;
Beasley et al., 2004; Burstein et al., 2004).
Similar to the Milky Way, M31 appears to have at least two GC sub-populations,
a metal-rich, spatially concentrated sub-population of GCs and a more metal-poor,
spatially extended GC sub-population (Barmby et al., 2000; Perrett et al., 2002; Puzia
et al., 2005; Fan et al., 2008; Lee et al., 2008).
In Figure 1.7 (Galleti et al. 2009, Figure 15) the metallicity distribution (MD) of
the sample of M31 GCs studied by Galleti et al. (2009) is compared with its Milky
Way counterpart. These authors found that the highest peak in the M31 MD occurs
at [Fe/H]∼ −0.9, coinciding with the overall average of the sample < [Fe/H] >= −0.94,
1.2. THE STAR CLUSTER SYSTEM OF M31
Figure 1.7: Metallicity histogram for the M31 globular cluster system (top) and the MW GC system (bottom), reported for comparison. The dashed lines in the lower plot are the gaussian curves in the best fit models as found by the KMM algorithm (Ashman et al., 1994) for two subpopulations ([Fe/H]=-1.60 and -0.59).
significantly more metal rich than in the MW case, where the maximum is at
[Fe/H]∼ −1.5 and the overall mean is < [Fe/H] >= −1.30 (Harris, 1996). The M31
system appears also to have a much larger fraction of clusters having [Fe/H]> −0.5
(23% of the total sample) with respect to the Milky Way (7%). The distribution
is essentially unchanged also limiting the analysis to the subset of clusters having
errors in metallicity lower than ±0.3 dex (132 clusters; dotted histogram in the
upper panel of Figure 1.7). Looking at Figure 1.7, the MD of M31 GCs do not
present any obvious structure like the bimodality encountered in the GC system of
the Milky Way. Nevertheless the distribution for M31 clusters does not seem to be
well represented by a single Gaussian distribution. The same authors, comparing the
hypothesis of a multimodal underlying distribution with a unimodal representation
using parametric statistical tests, found that the distribution is likely not unimodal.
Also, again similar to the Milky Way GCs, the metal-rich GCs in M31 rotate and
show ”bulge-like” kinematics (Perrett et al., 2002; Galleti et al., 2009); however the
rotation amplitude is larger in M31 (∼ 220 Km s
−1than in the MW (∼ 147 Km s
−1)
(Zinn, 1985; Armandroff, 1989). On the other hand, unlike the case in the Milky Way,
the metal-poor GCs also show significant rotation (Huchra et al., 1991; Perrett et al.,
2002; Lee et al., 2008; Galleti et al., 2009). Figure 1.8 (Galleti et al. 2009, Figure
17) shows the positional and kinematical properties of M31 GCs divided into three
groups according to their metallicity, i.e. a metal poor (MP) group ([Fe/H] ≤ −1.0), a
metal intermediate (MI) group (−1.0 < [Fe/H] < −0.5), and a metal rich (MR) group
([Fe/H] ≥ −0.5). The left panels of Figure 1.8 show the spatial distribution of the
considered clusters in the canonical X,Y projected coordinate system (see Galleti et
al. 2004, and references therein), with X along the major axis of the galaxy. In
the right panels the radial velocity of the clusters (in the reference frame of M31) is
1.2. THE STAR CLUSTER SYSTEM OF M31
Figure 1.8: Left Panels: Spatial distribution of three metallicity groups GCs in M31. The ellipses have a semimajor axis of 15, 30, 45, 60 arcmin. Right Panels: Radial velocities vs. the projected distances along the major axis (X). The solid line shows a HI rotation curve from Carignan et al. 2006.
plotted versus the X coordinate and compared with the rotation curve of the HI disk
from Carignan et al. (2006).
1.2.2
Open clusters in M31
It has been realized since long time that M31 contains a large number of open
clusters roughly similar to those in our Galaxy. The first mention of an open star
cluster in M31 appears in Hubble’s pioneering paper (Hubble, 1929). However, a
great deal more attention has been paid to globular clusters in the past. Not only
the GCs are generally brighter and less restricted to the complex stellar disk, but
they are also more readily usable to answer certain questions about M31, such as its
distance, mass, chemical abundance and chemical history. The early observations of
the open clusters were obtained in the hope or thought that the clusters in question
might be globular. Hodge (1979) used the Kitt Peak National Observatory (KPNO)
4 m telescope to search for true open clusters. His was a global search, covering
1.2. THE STAR CLUSTER SYSTEM OF M31
all of the M31 disk as it was recognized at that time. The result was a catalog of
403 candidate open clusters, which were primarily young objects, as implied by the
fact that they usually appeared resolved on the plates. Subsequently, Hubble Space
Telescope (HST) images of some of them show that the sample was contaminated by
small OB association and asterisms (Williams & Hodge, 2001b). Three-color CCD
photometry of a selection of the cataloged clusters was carried out by Hodge et al.
(1987), showing that the clusters sampled are very young objects. However, the
crowding and the faint magnitudes of these clusters required the characteristics of
the HST to make reliable identifications and measurements. The most important
recent papers are that of Barmby et al. (2001) who identified 20 probable M31 open
clusters, that of Williams & Hodge (2001b) who found 79 small young star clusters
and the two of Krienke & Hodge (2007, 2008) who identified 571 new disk clusters;
these two surveys, using the WFPC2 and ACS on board of HST, scanned ∼ 4.9%
of the area of the M31 disk, suggesting that it should contain a large number of
star clusters with a wide range of observable properties (luminosity, size, color)
and a wide range of implied characteristics (mass, age, dynamical history). The
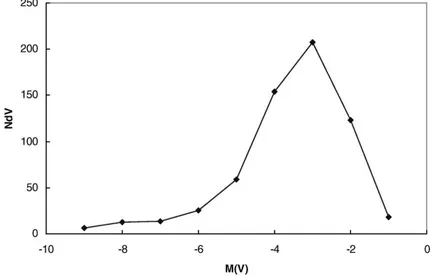
luminosity function of the clusters identified in these papers shows a turnover at
an absolute magnitude of Mv
= −3.0 in the magnitude range −1 . M
V.
−9 (see Figure
1.9). The integrated color-magnitude diagram shows a wide range in color for the
Figure 1.9: Integrated luminosity function of the M31 OCs studied in Krienke & Hodge (2007, 2008).
fainter clusters, representing a considerable range in age and reddening. The spatial
distribution shows a maximum density in the range 8 to 15 Kpc and the cluster
density is correlated with the distance from the nearest star-forming region. We
refer the readers to these papers for a detailed discussion of these results. Chapter
6 of this thesis reports about 82 newly detected open (disk) clusters in M31, similar
to those of Krienke & Hodge (2007, 2008).
1.2.3
Blue Luminous Compact Clusters: YMC in M31
Historical background
. The presence in the disk of M31 of stellar systems
similar to MW globulars in luminosity and shape but with integrated properties
typical of young stellar populations is known since long time.
1.2. THE STAR CLUSTER SYSTEM OF M31
Figure 1.10: The BLCCs G38 and G44 from the HST-WFPC2 observations by Williams & Hodge (2001a).
van den Bergh (1967, 1969), Searle (1978), and this class of objects then received
growing attention (Crampton et al., 1985; Cowley & Burstein, 1988; Elson &
Walterbos, 1988; King & Lupton, 1991; Bohlin et al., 1993; Barmby et al., 2000;
Williams & Hodge, 2001a; Beasley et al., 2004; Burstein et al., 2004), although a
systematic study was still lacking.
In particular, Elson & Walterbos (1988) noted 14 such blue clusters, not included
in the list of open cluster candidates by Hodge (1979), and better consistent with a
GC morphology. Their absolute luminosities spanned the luminosity range −9.5 <
M
V< −6.5, and their positions in a two-color diagram pointed to a possibly young
age. For ten of these objects, King & Lupton (1991) provided supplementary UBVR
photometry indicating a global luminosity around 3 × 10
4− 4 × 10
5L
⊙. Based on stellar
population models, their estimated age appeared to be less than a few 10
8yrs, with
a typical mass between 3 × 10
3and 5 × 10
4M
⊙
. If confirmed, these values indicate
that they are more massive than Galactic open clusters, but comparable to those of
young, rich globulars found in the Large Magellanic Cloud (Elson & Fall, 1985; van
den Bergh, 1991).
Bohlin et al. (1988, 1993), studying the UV-colors of a sample of 49 GC candidates
in M31, listed 11 objects classified as blue clusters based on their location in the
two-color diagram, and suggested that they are probably young. In the same line of
investigation, Barmby et al. (2000) noted that their M31 catalog of GC candidates
may be contaminated by several young obiects with B − V < 0.55 and they eventually
excluded 55 such objects from their analysis of old M31 clusters.
As already stressed long ago (Spinrad & Schweizer, 1972), the integrated
spectrum and color of a cluster, especially in the blue, are influenced by the metal
abundance and the position of the main sequence turnoff stars (MSTO) (in turn,
by the cluster age), by the morphology of the horizontal branch (HB), and, to a
lesser degree, by the overall luminosity function of its composing stellar population.
To disentangle the different effects it is thus very important to obtain the
color-magnitude distribution of the clusters. In this regard, Williams & Hodge (2001a)
obtained deep HST photometry of individual stars and CMDs for four of these BLCCs
leading to estimate ages in the range 60-160 Myr and metallicity from solar to 2/5
solar. This clearly supports the evidence that the exceedingly blue integrated colors
of BLCCs are direct consequence of their remarkably young age.
Beasley et al. (2004) reached similar conclusions for eight BLCCs by comparing
high-quality, low-resolution spectra of a sample of M31 clusters with similar data for
1.2. THE STAR CLUSTER SYSTEM OF M31
Figure 1.11: Left panel: Two-color diagram of globular clusters for Local Group galaxies. Data for M31 globulars are from the RBC (Galleti et al. 2004; open dots), those for the Milky Way are from Harris (1996; solid dots), LMC GCs are from van den Bergh (1981; crosses) and M33 data are from Chandar et al. (1999; squares). Also reported in the plot are the M31 open clusters from the Hodge (1979) catalog (solid triangles). All the data have been reddening-corrected assuming E(B − V) = 0.11 for M31, 0.13 for LMC and 0.07 for M33. MW globulars have been corrected according to Harris (1996). Vertical line marks the reference value (B − V)0= 0.45, adopted for BLCC selection. Labeled
clusters are those observed by William & Hodge (2001) with HST. The arrow is a reddening vector for
E(B − V) = 0.1 mag. Right panel: The M31 GC distribution in the Hβ vs. ∆ index plane. Reference curves
for log g = 5 stars of different temperature (from 5000 to 50 000 K) and metallicity ([Fe/H] from –2 to solar) are reported. Color-selected ((B − V)o≤ 0.45) BLCCs are singled out (solid dots). The orizonthal line define the Hβ = 3.5 threshold for the BLCCs selection. For comparison, triangles show the Brodie & Hucra (1990) data for MW GCs, while thick solid lines are the locus for the Buzzoni (1989) SSP models with t = 15, 8 and 2 Gyr (in the sense of increasing Hβ), red HB morphology, and metallicity
[Fe/H] = −2.27 − +0.22. Typical error bars for M31 data are reported top left.
MW and Magellanic Clouds globulars. Burstein et al. (2004) reported a global sample
of 19 BLCCs in M31, including 13 “young” objects from the Barmby et al. (2000) list
3
.
The Fusi Pecci et al.
(2005) results
.
Fusi Pecci et al.
(2005, hereafter
F05) have studied the properties of a sample of 67 very blue and bright clusters
in M31 extracted from the Revised Bologna Catalog, selected according to their color
[(B − V)
o≤ 0.45] and/or to the strength of their H
βspectral index (H
β≥ 3.5 ). F05 found
that these clusters, that they termed Blue Luminous Compact Clusters (BLCCs), are
fairly numerous in M31 (15% of the whole GC sample), they have positions and
kinematics typical of thin disk objects, and, in spite of a GCs morfology (they are
bright and compact objects) their colors and spectra strongly suggest that they have
ages (significantly) lower than 2 Gyr (see Figures 1.10 and 1.11).
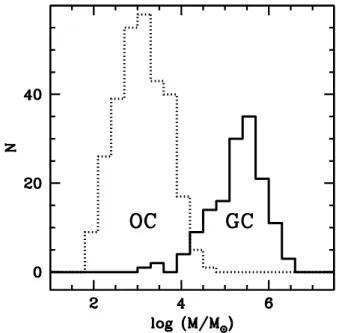
While the luminosity range spanned by BLCCs (−6.5 . M
V.
−10.0) is comprised
within that of ordinary globular clusters (see Figure 1.12), the age distribution of
present-day MW globulars is obviously not consistent with the young age of BLCCs
(200 Myr ≤ age ≤ 2 Gyr, as obtained from integrated colors and spectra). On the
other hand, Galactic Open Clusters (OC) are comparably young but they appear
3Barmby et al. (2000) classified these clusters as possibly young because of the strong Balmer
1.2. THE STAR CLUSTER SYSTEM OF M31
Figure 1.12: Comparison of the Luminosity Function (LF) of M31 BLCCs (filled histogram, upper panels) with: (left panel) the LF of the OC of the Milky Way in the same age range; (right panel) the LF of LMC globular clusters in the same age range.
less luminous than BLCCs (see Figure 1.12). The only Galactic OCs that reach
the luminosity range covered by BLCCs are younger than 30 Myr (e.g., they are
clusters whose luminosity budget is dominated by a few massive stars, much different
from the BLCCs studied by Williams & Hodge (2001a) and showed in Figure 1.10).
Conversely, the luminosity range spanned by M31 BLCCs is very similar to that
covered by LMC YMCs (see Figure 1.12) and by the few MW YMCs recently identified
in the direction of the Galactic center (see Section 1.1.1). Fusi Pecci et al. (2005,
hereafter FP05) concluded that if most of the BLCCs have an age & 50 − 100 Myr
they are likely brighter/more massive than Galactic open clusters of similar ages,
thus they should belong to a class of objects that is not present, in large numbers,
in our own Galaxy. On the other hand, if BLCCs are younger than this, they should
be interpreted as the counterparts of young open clusters of the Milky Way, since
in this case their large brightness is essentially due to the young age and not to
high masses. Unfortunately, the accuracy in the age estimates obtained from the
integrated properties of the clusters is not sufficient to determine their actual nature
on an individual basis, i.e., to compare their total luminosity with the luminosity
distribution of OCs of similar age (see Bellazzini et al. 2008 and references therein).
The color-magnitude diagram of individual stars is the only observational tool that
can eventually establish the real nature of these objects on the basis of accurate age
estimates.
An important question that arise from the FP05 work is how BLCCs would
appear in the future, and in particular if they will look like classical globulars
when they will become comparably old.
FP05 made a tentative prevision using
theoretical evolutionary models. If we assume BLCCs to consist of plain simple
stellar populations (SSP), then one should expect their luminosity to fade with
time, as far as the composing stellar population becomes older and photometrically
1.2. THE STAR CLUSTER SYSTEM OF M31
Figure 1.13: The effect of evolution on BLCC luminosity. The dotted histograms trace the expected BLCCs luminosity function as predicted at t = 10 Gyr, according to different values assumed for the
currenttypical age of these objects (as labeled on the x axis). We assume a SSP evolution, according to Buzzoni (1989) synthesis models, for a Salpeter IMF and a (roughly) solar metallicity. For comparison, the observed luminosity distribution of MW GCs is reported on the right vertical axis, derived from Harris (1996) (shaded histogram), while the indicative luminosity range for M31 open clusters is also sketched (thick solid bar on the right) according to Hodge (1979).
dominated by low-mass stars. In particular, for a SSP of roughly solar metallicity
and Salpeter IMF, evolutionary population synthesis models predict a quite tuned
luminosity change such as LV
∝ t
−0.9over a wide range of age (e.g. Tinsley & Gunn,
1976; Buzzoni, 1995a). According to the assumed age of present-day BLCCs, then
one could infer the expected luminosity of these clusters at t = 10 Gyr and more
consistently compare with the observed luminosity function of old MW GCs. The
results of this illustrative exercise are summarized in Figure 1.13; it is evident from
the figure that, in the more likely case of a current age in the range 10
8− 10
9yrs,
BLCCs would end up at 10
10yrs populating the low-luminosity (and low-mass) tail
of current MW GC distribution. On the contrary, in the more extreme (and quite
unlikely) case of a current age of only a few 10
7yrs we would be left at 10 Gyr
with extremely faint BLCCs, certainly out of the range of typical MW GCs. Finally,
if nowadays BLCCs are already evolved systems (i.e. a few Gyr or older), then at
t = 10 Gyr their expected luminosity will not change so much and their distribution
would maintain them fully consistent with the bulk of both M31 open clusters and
MW GCs.
A fair assessment of the present-day age distribution of this kind of
clusters is therefore a mandatory step to consistently locate them in the appropriate
evolutionary framework.
The contamination problem
. In addition to the question of the masses and
ages of these BLCCs, it has been suggested that the BLCC samples in M31 may suffer
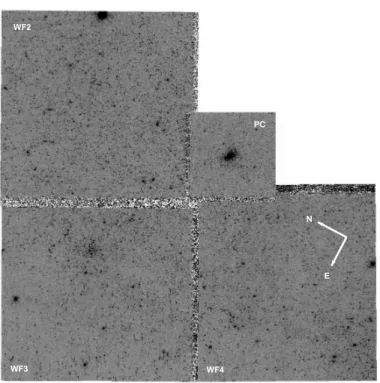
from significant contamination by spurious sources. Cohen et al. (2006, hereafter
C06) presented NIRC2@KeckII Laser Guide Star Adaptive Optics (LGSAO) images of
six candidate BLCCs (see Figure 1.14). Their K
′very-high spatial resolution images
revealed that in the fields of four candidates there was no apparent cluster. This
led C06 to the conclusion that some/many of the claimed BLCC may in fact be just
asterisms
, i.e. chance groupings of stars in the dense disk of M31. However, the
use of the near infrared K
′band (required by the LGSAO technique) may be largely
1.2. THE STAR CLUSTER SYSTEM OF M31
insensitive to very young clusters that are dominated by relatively few hot stars,
which emit most of their light in the blue region of the spectrum. Hence, the imaging
by C06 may be inappropriate to detect such young clusters (see, for example, the
detailed discussion by Caldwell et al. (2009) and Figure 1.15). In any case, the study
by C06 suggests that the true number of massive young clusters of M31 may have
been overestimated.
Figure 1.14: LGSAO K’ images from the Keck Telescope are shown for 6 putative very young or young globular clusters in M31. The field shown for each is approximately 10 arcsec on a side with a pixel scale of 0.010 arcsec/pixel. (From Cohen et al. 2006).
Beyond FP05: an HST survey
. The questions put forward by FP05 and C06
about the nature of BLCCs are the starting point of the main part of this thesis
regarding the YMCs in M31.
In order to ascertain the real nature of the BLCCs studied by FP05 we have
performed a survey with the Hubble Space Telescope (HST) to image 20 BLCCs in
the disk of M31 (program GO-10818, P.I.: J. Cohen). The key aims of the survey are:
1.2. THE STAR CLUSTER SYSTEM OF M31
Figure 1.15: The disputed cluster B314-G037. The LGS I band image is shown on the left, next to the Cohen et al. (2005) LGSAO image, taken in the K′ band. The I band reveals the star cluster clearly (arrow). For young clusters, red supergiants would dominate the light at infrared wavelengths and the hotter mainsequence stars would appear much fainter. (From Caldwell et al. 2009).
the fraction of contamination of BLCCs by asterisms. The high resolution power
of the WFPC2 allow us to clarify this point by the simple inspection of the
images, in which the cluster population is resolved into stars.
2. to obtain an estimate of the age of each cluster from the color-magnitude
distribution of the resolved stars in order to estimate the mass. The short
exposition time of our images (400 s) is sufficient to clarify the nature of these
young objects. Ultimately the survey aims to provide firm conclusions on the
existence of a significant population of BLCCs (YMCs) in M31, in addition to
OCs and GCs.
Figure 1.16: Integrated V mag and total mass as a function of age for Galactic OCs (from the WEBDA database) plotted as filled circles, and for Galactic GCs (MV from Harris (2003); the ages have been arbitrarily assumed to be 12.0 Gyr for all the clusters) plotted as × symbols. The continuous lines are fixed-stellar-mass models from the set by Maraston (1998, 2005) for SSPs of solar metallicity, with a Salpeter’s Initial Mass Function (IMF) and intermediate Horizontal Branch morphology. The two dashed lines enclose the luminosity range of BLCCs. The outlier OC at log Age≃ 9.0 is Tombaugh 1.
Figure 1.16 shows a fundamental diagnostic diagram largely used across this
thesis (see Chapters 4 2, 3 and 4). In the plane Mv
vs. Log Age we can compare
1.3. SUMMARY OF CONTENTS
BLCCs with Galactic open clusters (blue circles; data taken from the WEBDA
database
4), with Galactic globular clusters (red crosses; from the latest version of
Harris (1996) catalog assuming a uniform age of 12 Gyr, a reasonable approximation
for our purpose), and with a grid of SSP models with solar metallicity and Salpeter’s
IMF from the set by Maraston
5(continuous lines; Maraston (1998, 2005)). As a SSP
ages massive stars die while the mass of the most luminous stars decreases (passive
evolution). Keeping the total mass fixed, the luminosity of the population fades and,
as a consequence, the stellar mass-to-light (M/L) ratio increases. The continuous
lines plotted in Figure 1.16 describe the passive evolution of SSPs of various (stellar)
masses: under the adopted assumptions the mass of a cluster of given age and M
Vcan
be read from the grid of iso-mass tracks. The path of the track passing through the
cluster shows what its luminosity will be in the future if the cluster did not lose stars
through dynamical processes. The dotted lines enclose the BLCCs luminosity range
(−6.5 . M
V.
−10.0). With CMD-based ages we can plot the candidate BLCCs in the M
vvs. Log Age plane and estimate their mass. As claimed by FP05, if BLCCs have an
age & 50 − 100 Myr they are likely brighter/more massive than Galactic open clusters
of similar ages, and following their passive evolutionary sequences they have the
possibility, in the future, to become classical old GCs, if dynamical effects are ignored.
As introduced in Section 1.1.2, the dynamical processes have a fundamental impact
on the cluster evolution. The effects of these processes on the target clusters will be
analysed in details in Chapters 3, 5 and 4.
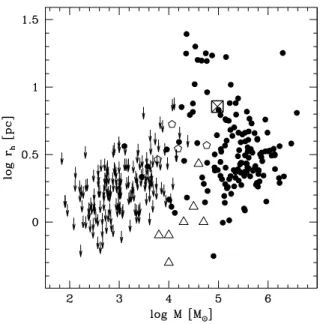
Figure 1.17: Left panel: half-light radius cumulative distributions of old globulars (red) and YMCs (blue). Right panel: Old globulars (black) and YMCs (blue) in the plane log rh vs. MV. Data are from Barmby et al. (2007, 2009).
1.3
Summary of contents
The various chapters of this thesis are grouped in three parts, which are
summarized in Sections 1.3.1, 1.3.2 and 1.3.3.
4http://www.univie.ac.at/webda/integre.html
1.3. SUMMARY OF CONTENTS
1.3.1
Part I: Young clusters in M31
The first part covers Chapters 2 - 6 of the thesis, and introduces an imaging
survey of possible YMCs in M31 performed with the HST/WFPC2, with the main aim
of estimating their age and their mass (see Section 1.2.3). In the various chapters
the data will be analyzed under different aspects.
In Chapter
2 we introduce an useful diagnostic diagram: the log Age vs.
integrated absolute magnitude (M
V) plane.
This diagram, and its near-infrared
version will be used in Chapter 3 and in Chapter 4 to estimate the mass of candidate
YMCs in M31 and to compare them with Galactic OCs in the same age range.
In Chapter 3 the details of the data reduction pipeline adopted on the whole
survey are presented and its application to the brightest among the targets, van den
Bergh 0 (VdB0), taken as a test case, is described. The reddening, the age and the
metallicity of the cluster were estimated by comparing the observed color magnitude
diagram with theoretical isochrones. The stellar mass of VdB0 is also estimated by
comparison with theoretical models. VdB0, with age ≃ 25 Myr and solar metallicity,
is significantly brighter (& 1 mag) than Galactic open clusters of similar age. Its
present-day mass (in the range ≃ 4 − 9 × 10
4M
⊙
), and half-light radius (r
h= 7.4 pc)
are more typical of faint globular clusters than of open clusters. However, given its
position within the disk of M31, it is expected to be destroyed by dynamical effects
within the next ∼ 4 Gyr.
In Chapter 4 we present the main results of the whole HST/WFPC2 survey.
From the inspection of these high resolution images nineteen of the twenty surveyed
candidates were confirmed to be real star clusters, while one turned out to be a bright
star. Point spread function fitting photometry of individual stars was obtained for
all the WFPC2 images of the targets, and the completeness of the final samples
was estimated using extensive sets of artificial stars experiments. We present the
color magnitude diagrams of the nineteen real clusters. The reddening, age, and
metallicity of the clusters were estimated by comparing the observed CMDs and
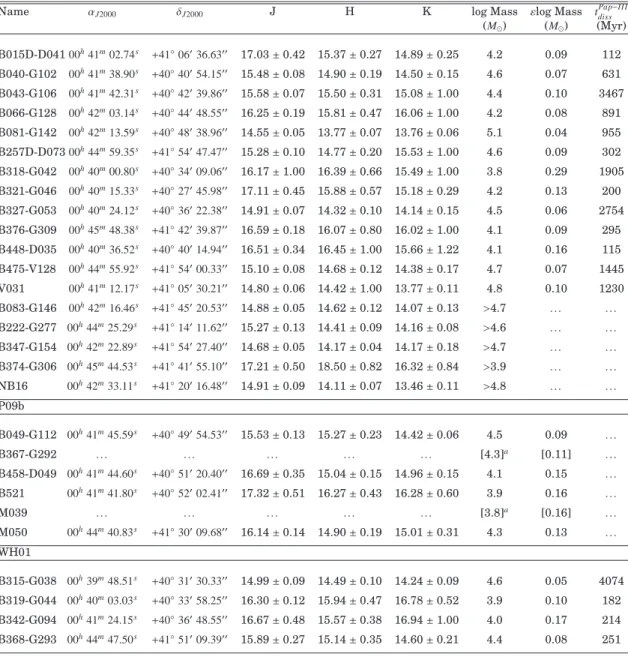
luminosity functions (LFs) with theoretical models. Stellar masses were estimated by
comparison with theoretical models in the log Age vs. absolute integrated magnitude
plane, using ages estimated from our CMDs and integrated J, H, K magnitudes from
2MASS-6X. Three of the clusters were found not to be good YMC candidates from
newly available integrated spectroscopy and were in fact found to be old from their
CMD. Of the remaining sixteen clusters, fourteen have ages between 25 Myr and 280
Myr, two have older ages than 500 Myr (lower limits). By including ten other YMC
with HST photometry from the literature (see Section 1.3.2), we assembled a sample
of twenty-five clusters younger than 1 Gyr, with mass ranging from 0.6 × 10
4M
⊙
to
6 × 10
4M
⊙, with an average of ∼ 3 × 10
4M
⊙. In spite of the similar mass, the surveyed
YMCs appear less compact than ordinary globulars (see Figure 1.17.) The clusters
considered here have masses significantly higher than Galactic open clusters in the
same age range. Our analysis indicates that YMCs are relatively common in all the
largest star-forming galaxies of the Local Group, while the lack of known YMC older
than 20 Myr in the Milky Way may stem from selection effects.
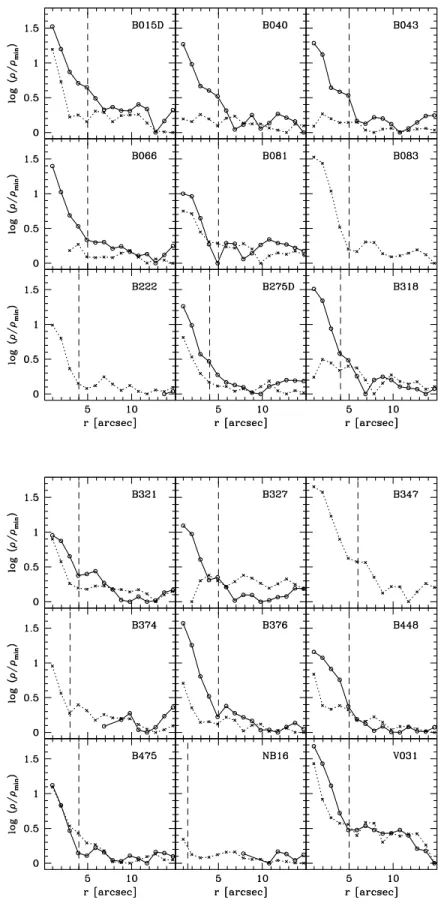
In Chapter 5 surface brightness profiles for the nineteen target clusters (plus a
few other from litterature) were measured using our HST/WFPC2 images, and fit
to two types of models to determine the clusters’ structural properties. The target
clusters have mass (∼ 10
4.5M
⊙

![Figure 2.1: Passive evolutionary sequences for SSPs of different metallicities ([Z/H]) and IMFs (S = Salpeter; K = Kroupa, see Kroupa 2001), from Maraston (1998, 2005)](https://thumb-eu.123doks.com/thumbv2/123dokorg/8208038.128074/38.918.280.620.73.394/figure-passive-evolutionary-sequences-different-metallicities-salpeter-maraston.webp)