Alma Mater Studiorum – Università di Bologna
DOTTORATO DI RICERCA IN
Economia e Statistica Agroalimentare
Ciclo XXIV
Settore Concorsuale di afferenza: 13/A2- POLITICA ECONOMICA Settore Scientifico disciplinare: SECS-P/02 POLITICA ECONOMICA
Titolo Tesi
An Analysis of Living Conditions in Rural Villages in China. A New Geography of the Country.
Presentata da: Nica Claudia Calò
Coordinatore Dottorato Relatore
Prof. Roberto Fanfani Prof. Roberto Fanfani
2 Acknowledgements
I would like to thank my supervisor, Prof. Roberto Fanfani, and the researcher Tommaso Pirotti for their useful comments and recommendations. Acknowledgments are due to all the other Professors for their suggestions and criticism. Many thanks to my dear friends and PhD colleagues for the kind support provided, I am glad to have met you.
Special thanks are owed to Sara, for having given me a place to stay and finish the thesis. Finally I would like to say thanks to my father, my mother and my sister who have never let me get down and to Francesco who is always by my side with love, reminding me to trust in myself.
3 CONTENTS
Introduction ... 7
1. Chinese Economic Development in Recent Decades and deep changes in rural areas ... 9
1.1. The role of rural areas in Chinese economic development: migration and workforce surplus ... 16
1.2. Regional inequalities and Living conditions in modern China ... 20
2. Data source: the Second National Agricultural Census of China (2006) ... 25
2.1. The two National Censuses of Agriculture and rural China (1996 and 2006) ... 25
2.2. Some explanatory notes about data from the census ... 28
3. Analysis of the data: the methodology ... 32
3.1. Principal component analysis (PCA) ... 32
3.2. Cluster analysis ... 38
3.2.1. Hierarchical and Partitional (or No-hierarchical) Algorithms ... 39
3.3. A new geography of rural China: the results of cluster analysis... 42
3.3.1. Results of the Hierarchical algorithm ... 44
3.3.2. Results of the PAM algorithm ... 47
3.4. Fuzzy Logic applied to the analysis of living conditions in the rural villages of China ... 54
3.4.1. The input variables and the decision tree ... 56
3.4.2. The fuzzyfication ... 58
3.4.3. The inference: the rule blocks ... 64
3.4.4. The defuzzification ... 68
3.4.5. The Living Condition Index (LCI) in rural villages of China ... 70
3.4.6. Comparison between official geographical classification and the results of my analysis ... 73
Conclusion ... 78
Appendix 1 ... 80
Appendix 2 ... 81
Appendix 3 ... 138
4 LIST OF TABLES AND FIGURES
Table 1 - Total Value of Imports and Exports in China – 100 ml USD (1978-2010) ... 10
Table 2 - Foreign Trade (USD billion) ... 10
Table 3 - Principal Aggregate Indicators of National Economic and Social Development and Growth Rates in China (1978-2010) ... 13
Table 4 – Percentage Composition of Main Indicators of National Economic and Social Development in China (1978-2010)... 15
Table 5 - Main characteristics of migrant workers from rural areas (2006) ... 17
Table 6 - Average Household Consumption Expenditure Per capita in China (1978-2010) – yuan at current prices ... 22
Table 7 - Main exports commodities in terms of volume and value (10,000 USD) ... 23
Table 8 - Number of Agricultural Holdings by Region in 1996 and 2006 ... 26
Table 9 - Variables groups of living conditions in rural China ... 29
Table 10 - Total Variance Explained ... 33
Table 11 - Components Matrix ... 34
Table 12 - Rotated Component Matrix ... 35
Table 13 - Original variables spread out by components ... 36
Table 14 - The range of Silhouette Coefficient and its interpretation ... 41
Table 15 - The Agglomeration process of Hierarchical Method ... 45
Table 16 - Labels and names of variables used in the analysis ... 57
Table 17 - Variables of Group "Inputs" ... 60
Table 18 - Variables of Group "Outputs" ... 62
Table 19 - Definition points of Membership Function of input variables “drinking water”64 Table 20 - Rules of the Rule Block "Network_Services" ... 67
Table 21 - Defuzzification of intermediate indexes ... 70
Table 22 - Defuzzification of intermediate indeces (last step before final output) ... 71
5 Figure 1 - Percentage Composition of Chinese GDP by industry sectors from 1952 to 201014
Figure 2 - Millions of migrants by age classes (2006) ... 18
Figure 3 Percentage of agricultural labor by age classes (2006)... 18
Figure 4 Percentage of migrants by region and by length of working time ... 19
Figure 5 China % change in rural household and in rural population 1996-2006 ... 27
Figure 6 - The screeplot diagram: number of components and their initial eigenvalue .... 34
Figure 7 - The simple scatterplot matrix ... 37
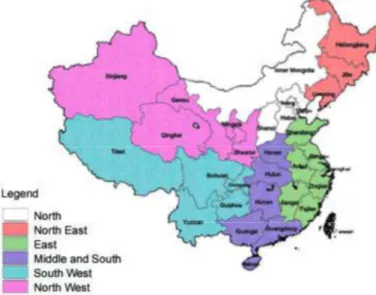
Figure 8 - The official geographical classification of Chinese provinces ... 42
Figure 9 - Geographic Regions of China (First Agricultural Census 1996) ... 43
Figure 10 - Geography of Economic Regions of China ... 43
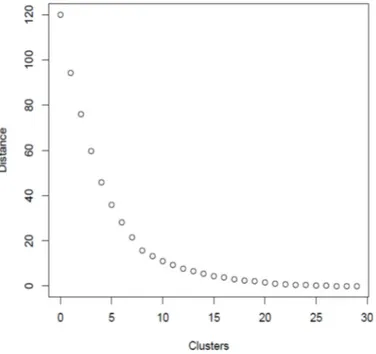
Figure 11 - The screeplot diagram of number of clusters and distance ... 46
Figure 12 - The silhouette plot of PAM, 4 clusters... 50
Figure 13 - The silhouette plot of PAM, 7 clusters... 50
Figure 14 - The silhouette plot of PAM, 8 clusters... 51
Figure 15 - The silhouette plot of PAM, 9 clusters... 51
Figure 16 - The silhouette plot of PAM, 12 clusters ... 52
Figure 17 - The silhouette plot of PAM, 13 clusters ... 52
Figure 18 - The function of membership ... 55
Figure 19 - Structure of the Fuzzy Logic System ... 58
Figure 20 - Graph with the definition points of linguistic terms (picture of the output fuzzyTECH software) ... 64
Figure 21 - Graph with the definition points of linguistic terms (picture of the output fuzzyTECH software) ... 66
Figure 22 - The Living Conditions Index (LCI) by provinces ... 72
Figure 23 - Indices from the fuzzy logic, spread out by cluster (7) ... 75
Figure 24 - The map of rural villages based on the LCI classes ... 76
Figure 25 - The map of rural villages based on the results of the PAM algorithm (4 clusters) ... 77
Figure 26 - The map of rural villages based on the results of the PAM algorithm (7 clusters) ... 77
6 LIST OF ABBREVIATIONS
Compute MBF: Compute Membership Function (Fuzzification Method) CoM: Center of Maximum (Defuzzification Method)
BSUM: Bounded Sum Fuzzy Operator for Result Aggregation MIN: Fuzzy Operator for AND Aggregation
MAX: Fuzzy Operator for OR Aggregation
GAMMA: Compensatory Operator for Aggregation PROD: Fuzzy Operator for Composition
LV: Linguistic Variable MBF: Membership Function RB: Rule Block
7 Introduction
The role played by Chinese rural areas is still fundamental for the general development of the country from a political, economic and social point of view. In particular, the way in which the rural areas have influenced the social stability of the whole country has been widely discussed due to their strict relationship with the urban areas where most people from the countryside emigrate searching for a job and a better life.
However, in recent years many studies have mostly focused on the urbanization phenomenon with little interest in the living conditions in rural areas and in the deep changes which have occurred in some, mainly agricultural provinces.
In 1978, one of the most important reforms in the history of China was introduced, well-known as the Household Responsibility System (or HRS), followed by many other reforms that significantly changed the structure of the country. One main consequence, of course, has been increasing differences, especially between the rural and urban areas, which are as strictly related to each other as they are distant in terms of growth rate and living conditions.
An analysis of the level of infrastructure is one of the main aspects which highlights the principal differences in terms of living conditions between rural and urban areas. Since the 1980s, several studies have been conducted to show the relationship between agricultural development and infrastructure development (Antle 1983). It is generally recognised that not very much attention has been paid to the role of infrastructure in the literature, due to a lack of reliable data on various infrastructure indicators. However, by using a traditional source accounting approach, the Agricultural Census and other official sources, it is possible to identify the specific role of rural infrastructure and other public capital in explaining productivity difference among regions. This throws new light on how to allocate limited public resources for both growth and regional equity purposes (Fan, Zhang 2004). This thesis will focus on these available detailed data on rural infrastructure from the Agricultural Census of 2006, in order to underline the main characteristics of Chinese rural areas in terms of living conditions, thus stressing regional disparities.
One fundamental consequence of these regional disparities is the difference in productivity within Chinese provinces. Therefore, in order to reduce the estimation bias some recent studies add new variables in the production function estimation, such as government investment in roads, electrification, education and other public investment in rural areas (Fan, Zhang 2004). The main aim of this work is to describe and analyze the social and living conditions in Chinese rural villages in terms of infrastructure and service development, utilizing data calculated at the village unit, in order to show the main disparities which are still present among different provinces and municipalities in China.
8 In fact, the Chinese government has invested a lot in poverty alleviation, especially in the post-reform years, by adopting several anti-poverty policies and strategies that can be divided into 4 phases: 1) 1978-1985 when poverty alleviation was mainly due to general economic growth; 2) 1986-1993 with programs mostly targeted at poor areas and focused on the improvement of infrastructure, considered as fundamental for enhancing the capacity of poor areas and rural households; 3) 1994-2000 with the launch of the Poverty Alleviation Plan to eliminate absolute poverty through the tax favorite policy, financial support and a social-economic development program, together with support to labor migration; 4) 2001-2010 with the promotion of the Development Oriented Poverty Alleviation Program in Rural China whose aim was threefold, i.e. guarantee sustainable subsistence to poor people by increasing income and living conditions, focus on integrated development means to improve infrastructure, technology, education, public health care and cultural development and finally, support farmers’ participation in poverty alleviation planning and implementation1. All these investments and programs have, of course, enhanced the level of development and reduced poverty in the poorest regions but it is still not enough for some provinces. The differences are not only between rural and urban zones but also between the richer metropolitan areas and coastal provinces of the East and the Central and Western provinces which are more peripheral and marginal.
In this thesis, I first carried out the analysis through the multivariate statistics approach in order to define the new map of rural areas, and then the results have been compared with an index elaborated through the Fuzzy Expert/Inference System.
The nature of the data has placed several limits on this analysis. First, they refer to only one year (2006) and this means that we simply get a snapshot of the country’s situation. Moreover, it was not possible to get data at a more disaggregated level, namely at county level instead of provincial level.
1 In October 2004, the Rural Survey Organization of the Chinese National Bureau of Statistics presented the paper “Poverty Statistics in China” at the “International Conference on Official Poverty Statistics: Methodology and Comparability”, held in Manila, Philippines.
9
1. Chinese Economic Development in Recent Decades and deep changes in rural areas2
Analysts, politicians and international players from all over the world look at China as one of the most powerful countries on the international scenario, and as a country whose economic development can significantly impact on the economies of the rest of the world. In fact, recent news about the lower growth rate of China has immediately resulted in negative reactions from the most important stock exchanges.
Undoubtedly, the changes in the last few decades have been enormous and this has attracted even more attention from other countries. There are, however, many aspects of these changes that are less well known. This is not only because of the sheer size of China - with a population of more than 1.3 billion – but also because of the lack of information on the enormously large and varied rural areas, where more than 50% of the Chinese population still live.
The rapid development of the Chinese economy in recent decades is the result of the combined effect of the reforms began in 1978. In particular, the contribution of decollectivization, price adjustments and institutional reforms has been deeply analysed, demonstrating how these reforms have positively impacted on agricultural growth (Lin 1992).
Hovever still some answers are missing about how much these reforms in agriculture influecend the recent changes occurred in the country in particular in terms of great reduction in hunger and malnutrition and then in terms of reduction of poverty, thus increasing the social stability of the whole country.
The opening of the Chinese market and the development of the Chinese economy has increasingly highlighted the country’s importance as a both a producer and consumer of agricultural and food products, as well as its influence on international markets and on the negotiations taking place at present under the aegis of the WTO (Lohmar et al. 2009).
In fact today, the sum of imports and exports of China amounts to almost 70% of GDP, and in the period from when the reforms began in 1978 to today, China has reached the level of Germany and the USA in world merchandise trade in terms of exports and imports. In 2009, China overtook Germany as the lead exporter of merchandise while becoming the second largest importer after the USA (WTO 2010).
2 The first paragraphs of the thesis are partially based on the results reported in a joint publication with my supervisor, where we have presented the results obtained from a common analysis of the data of the Chinese agricultural censuses.
10 Table 1 - Total Value of Imports and Exports in China – 100 ml USD (1978-2010)
Year Total Imports and Exports Total Exports Total Imports Balance 1978 206.4 97.5 108.9 -11.4 1980 381.4 181.2 200.2 -19 1985 696 273.5 422.5 -149 1990 1154.4 620.9 533.5 87.4 1995 2808.6 1487.8 1320.8 167 2000 4742.9 2492 2250.9 241.1 2005 14219.1 7619.5 6599.5 1020 2010 29739.9 15777.5 13962.4 1815.1
Source: China Statistics Yearbook, 2011
According to data from OECD since 2001, when China became member of WTO, the balance of payments of the country increased dramatically.3 In 2001 it was $17.4 billion while in 2007 it reached $371 billion. During the last years, because of the international crisis, it has slightly decreased to 297 $billion in 2009 while in the second quarterly of 2010 it was $126.5 billion. After China joined the WTO in 2001 there have been significant changes largely due to the reduction in tariffs on some products, such as soya and cotton. For this reason China has moved from being mainly self-sufficient in food, and thus an exporter, to being a net importer of foodstuffs and agricultural products. About cereals (rice, maize and wheat) China is still self-sufficient but this can change, especcially in the case of maize, which can be used as animal feed and consumption can be expected to increase because of increased meat consumption in the next few years. The increase in imports of agricultural products has only been partly compensated for by an increase in exports of processed foodstuffs and fresh vegetables. However, this must be contrasted, as we have said above, with the unprecedented growth in the positive balance of payments for manufactured products.
Table 2 - Foreign Trade (USD billion)
Item 2003 2004 2005 2006 2007
Total Value of Imports and Exports 851 1,155 1,422 1,760 2,174
Total Exports 438 593 762 969 1,218 Primary Goods 35 41 49 53 62 Manufactured Goods 403 553 713 916 1,156 Total Imports 413 561 660 791 956 Primary Goods 73 117 148 187 243 Manufactured Goods 340 444 512 604 713 Balance 25 32 102 177 262
3This does not include the balance with Hong Kong, which is then re-exported, mainly to the USA. Estimates, which more than double this surplus, are obtained by calculating the deficits which the main trading nations have with China, using data from the IMF.
11 Source: China Statistics Yearbook, 2011
In order to assure the availability of important products, China is establishing new bilateral trade agreements with major soya and cotton producers such as Brazil, with regards to the utilization of resources and agricultural production. In certain cases, such as Africa, these agreements are becoming increasingly precise, with more or less direct Chinese management of large areas of cultivated land in developing countries. In 2007 alone, China signed more than thirty “agricultural cooperation” agreements with African countries which involved more than two million hectares of land. The Chinese have obtained the right to cultivate palm-oil for bio-fuel on 2.8 million hectares of land in the Congo, which will thus become the largest palm-oil plantation in the world.4 In a continent such as Africa, obtaining credits for agricultural production and innovation is very difficult or impossible (sub-Saharan Africa spends much less than India on R&D). China, however, has established eleven research centres in Africa for improving cereal production and this investment will also have positive effects for local producers.5
Besides the well recognised role of agriculture with regards to food security and, thus, reduction of rural poverty it is important to analyse the vast areas of rural China to better understand the role of agriculture even in terms of the relationships between rural workforce and the developments of other productive activities more centered around industrialized and urbanized provinces on the Eastern coast.
Based on the census data for agriculture and rural areas (1996 and 2006), an analysis of the changes registered in this decade will allow us to find answer about crucial questions on future development in China, from both an economic and social point of view. One crucial issue lies in the regional differences and the support given by rural areas to urban areas either for the development of industry then for satisfying the food requirements.
Even a brief analysis of the policies which have been adopted recently in favor of agriculture and rural areas provides important information which can help us to understand whether the development in China in recent years will continue as it has in the past or whether a shortage of working people will occur. With reference to this argument, many scholars have provided interesting analyses, often conflicting with one another. While some of them have concluded that China has reached the Lewis turning point, approaching a new era of workforce shortages
4 The Chinese authorities are also negotiating with Zambia for the use of two million hectares to be used for oil-palms for bio-fuels. This has provoked protests from the Zambian opposition. Chinese companies in Zambia already produce 25% of the eggs sold in the capital, Lusaka. Finally, it is estimated that about one million Chinese farmers worked in Africa this year, which is an enormous number.
5
China and Brazil will diverge more and more because of their different endowment of resources (land and water in particular) and China will probably become the major importer of food and non food products (soya beans, cotton) while Brazil will become the major exporter among the emerging countries.
12 from rural areas (Zhang, Yang, Wang 2010), some other Chinese scholars have conducted analyses showing that in China a phase characterized by a shortage of working people can cohesist with higher salaries (Zhang, 2011).
It is important to say that the reforms in China have produced some significant effects on poverty reduction. According to the WB data, in 1978 Chinese per-capita income was about $1,000 in PPP (prices from 2000), while in India and in Sub-Saharan African countries it was slightly higher (respectively $1,250 and $1,700). The reform of 1978 had a significant impact on poverty in China that, in less than ten years, decreased from 33% to 15% of the population. Even the per capita income increased reaching, in 2006, around $2,000 in current prices and more that $7,700 in PPP. The international scenario changed with China in a better position compared to other emerging countries in particular India where other importan reforms in rural areas were adopted but with a different approach (Gulati Fan 2007).
In the following years, poverty reduction progressed but at lower levels and, according to some scholars, this is due to the relationship between poverty and income growth and inequality. In particular, there has been an analysis of the negative impact of rising income inequality on poverty reduction, above all in rural areas (Yao 2000). Nowadays, according to the WB, poverty in rural areas is around 10%, while the Chinese statistics register poverty at around 5% of the population.
The aim of the following paragraphs is to underline the importance of those factors, such as changes in productive structure and the consumption model, and their consequences on internal problems in China and at an international level.
The data in table 3 show the main information about Chinese economy which significantly developed in the last thirty years reshaping the world economic geography. In fact in less than two decade China increased its GDP reaching the level of the largest economies in the world.6 Chinese economic growth has been far superior to that of India and Brazil, the other two large emerging countries. Even during the global financial and economic crisis of 2007 to 2009, the Chinese growth rate compared favorably with that of the developed economies, and recent data for 2010 confirmed that the average annual growth rate had returned to 10%.
6 According to World Bank estimates, (World Development Indicators) China had an annual growth rate of about 10% between 1990 and 2006. During the same period, Indian GDP grew by 150% and Brazilian GDP by 50%.
13 Table 3 - Principal Aggregate Indicators of National Economic and Social Development and Growth Rates in China (1978-2010)
Item
Aggregate Data Indices and Growth
Rates (%)
1978 1990 2000 2010
Average Annual Growth Rate 1979- 1991- 2001- 2010 2010 2010 Population (10,000 people) Population at Year-end 96259 114333 126743 134091 1.0 0.8 0.6 Urban 17245 30195 45906 66978 4.3 4.1 3.8 Rural 79014 84138 80837 67113 -0.5 -1.1 -1.8 Employment (10,000 people) Employment 40152 64749 72085 76105 2.0 0.8 0.5 Registered Unemployment in Urban Areas 530 383 595 908 1.7 4.4 4.3 National Accounting (100 million yuan)
Gross National Income 3645.2 18718.3 98000.5 403260.0 9.9 10.5 10.7 Gross Domestic Product 3645.2 18667.8 99214.6 401202.0 9.9 10.5 10.5 Primary Industry 1027.5 5062.0 14944.7 40533.6 4.6 4.0 4.2 Secondary Industry 1745.2 7717.4 45555.9 187581.4 11.4 12.5 11.5 Tertiary Industry 872.5 5888.4 38714.0 173087.0 10.9 10.7 11.2 Gross Domestic Product by
Expenditure Approach 3605.6 19347.8 98749.0 394307.6 Final Consumption Expenditure 2239.1 12090.5 61516.0 186905.3 Household Consumption Expenditures 1759.1 9450.9 45854.6 133290.9 Government Consumption Expenditure 480.0 2639.6 15661.4 53614.4 Net Export of Goods and
Services -11.4 510.3 2390.2 15711.5
Investment in Fixed Assets
(100 million yuan)
Total Investment in Fixed
Assets 4517.0 32917.7 278121.9 22.6 23.0
Urban 3274.4 26221.8 241430.9 23.8 24.2
Rural 1242.6 6695.9 36691.0 18.3 17.3
Foreign Trade
Total Value of Imports and
Exports (USD 100 million) 206.4 1154.4 4742.9 29740.0 16.8 17.6 20.2 Exports 97.5 620.9 2492.0 15777.5 17.2 17.6 20.3 Imports 108.9 533.5 2250.9 13962.4 16.4 17.7 20.0
14 Source: China Statistics Yearbook, 2011
This strong economic development has underlined the great differences in China. About productive sectors the contribution of agriculture to GDP had fallen from 30% in 1978-1980 to a little more than 10% in 2010 while services had grown from 22% to more than 40% and industry remained important and contributed more than 46% of GDP in 2010.
Figure 1 - Percentage Composition of Chinese GDP by industry sectors from 1952 to 2010
* The data from 1952 to 1977 come from a different source Source: China Statistics Yearbook, 2011
0 10 20 30 40 50 60 1 9 5 2 1 9 5 5 1 9 6 0 1 9 6 5 1 9 7 0 1 9 7 5 1 9 7 8 1 9 8 0 1 9 8 5 1 9 9 0 1 9 9 5 2 0 0 0 2 0 0 5 2 0 1 0 % Primary industry Secondary industry Tertiary industry
15 Table 4 – Percentage Composition of Main Indicators of National Economic and Social Development in China (1978-2010)
Item 1978 1990 2000 2010
Population and Employment
Population Urban 17.9 26.4 36.2 49.9 Rural 82.1 73.6 63.8 50.1 Employment Primary Industry 70.5 60.1 50.0 36.7 Secondary Industry 17.3 21.4 22.5 28.7 Tertiary Industry 12.2 18.5 27.5 34.6 National Accounting Primary Industry 28.2 27.1 15.1 10.1 Secondary Industry 47.9 41.3 45.9 46.8 Tertiary Industry 23.9 31.6 39.0 43.1
Imports and Exports of Goods
Composition of Exports Primary Goods 25.6 10.2 5.2 Manufactured Goods 74.4 89.8 94.8 Composition of Imports Primary Goods 18.5 20.8 31.1 Manufactured Goods 81.5 79.2 68.9 Source: China Statistics Yearbook, 2011
Knowledge of rural China, and, in particular, of Chinese agriculture is still incomplete and fragmentary. This is because of the vast size of the territory and the vastly different situations, as well as the enormous changes which have taken place in recent decades.
Since 1978 Chinese agriculture has been deeply changed from a system based on cooperatives and collective management to a new one with land management and cultivation being entrusted to rural households, while the land itself has remained the property of the village, the city or the state.
16 1.1. The role of rural areas in Chinese economic development: migration and workforce
surplus
One of the most important contributions of agriculture to economic development has always been to provide a workforce to the other two sectors of the country’s economy, i.e. industry and services. The transition from an economy mainly based on agriculture, characterized by underemployment and low productivity, to one with high employment in services and in industry or construction, is a significant contributor to increased productivity, economic growth and the development of urban and industrialized areas. Despite the improvement of living conditions in rural areas, it is the disparities with urban areas which are often emphasized in this development process, together with new problems in terms of income distribution and welfare.
An analysis of the Chinese case is particularly interesting because of the huge amount of farm workers who have left the countryside in the past three decades searching for a more or less precarious job in sectors of industry, in particular construction, and in services, often in provinces far away from those of their residence. The strong economic growth over the past two decades has led to record rates of increases in GDP of 10% per year, concentrated in coastal provinces and large municipalities in eastern China. These also experienced the benefit of the other major policy, initiated in 1978, to open trade with the rest of the world, culminating with China's entry into the WTO in 2001. The central and western provinces are different, with agriculture still playing an important role, and employment in this sector is significantly high in rural areas.
The results of two national censuses of agriculture and rural areas in 1996 and 2006 provide important information specifically about the role of rural economic development in China. At the same time, they allow us to quantify the reduction in agricultural employment and how it has particularily affected in diverse ways the different Chinese provinces and rural areas. The surveys also allow us to answer several questions about the effects of this huge flow of labor. In particular, it is important to know if, despite this reduction in agricultural labor, employment in small and very small family farms (over 200 million, as we saw earlier) is still characterized by a strong presence of underemployment and precarious labor and what is the possibility of new labor supplies for the future development of extracurricular activities in agricultural and urban areas. In addition, the movement of labor, especially for men and the younger age classes, influences the structure of family farms and the role that women play in conducting business? The presence of more than 130 million migrants moving from rural areas to work in extracurricular activities, often far from their place of residence, causes huge problems both in areas of immigration and of origin. This enormous mass of migrant workers, most of whom are linked to family farms, can change the occupational structure of rural areas and family farms,
17 since in this context family businesses, though small and very small, play a role related to social safety nets for the kind of precarious and seasonal occupations involving the vast majority of immigrants. An analysis of these and other important issues can be useful, not only for understanding current reality better, but also for having more guidance on possible future developments in the vast rural areas and in the whole of China itself.
The main characteristics of migrant workers are very interesting. Almost two thirds are male and one third female. Two thirds are between 20 and 40 years of age, and most of these are between 20 and 30 years of age.
In terms of education, migrants present very specific characteristics with over 70% having a high school education level and another 19% a primary education level. The percentage of migrants with no education is very low (1.2%) and much lower than that of workers in rural areas (6.8%). Lack of education means less possibility to migrate from rural areas. Even the presence of higher education degrees among migrants is slightly lower than that of other workers (8.7% vs. 9.8%), but in this case this may be due to greater ability to find work in the area of origin. Indeed, this is particularly true for migrants who have a higher level of education (college or higher), whose percentage is similar to those of other workers in rural areas (around 1.2%).
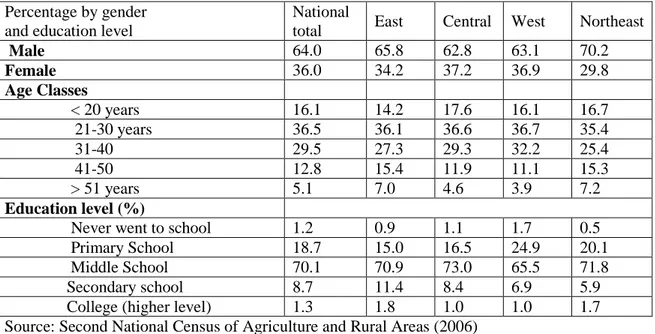
Table 5 - Main characteristics of migrant workers from rural areas (2006) Percentage by gender
and education level
National
total East Central West Northeast
Male 64.0 65.8 62.8 63.1 70.2 Female 36.0 34.2 37.2 36.9 29.8 Age Classes < 20 years 16.1 14.2 17.6 16.1 16.7 21-30 years 36.5 36.1 36.6 36.7 35.4 31-40 29.5 27.3 29.3 32.2 25.4 41-50 12.8 15.4 11.9 11.1 15.3 > 51 years 5.1 7.0 4.6 3.9 7.2 Education level (%)
Never went to school 1.2 0.9 1.1 1.7 0.5 Primary School 18.7 15.0 16.5 24.9 20.1 Middle School 70.1 70.9 73.0 65.5 71.8 Secondary school 8.7 11.4 8.4 6.9 5.9 College (higher level) 1.3 1.8 1.0 1.0 1.7 Source: Second National Census of Agriculture and Rural Areas (2006)
If we compare the migrant workers with all other workers in rural areas, they differ from them in several aspects, particularly from those employed in agriculture. Of the nearly 132 million migrants, the vast majority are male (64%), while in general the workers in rural areas are male and female in equal proportion. The situation is completely different, however, if we refer to
18 those employed in agriculture where, because of the migration of many men, the percentage of women is slightly higher - more than 53% of the total.
With regards to structure by age, this is much more homogeneous for migrants and mainly concentrated in the ages between 20 and 40 years (66% of the total), with a high prevalence in the class between 20-30 years (over 36%) . The percentage of migrants younger than 20 years and those over 40 years is about 16-17%. Migrants older than 51 years represent only 5% of the total. On the other hand, there is the structure by age of other workers in rural areas, where most belong to higher age classes: workers between 20 and 40 slightly exceed 41% of the total, while 45% are workers over 41 years old and 25% are over 51.
Figure 2 - Millions of migrants by age classes (2006)
Source: Second National Census of Agriculture and Rural Areas (2006)
These differences are even more evident when a comparison is made with farm workers in family households, from which most of the migrants come. In the family households, more than 55% of agricultural workers are over 41 years old, and nearly one third of the total are over 51.
Figure 3 Percentage of agricultural labor by age classes (2006)
5% 15% 24% 23% 33% 0% 5% 10% 15% 20% 25% 30% 35%
< 20 years 21-30 years 31-40 years 41-50 years >51 years
Serie1 21 48 39 17 7 0 5 10 15 20 25 30 35 40 45 50
19 Source: Second National Census of Agriculture and Rural Areas (2006)
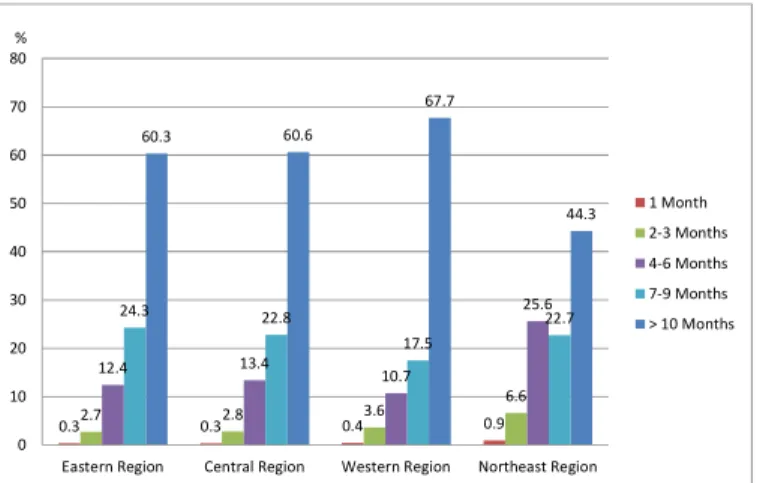
Migration distances are also noteworthy, with almost 50% of migrants working in a different province from where they are resident. In fact, while the other characteristics of migrants from rural areas are quite uniform, the differences are very remarkable with regards to migration distance, largely influenced by the degree of development of the province and the possibility of finding work in non-agricultural sectors near their place of residence. In 2006, almost half of migrants in rural areas moved within their province of residence, while the other half moved outside of the province, often very far away. This is due to the size of China and transportation difficulties over long distances and between rural and urban areas. In particular, it is observed that in the rich eastern provinces, more interested in the processes of economic development and urbanization, less than 20% of migrants are working outside their native province while in the central provinces, from where a substantial proportion of migrants come, and in the western provinces, they constitute over two thirds (67.6% and 60% respectively). This means that over 33 million people from central provinces, and almost 25 million from those in the west, move to the coastal provinces.
The length of time that migrants work away from home is also very long, often between seven and ten months a year. Around 110 million (85% of migrants) move for over 7 months and almost 82 million (60%) for over 10 months per year. Temporary migration is not significant, with a very low percentage of people migrating for less than three months (3-4%) in all the provinces of China.
Figure 4 Percentage of migrants by region and by length of working time
Source: Second National Census of Agriculture and Rural Areas (2006)
0.32.7 0.32.8 0.43.6 0.9 6.6 12.4 13.4 10.7 25.6 24.3 22.8 17.5 22.7 60.3 60.6 67.7 44.3 0 10 20 30 40 50 60 70 80
Eastern Region Central Region Western Region Northeast Region % 1 Month 2-3 Months 4-6 Months 7-9 Months > 10 Months
20 One final remark needs to be made about the type of activities in which migrants are employed. Approximately 57% of them work in industry (including construction), and 40% in services, while less than 3% work in agriculture. The main sector of employment is the manufacturing sector (almost 57%), but even the construction sector is very important with over the 38% of the total. Most migrants in this sector are male (70%), while the percentage of female workers rises from 30% in construction to reach about 43% in the service industries.
An analysis of the characteristics of migrants allow us to evaluate how they can impact on the structural transformations in the economic sectors of rural areas in particular, due to their continued links with part-time farms and their villages of origin. These relationships are an element of social safety against the precariousness of seasonal and migrant labor, contributing considerably to the "social stability" of the entire country by providing an element of social and economic security and a sort of “social cushioning” effect. This became especially evident in 2007 and 2008 when the loss of jobs caused by the recession resulted in millions of workers - some 28 million according to some estimates - returning to their farms, which in the meantime had been run by the women of the household.
The displacement of this large number of workers from rural to urban and industrialized areas in 2006, put more emphasis on the great structural change that has seen a sharp reduction in employment, especially in agriculture; over 82 million workers in the decade 1996-2006. This sharp reduction and the large number of migrants are closely linked with the process of urbanization that resulted in a tremendous increase of the Chinese population in urban areas, of about 400 million people.
Even more significant change will occur in the structure by age of those employed in agriculture in rural China when migration affects not only individuals but entire rural families. This will depend, in particular, on the new policies concerning rural development, especially with regards to land tenure. If they allow households to maintain the rights of land management, then households will be able to rent the land. If this happens, it will significantly increase the potential for the migration of entire families, with a significant impact on both the rural areas of origin and the urban areas of settlement. China's future development will depend on these aspects, not only in rural but also in urban areas.
1.2. Regional inequalities and Living conditions in modern China
Chinese economic development has, however, been accompanied by other changes which have resulted in great regional differences, as well as enormous demographic changes both in rural and urban areas. There has been an increase in the population, albeit at a rate less than in the past, and also an increase in urbanization. The ageing population has also increased the
21 differences between urban and rural areas and between the coastal and metropolitan areas, on the one hand, and the interior and western provinces, on the other. A brief description of these important processes may help us to better understand the ongoing transformation in China. In 2010, the Chinese population was more than 1.3 billion, compared to just over 962 million in 1978.7 This population increase was, however, concentrated almost exclusively in the urban areas. Indeed, the rural population fell from 790 million, or 82% of the population, in 1978 to almost 670 million, or 50% of the population, in 2010. This phenomenon was particularly evident after the 1980's. During the same period the urban population grew from slightly more than 172 million to more than 660 million, with an average rate of increase of 4.4% a year. The population increase of more than 400 million was almost exclusively concentrated in the urban areas. Today, almost 50% of the Chinese population live in urban areas, compared with just over 19% thirty years ago8.
To this growth of the urban population, one must also add the enormous number of migrant workers, as already discussed in the previous paragraph. In fact, the concentration of the population in urban areas and the enormous internal migration will also characterize the changes in progress in the next few years, and will have an enormous impact on the economic and social structure of both the areas where the immigrants come from and those where they go to work. Urbanization plays an important role, not only in increasing inequalities in the provinces themselves and between the rural areas and the cities, but also, and above all, at family level. Data on net disposable household income shows this very clearly. In 2010, urban households had an income of some 19,000 Yuan (almost $3,000) while rural households had an income of only 5,900 Yuan (just under $940). The increase in this difference can be seen from consumption patterns. While in the middle 1980's urban households consumed 2½ times as much as rural households, today they consume 3½ times as much.
The combination of urbanization and the increase in unequal consumption has resulted in a situation where in 2010 consumption by urban households amounted to three quarters of total consumption (76%), while that of rural households had fallen from 60% in 1978 to a little less than a quarter (23%). This also helps us to understand the immensity of the changes which have taken place in recent decades.
7 The rate of population increase has been more than 1.1% per year for the last thirty years, although
there has been a marked reduction due to birth control policies. Thus, it fell from 1.5% in the 1980's to just over 0.6% in the new millenium (2000-2007).
8
OECD estimates say, however, that the Chinese urban population will only become greater than the rural one in 2016, while in many developing countries this threshold has already been passed.
22 Table 6 - Average Household Consumption Expenditure Per capita in China (1978-2010) – yuan at current prices
Year
Rural Household Urban Household
Urban/Rural Ratio (Rural Household= 1)* 1978 138 405 2,9 1980 178 489 2,7 1985 349 765 2,2 1990 560 1596 2,9 1995 1313 4931 3,8 2000 1860 6850 3,7 2005 2579 9644 3,7 2010 4455 15907 3.6
*The effect of price differentials between urban and rural areas has not been removed in the calculation of the urban/rural consumption ratio.
Source: China Statistics Yearbook, 2011
This disparity between the provinces and the municipalities has been increasing in favor of Peking, Shanghai and the East coast provinces during the same period, and particularly in the last twenty years. Slightly less than 40% of the Chinese population live in Peking, Shanghai and the Eastern provinces9, yet they produce more than 57% of the GDP and are responsible for almost 90% of Chinese trade with the rest of the world. Development and per capita income are much lower in the vast central provinces and particularly in the mountainous Western frontier provinces. To illustrate this, per capita income in China in 2010 was on average over 19,000 Yuan (about 3,000 $), but was over 25,000 Yuan in the Eastern provinces, significantly higher than that of the central and peripheral mountainous Western provinces (17,000 Yuan, almost 2,700 $).
This disparity is accentuated and more evident when one considers the different structural
9 According to the official classification we consider as Eastern provinces: Beijing, Tianjin, Hebei, Shanghai, Jiangsu, Fujian, Shandong, Guangdong, Hainan, Zhejiang; Central provinces: Shanxi, Anhui, Jiangxi, Henan, Hubei, Hunan; North-Eastern provinces: Jilin, Heilongjiang, Liaoning; asWestern provinces: Guangxi, Chongqing, Sichuan, Guizhou, Yunnan, Tibet, Shaanxi, Gansu, Qinghai, Ningxia, Xinjiang, Inner Mongolia.
23 realities. Looking at the data for 2010, with respect to the percentage of the population involved in agriculture as an indicator of the level of economic development, and per capita GDP as an indicator of wealth, we find that there is a clear negative correlation between these variables. In most Chinese provinces the agricultural workforce makes up between 30% and 60% of the total. The extreme cases are, on the one side, Beijing and Shanghai with 4.9% and 3.9%, and on the other side, Tibet with 53%. The per capita GRP in the Western provinces is between 13,000 and 27,000 Yuan, while a growing number of richer Eastern provinces are reducing the agricultural workforce and thus increasing by a still greater extent the per capita income of the population. In Beijing and Shanghai the agricultural workforce makes up about 4% of the population and the per capita income is around 74,000 Yuan which is almost four times higher than that of most of the other Chinese provinces.
This great structural, area and zonal difference has also drawn attention to the problem of assured food supplies and the contribution that agriculture and the rural zones make to general economic development in China. The great increases in both food production and consumption, especially during the 1990's, have made China one of the world's major producers and consumers of agricultural products. Today, China is the greatest producer and consumer of pork, poultry and eggs, as well as of agricultural commodities such as rice and wheat. Most of these commodities are for the internal market even though their value in terms of exports is constantly increasing. There has also been strong growth in the production and consumption of fruit and vegetables - including potatoes, tomatoes, asparagus and garlic – and China is the world leader in this area.
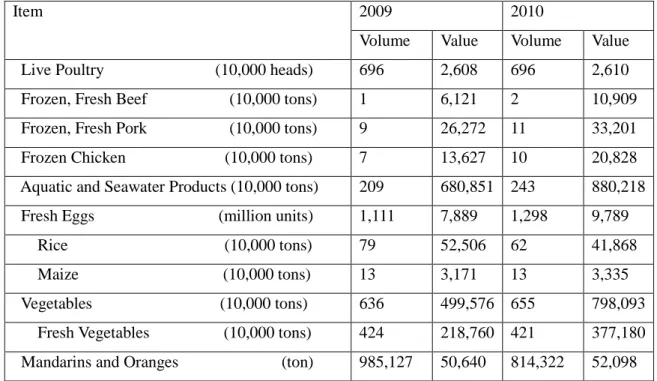
Table 7 - Main exports commodities in terms of volume and value (10,000 USD)
Item 2009 2010
Volume Value Volume Value Live Poultry (10,000 heads) 696 2,608 696 2,610 Frozen, Fresh Beef (10,000 tons) 1 6,121 2 10,909 Frozen, Fresh Pork (10,000 tons) 9 26,272 11 33,201 Frozen Chicken (10,000 tons) 7 13,627 10 20,828 Aquatic and Seawater Products (10,000 tons) 209 680,851 243 880,218 Fresh Eggs (million units) 1,111 7,889 1,298 9,789 Rice (10,000 tons) 79 52,506 62 41,868 Maize (10,000 tons) 13 3,171 13 3,335 Vegetables (10,000 tons) 636 499,576 655 798,093 Fresh Vegetables (10,000 tons) 424 218,760 421 377,180 Mandarins and Oranges (ton) 985,127 50,640 814,322 52,098
24 Apples (ton) 1,171,80 5 71,213 1,122,95 3 83,163
Pine Nut Kernels (ton) 7,862 14297 7,127 15,928 Soybean (10,000 tons) 35 23,714 16 11,825 Peanuts (10,000 tons) 24 21,823 19 24,176 Edible Vegetable Oil (ton) 114,019 15,149 92,461 12,262 Sugar (ton) 63,886 3,365 94,348 6,386 Natural Honey (ton) 71,831 12,570 101,138 18,251 Tea (ton) 302,952 70,495 302,525 78,412 Dried Capsicum (ton) 91,025 14,262 44,535 11,500 Canned Pork (ton) 36,133 9,765 41,932 10,604 Canned Mushroom (ton) 285,791 36,014 329,621 46,185 Beer (10 000 liters) 21,030 12,269 19,410 11,234 Casings (ton) 69,219 78,798 74,961 82,930 Cotton (Cotton Wool) (ton) 8,249 1812 6,453 921 Source: China Statistics Yearbook, 2011
25 2. Data source: the Second National Agricultural Census of China (2006)
Every kind of research and study, in every type of field, needs a significant amount of data to be considered a valid study. Unfortunately, when we refer to China, and to many other developing or emerging economies, this statement needs to be contextualised for the differences in definition, methodologies and availability of data, and with regards to the quality of data, which is often not very reliable for several reasons. However tremendous the development of China in the last few years, the lack of statistical data remains a constant limit for many researchers.
Many sources are not accessible to foreigners and in many cases the data do not exist at all. In fact in many countries the statistica bureau of government do not release household-level data and therefore census data are the only vailable. In this context the Census data are very useful and powerful but still very limited due to the fact that the Census only covers one year, every ten years. Fundamentally this means loss in accuracy and in precision. However some studies investigate this aspect by calculating the error due to the use of aggregate census data especially for drawing high resolution maps of spatial patterns in poverty. The results show that errors associated is relatively low and the analysis can be considered relatively accurate (Minot, Baulch 2004).
In the following paragraph I will report the main differences between the two censuses in order to throws some light on the fundamental changes of a vast area of rural China.
2.1. The two National Censuses of Agriculture and rural China (1996 and 2006)
When in 1996 the first national agricultural census in China has been carried out the lack of information about Chinese rural areas was impressive. This was probably one of the most important limit to the development of national strategies aimed at reducing the rate of poor people in the country. Ten years after the first census, in 2009, the Chinese National Bureau of Statistics published the results of the second national census started in December 2006. The comparison between the two censuses is a fundamental source of information about the huge transformation happened in the rural areas from several points of view. The censuses covered not only agriculture and farm typologies (by size, labor, activities, households and non-households) but also private and public non-agricultural companies. They also provided information on the living conditions, education and mobility of a large part of the Chinese population. The surveys concern rural households, villages and towns and the data refers to the different types of households (rural and agriculture households), the rural conditions of
26 agricultural production and land use, rural labor and employment, irrigation and mechanization, presence and characteristics of migrants, rural livelihoods and infrastructure services.
The results show a significant changes in many relevant aspects from the number and average size of household and non-households farms to the reduction of rural population and workforce. With regards to the number of farms it is worthy of note that the household increased every where but the increase was greatest in the Eastern coastal provinces (+7%), less in the Central provinces (+2.3%) and least in the Western mountainous border provinces (+1%).
Table 8 - Number of Agricultural Holdings by Region in 1996 and 2006
Region Household Agricultural Holdings (household) Non-Household Agricultural Holdings(unit) Household Agricultural 2006/1996 Non-Household Agricultural 2006/1996 1996 2006 1996 2006 number. % number. % National total 193,088,158 200,159,115 357,736 395,180 7,070,957 3.7 37,444 10.5 Eastern Region 60,940,891 65,500,377 145,693 193,181 4,559,486 7.5 47,488 32.6 Central Region 59,250,561 60,599,525 92,431 90,077 1,348,964 2.3 -2,354 -2.5 Western Region 60,613,762 61,280,654 91,403 86,921 666,892 1.1 -4,482 -4.9 Northeast Region 12,282,944 12,778,559 28,209 25,001 495,615 4.0 -3,208 -11.4
Source: Second national agricultural census of 2006, China Statistics Press, Beijing 2009
With regards to non-family run farms, mostly belonging to villages or cities, the most of changes were in the richer Eastern costal provinces (+32%) almost exclusively in Fujian and Zhejiang.
One important change taking place in Chinese agriculture is, however, the increasingly important role being played by these farms. While the overall number of pigs and poultry raised on such farms is not of great importance, they are on average large concerns, with an average number of more than 5,300 heads on poultry farms. Indeed, in recent years developments in animal husbandry production, and in particular in pig and poultry production, have been concentrated in large intensive farms run collectively by villages, cities and cooperatives. The presence and widespread use of animal husbandry confirms that the agricultural reforms have played a key role in reducing famine and malnutrition, and thus, also poverty, in rural areas. These large non-family concerns are of particular importance in fish-farming, as fish becomes an increasingly important part of the Chinese diet. They are mainly collectives, and are aimed at serving the growing demand for fish in China, in particular in the urban areas.
One important change regards the reduction in rural workforce and rural population which for more than three quarters took place in the Central and Western provinces.
27 Figure 5 China % change in rural household and in rural population 1996-2006
Source: Second national agricultural census of 2006, China Statistics Press, Beijing 2009
Although the agricultural workforce is falling it is still a very important segment of total employment in rural zones. Indeed, according to the 2006 census, 71% of workers work on household farms in rural areas.
A brief mention should be made of developments in the workforce in non-household farms. These increased in number by more than 10%, from 358,000 in 1996 to more than 395,000 in 2006. There was a similar reduction in the workforce on these farms (-19.8%) as in household farms, but it was much less in the more developed Eastern provinces (-2.2%) and much greater in the Central (-44%) and Western provinces (-33%), while in the North Eastern provinces the workforce actually grew by 12%.
Finally some remarks have to be done with regards to the average size of rural household. Overall, household farms manage some 122 million hectares of arable land. Thus, they are on average very small, with on average less than half a hectare of land each, or about 8 mu in Chinese measurements. The increase in the number of farms was, however, accompanied by a great reduction in the rural population. The number of permanent residents (resident for more than six months a year) fell from 874 million in 1996 to a little more than 745 million in 2006. This is a reduction of 128 million, or about 15% of the total.
The average number of permanent workers per farm went from 2.2 in 1996 to 1.7 in 2006. There was also a reduction in non-household farms where the number of permanent workers fell from almost 24 per farm to slightly more than 17 per farm in the same period. The average number of permanent workers on household farms is much lower in the coastal provinces (1.4 per farm in 2006), higher in the central provinces (1.7 per farm in 2006) and highest in the Western provinces (more than 2 per farm in 2006). To be more precise, there is an inverse relationship between the number of workers employed on household farms and the importance of employment in agriculture as a percentage of total employment in the individual provinces. This inverse relationship became stronger between 1996 and 2006. For example, in 1996 there
-25 -20 -15 -10 -5 0 5 10 E a s te rn R e g io n C e n tr a l R e g io n W e s te rn R e g io n N o rt h e a s t R e g io n %
Rural Permanent Households Rural Permanent Population
28 were more than 3 workers per farm in the Westernmost provinces of Tibet and Qinghai, while at the other extreme, in the richest coastal provinces such as Peking and Shangai, the number of workers per farm was less than half that figure (1.5 workers per farm). In 2006, in Tibet and Xinjiang there were between 2.5 and 3 workers per farm while in Shanghai and Zhejiang there was less than one (0.6 and 0.8 respectively).
2.2. Some explanatory notes about data from the census
In the previous paragraph, I mentioned the main characteristics of the data used in my analysis. These data, collected in the Second National Agricultural Census, refer to specific conditions related to rural areas in China.
Given that an analysis of living conditions in the rural villages is the main objective of my study, I selected all variables from the Second National Census of Agriculture and rural areas. In particular, all variables related to villages and collected in the 4th section of the Census. I then chose for my analysis those variables referring to the main aspects of living conditions in rural areas, namely in the villages, where living conditions present a lower level of development when compared to urban areas. Therefore, the selected variables focus mainly on the level of development of infrastructure and facilities. Some elements are particularly interesting, such as those related to environmental issues.
The selected variables are: Highways; Buses; Road Material; Electricity; Telephones; Kindergartens; Libraries; Cable TV: Primary Schools; Middle Schools; Drinking Water; Garbage Disposal; Biogas Pits; Improved Toilets; Clinics; Qualified Doctors; Hospitals; Supermarkets; Motor Wells; Water Ponds. For each of these there are some important explanatory notes from the census that will help in understanding the importance of these data and in the analysis of the results.
The 31 variables selected and used in our analysis relate to the main aspects of rural life: 1) Transportation facilities, 2) Electrical power and communication, 3) Culture and education, 4) Environmental health, 5) Sanitary facilities, 6) Medical Care, 7) Market development, 8) Drinking water. Secondary data taken from the National Agricultural Census (2006) are used and calculated, as appropriate. The complete list of the variables is reported below in table 9.
29 Table 9 - Variables groups of living conditions in rural China
Group Variables
Transportation facilities Villages with Highway*,
Closest Bus Station/Port to Village Commune 0km, Road Material Cement & Tar (in village),
Electric power and communication
Villages with Electricity, Villages with Tel Network Culture and education Villages with Kindergarten(s),
Villages with Library(ies), Villages with Cable TV,
Closest Primary School to Village Commune 0km, Closest Middle School to Village Commune 0km, Environmental health Villages with Purified Drinking Water,
Villages with Garbage Disposal Sites, Villages with Bio gas Pit,
Sanitary facilities Villages with Improved Toilets
Medical care Villages with Clinics,
Villages with Qualified Doctors,
Closest Clinic/Hospital to Village Commune 0km, Market development Villages with shops/supermarkets >50m2
Drinking water Villages with wells with motor pumps Villages with water Ponds/Reservoirs.
*The word “highway” refers to well-built public roads, as defined in the Census book.
Source: National Agricultural Census Office of China (2009), Abstract of the Second National
Agricultural Census in China, China Statistics Press.
The first variable refers to the number of villages with roads reaching the village from the outside. The word “highway” refers to well-built public roads, as defined in the Census book. The second variable “buses” means the closest bus station or port and refers to the distance from the village to the closest bus station or port. Bus station means a location where there are regular or frequent buses passing by and one can get on the bus with a beckon.
The variable “road material” refers to the type of materials paving major roads from outside to inside the village. Road pavement includes cement, asphalt, gravel, brick and stone plate and other pavements. If there is more than one road from the outside to the village, the type of pavement of the highest grade of road is selected.
The variables “electricity” and “telephone” refer to the number of natural villages with access to electricity for undertaking normal production and living activities and to the number of natural villages with access to a fixed telephone or mobile phone for contact with the outside.
30 “Kindergartens” means the actual number of kindergartens and child care centers in the village at the end of 2006 that are established by collective, individual or other agencies and registered by the education administration at and above county level. It includes pre-school as well as unofficial kindergartens and child care centers with a certain scale (more than 10 children) without the approval of the education administration. The information reported in this variable are clearly interesting given the fact that the presence of this kind of service is not so usual in the rural villages.
In the variable “libraries” is the number of libraries or cultural centers, i.e. all specialized institutions engaged in loaning reading materials and mass cultural works in the village, established by village collective, individual or other agencies for the purpose of serving the public.
While “cable TV” refers to the number of natural villages that have installed a cable TV reception device and can receive TV programs normally.
Two very relevant variables are those referring to the closest primary and middle school, which means the distance from the village committee to the closest primary and middle school, no matter whether the primary school belongs to the village or to the township.
The variable “drinking water” is even more relevant, since it means whether drinking water of households at the site of the village committee has been centrally treated through purification and disinfection at the years-end. Drinking water from running a water plant is seen as being centrally treated through purification.
The variable “garbage disposal” means whether there is garbage treatment facility within the village to centrally treat garbage, or when there is no garbage treatment facility, the garbage is cleaned, transported and managed in a unified manner. While “Improved Toilets” means that most or all residents use toilets with digestion tanks or biogas digesters or three-separation tanks, some residents use public toilets or there are designated areas in other villages for dumping faeces. They have basically developed new systems compared to those of open faeces’ tanks, faeces’ pits, dry toilets and simple toilets which were more used in the past. There are three variables which all relate to health care services. First is “Clinics” that refers to the clinics established by various economic organizations or individuals in the village that are licensed by public health administration at or above county level. Clinics need to have a fixed location for operations and mainly engage in medical treatment activities. It excludes specialized dental clinics and other establishments specialized in the sale of medicines. Secondly, “Qualified doctors” which refers to the physicians living the village who have obtained a license for practicing medicine from the public health administration at or above county level and who are practicing medicine. And finally, “Hospitals” refering to the distance from the domicile of the village committee to the closest hospital.
31 “Supermarkets” is, in fact, the number of shops and supermarkets with more than 50m2 of floor space. In particular, it refers to shops or supermarkets in the village that are engaged in the wholesale or retail of commodities with an operating area greater than 50 m2.
Finally “Motorized wells” refers to wells with pumps driven by diesel engine, electric motor or other power machines for the irrigation of farmland, excluding wells to be installed with pumps. And “Water ponds” is the number of natural or dug ponds and reservoirs for irrigation solely owned by the village or jointly owned by multiple villages at the end of 2006.
“Roads” refers to pathways that automobile and tractors can go along.
These variables will be analyzed later when I comment on the results of the clustering process. Here, let just summarize that the basic infrastructure (such as transportation, communication and electricity supply) are quite well developed in rural China, with most of the villages having indicators of over 70%. However, while there is a large diffusion of primary schools in rural China, high schools have indicators that do not exceed 50%. Health facilities and tourism are very under-developed, mostly at around 10%-20%, and even lower in many villages. The difference between provinces, as we will see, are often relevant for many of the variables analysed.
32 3. Analysis of the data: the methodology
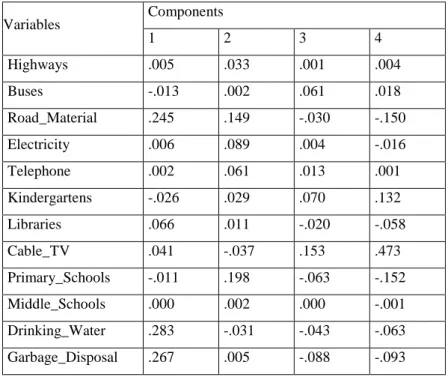
I apply two statistical methodologies in the first part of my analysis: the Principal Component Analysis and the Cluster Analysis. The first one has been applied in order to reduce the number of original variables selected from the Chinese Second Agricultural Census of 2006. In fact, I choose 20 original variables for my analysis, as has already been explained in the previous section about data. Thanks to the PCA, I reduced the variables into 4 Principal Components (PC) which were then utilised in the Cluster Analysis (CA).
3.1. Principal component analysis (PCA)
In social sciences researchers often deal with large dataset including several highly correlated variables which therefore put some constraints on the analysis, both in terms of simplification and synthesis. For this reason, researchers are usually interested in reducing the number of variables. Principal component analysis (PCA) is a statistical technique aiming at a linear transformation of an original set of variables into a smaller set of uncorrelated variables retaining the main information of the original ones (Dunteman 1989). In particular, it is a data reduction method, which helps to summarize and order the information in a large data set and, hence, to avoid double counting. Originally conceived by Pearson (1901), it has been developed by Hotelling (1993) who introduced the most famous formulation of this technique.. Since the objective of PCA is to maximize the variability explained by the components, the total variability of the pextracted components equals the total variability of the koriginal variables. It permits easier selection of a sub-set of components (Mario Mazzocchi, 2008). The original variables are linearly transformed through the equation of PCA that can be expressed as follows: + + + = + + + = + + + = = = p pp p p p p p p p x a x a x a c x a x a x a c x a x a x a c XA C ... ... ... ... ' 2 2 1 1 2 2 22 1 21 2 1 2 12 1 11 1 (1)
Where C is the n x p matrix of principle component scores,X is the data matrix, and A is the p x
p matrix of component loadings. Once the matrix A has been computed, the component scores
(i.e., a1,a2,…ap) can be mathematically calculated to maximize the variation of the linear
composite or, equivalently, to maximize the sum of the squared correlations of the principal component with the original variables.