PhD Program in Behavioral Neuroscience – XXXII Cycle
Curriculum: Behavioral Neurophysiology
THE CORTICAL CONNECTIONS OF THE AREAS OF
THE DORSAL BANK OF THE INTRAPARIETAL
SULCUS: HISTOLOGICAL STUDIES AND
PERSPECTIVES FROM PROBABILISTIC
TRACTOGRAPHY
Tutors: Prof. Roberto Caminiti PhD Student: Andrea Schito
Prof. Alexandra Battaglia-Mayer
Summary
INTRODUCTION
The intraparietal sulcus 3
MATERIAL AND METHODS Animals, surgical procedures, and tracer injections 8
Data analysis 11
Assignment of the labelling to the cortical areas 11
RESULTS Ipsilateral cortical projections to area MIP 13
- Projections from frontal and cingulate cortex 13
- Projections from posterior parietal cortex 14
- Projections from inferior parietal cortex 16
Ipsilateral cortical projections to area PEa 19
- Projections from frontal and cingulate cortex 19
- Projections from parietal cortex 19
Connectivity profiles of PEa, aMIP, iMIP, pMIP 21
Segregation and overlap of frontal and parietal retrogradely-labelled cells projecting to anterior, intermediate and posterior MIP 23
Laminar distribution of retrogradely labelled cells 24
DISCUSSION The connectivity profiles of areas PEa and MIP 26
Topographical aspects of cortical projections to PEa and MIP 27
The relationships between parieto-frontal connectivity and cortico-spinal systems 29
Comparison with previous studies: reciprocal connections of the dorsal bank of the IPS 33
Perspectives in the study of parieto-frontal connectivity 37 CONCLUSIONS
AKNOWLEDGEMENTS REFERENCES
1
INTRODUCTION
In both human and monkey, the posterior parietal association cortex (PPC) is a functionally and anatomically heterogeneous region of the brain, located between the occipital cortex and the somatosensory areas in the anterior part of the parietal lobe. In 1975, Mountcastle and his collaborators provided the first detailed electrophysiological characterization of the PPC, thanks to the development of the single-unit recording technique in awake behaving monkeys. Since then, a large number of studies has focused on the investigation of the functional properties of parietal neurons and on its relationships with neurons in the occipital and frontal areas. Mountcastle’s team assigned to the PPC a crucial role in the information processing related to encoding of the position and movement of the body within the extrapersonal space and, therefore, hypothesised its command function for several object-directed behavioural goals.
Subsequent experiments have been instrumental in clarifying several aspects of the constellation of PPC functions and, especially, the role of this area in the distributed system (Mountcastle, 1978) involved in encoding eye, arm and hand operations in the action space. Special attention has been devoted to the areas around and within the intraparietal sulcus (IPS), that divides the PPC in the superior (SPL) and the inferior parietal lobules (IPL).
Before reviewing some significant findings obtained up to date, it is important to stress that the raising interest of the last decades for the PPC and the IPS areas is primarily justified by their involvement in sensorimotor information processing and integration, in encoding complex actions, such as objects constructions and tool use, as well as in the process of selective visual attention. All these functions are impaired in a specific fashion in neuropsychological patients affected by parietal damage. This is the case, for example, of Optic Ataxia, Hemispatial Neglect, Constructional Apraxia and several other visuospatial defects (for reviews see Marshall and Fink, 2001, 2003; Caminiti et al., 2010, 2015; Battaglia-Mayer and Caminiti, 2018). Some of the key features and deficits of these pathologies have also been described in monkeys (Hartje and Ettlinger, 1973; LaMotte and Acuña, 1978; Rushworth et al., 1997; Battaglini et al., 2002; Hwang et al., 2012; Battaglia-Mayer et al., 2013). Nevertheless, the
2 symptoms following lesions of the PPC do not always match between human and non-human primates, even if there exist considerable homologies, as in the case of Optic
Ataxia after SPL injury (Caminiti et al., 2010; Hwang et al., 2012; Battaglia-Mayer et
al., 2013).
From an evolutionary perspective, it has been suggested that the largest and more recent part of the PPC emerged first in primates, as compared to other mammals, to subserve their richer behavioural repertoire, spanning from visually-guided limb and hand use, to more complex objects manipulation and actions in space (Kaas et al., 2011). In addition, it is known that certain parieto-frontal processing streams underwent to a significant evolution from non-human primates to humans (Caminiti et al., 2015) and that the human brain can operate on a wider range of oscillatory regimes, thanks to communications based on temporally-dispersed communication and longer temporal delays, when compared to monkeys, as suggested by experiments about interhemispheric connections (Caminiti et al., 2009, 2013). Therefore, considering that the human PPC is not only related to visuomotor abilities, but also supports other functions that are quite lateralized, as numerical cognition (Pinel et al., 2001), working memory (Pessoa et al., 2002; Vinette and Bray, 2015), selective attention (Connolly et al., 2016) and semantic and phonological aspects of the language (see Coslett and Schwartz, 2018 for a review), it is plausible to interpret the differences across species by the higher degree of complexity assigned by evolution to the human brain. Therefore, studies on monkey models are still necessary to achieve a deeper understanding of our brain functions, also considering the ethical limitations of studies in humans.
Anatomical and electrophysiological studies on non-human primates have shown that the posterior parietal areas are widely interconnected with each other, and that different types of sensorimotor transformations are subtended by segregated parieto-frontal networks (Caminiti et al., 1996; Rizzolatti et al., 1998; Borra and Luppino, 2016; Caminiti et al., 2017). Every parietal functional domain receives a different pattern of visual and somatosensory inputs, and projects preferentially to functionally matched parts of motor and premotor cortex (Johnson et al., 1996; Rizzolatti et al., 1998). In support of this, it has been shown that electrical stimulation of each parietal domain evokes specific and complex motor behaviors in the nearest available ancestors of
3 early primates (prosimian primates) and that there is evidence that New, Old World monkeys and humans share similarities in the arrangement of these domains (Kaas and Stepniewska, 2016).
In recent years, statistical approaches to the study of cortical connectivity, such as hierarchical cluster analysis, have described the existence of parietal and frontal domains, showing that they are embedded and shape different information processing streams related to different functions, such as reaching, grasping, oculomotor intentions, visual attention, action and intention recognition, etc... The access to these information streams probably depend on the task demands (Averbeck et al., 2009; Caminiti et al., 2017). On the other hand, beyond these long-range networks, the intrinsic connections represent a large part of parietal connectivity and, considering recent findings on the combinatorial processing typical of parietal cortex (Battaglia-Mayer et al., 2001; 2003; Calton et al., 2002; Dickinson et al., 2003), it has been suggested that it may not be composed by so highly specialized subdomains, but rather by across domains interactions necessary to combine multiple signals to dynamically sustain motor behavior (Battaglia-Mayer et al., 2016; Hadjidimitrakis et al., 2019). In this process, the areas of the IPS play a crucial role.
The intraparietal sulcus
In humans, the intraparietal sulcus is significantly deeper and more expanded than in monkeys. Often, it forms more complex branches and folds or splits in several segments, making difficult the identification of its entire course. Nevertheless, homologies for some of the areas buried in the banks of the IPS were found between the two species (for a review see Grefkes and Fink, 2005; Caminiti et al., 2015). In monkeys, the sulci are more regular and less winding than in the human brain. Beyond ethical issues, this is one of the reasons, among others, why it has been easier the study the functional properties of single neurons in the IPS of non-human primates, as compared to human, where such studies can only be done in complex conditions for very limited time in patients affected by other pathologies, such as epilepsy. Moreover, in humans electrophysiological recording of single unit activity for basic research is
4 still not completely cleared through customs. Even if in recent years we have witnessed a significant technological improvement in this field, single-unit recording has been only used in applied research and clinical procedures for several neurological conditions and motor disorders treatment. It is important, for example, to localize precisely the seizure focus in epilepsy cases, or the target of the deep brain stimulation in patients with Parkinson’s disease (Mukamel and Fried, 2012; Cash and Hochberg, 2015). Thus, often, experimenters tried to take advantage of these rare opportunities to also record from the brain structures of interest but, unfortunately, data about single neurons activity in the human IPS are not available.
On the contrary, several physiological and histological studies investigated the functional properties and anatomical connections of intraparietal areas in monkey. For the purpose of the present study, I will focus only on the dorsal bank of the IPS. As for large part of the PPC, multimodal information derived from several cortical areas is conveyed and integrated in the IPS neurons to facilitate the sensorimotor transformations required for performing actions in space (Caminiti and Johnson, 1992; Cohen and Andersen, 2002).
Pandya and Seltzer (1982), on the basis of cyto- and myeloarchitectonic criteria, distinguished the dorsal bank of the intraparietal sulcus from the remaining part of the macaques SPL (Brodmann area 5), and named its entire rostro-caudal extension PEa (Pandya and Seltzer, 1982). A few years later, area PEa has been further subdivided, since retrograde tracer injections in the parieto-occipital area (area PO; Colby et al., 1988) revealed labelled cells in the posterior portion of the dorsal bank of the IPS. This part, renamed medial intraparietal area (MIP; Colby et al., 1988; Colby and Duhamel, 1991), was generally considered as an integrative somatosensory and visual area, even if previous studies (Macko et al., 1982; Macko and Mishkin, 1985) had reported the activation of a visual cortical zone corresponding to MIP, during the presentation of visual stimuli. Subsequent physiological recordings (Colby and Duhamel, 1991; Johnson et al., 1996) have shown that there exists along the dorso-ventral extent of both areas PEa and MIP a gradient-like change of functional properties, with the more ventral parts related to visual processing and the more dorsal one to somatomotor functions, both relevant for encoding hand reaching. In fact, area MIP is considered to be a prominent part of the so-called “parietal reach region” (PRR; Snyder et al., 1998;
5 Andersen and Buneo, 2002), together with the dorsal aspect of area PO (i.e., area V6A; Galletti et al., 1996). Common feature of PRR would be encoding reaching in eye coordinates. It has also been reported that neurons in MIP are selectively modulated by the direction of hand movement during a visuomotor task performed using a joystick (Eksandar and Assad, 1999, 2002), and by active vs passive movement of the head (Klam and Graf, 2006). One study (Seelke et al., 2012) explored the receptive fields of neurons in the rostral portion of the dorsal bank of the IPS in two regions, named by the authors 5L and medial IPS, which seem to partially overlap with PEa and MIP, respectively. Their topographical organization can be summarized as follow: in both area 5L (putative PEa) and medial IPS (putative MIP), multiple receptive fields of the same body part can be found at different locations, and cell receptive fields can include different body parts. Intriguingly, the medial IPS seems to represent the entire body and, furthermore, contains neurons that are responsive to visual stimuli, while area 5L contains only forelimb representations. These findings are supported by the evidence of projections from area PEa (PEip; Matelli et al., 1998), but not from MIP, to the cervical level of the spinal cord, which suggests also an anatomo-functional distinction between the two areas.
Despite these significant physiological and anatomical results, knowledge of the corticocortical connections of the dorsal bank of the IPS has been so far limited to data on efferent projections, thanks to experiments in which retrograde tracers were injected in other areas (Colby et al., 1988; Johnson et al., 1996; Shipp et al., 1998; Caminiti et al., 1999; Lewis and Van Essen, 2000; Marconi et al., 2001; Morecraft et al., 2004; Rozzi et al., 2006; Gamberini et al., 2009; Bakola et al., 2010, 2013; Galletti et al.2011; Gharbawi et al., 2011; Passarelli et al., 2011), as well as from indirect evidence (Blatt et al., 1990). Only in a recent study (Bakola et al., 2017) injections of retrograde tracer were made directly in the medial bank of the IPS and, on the basis of cortical afferent inputs and myeloarchitectonic analysis, some criteria have been proposed to distinguish area MIP from PEa. In particular, area PEa has been defined by a decrease in the myelin density and a less discernable bands of Baillarger, compared to the more caudal location occupied by area MIP. This architectonic transition was identified rostrally to the border between MIP and PEa, as described in Matelli et al. (PEip; 1998). Moreover, the corticocortical connectivity of area PEa was dominated by
6 somatosensory, primary motor and ventral premotor inputs, while area MIP by visual, somatosensory and dorsal premotor afferents.
Starting from this background, the aim of the present study was to define the precise connectivity profile of the areas of the dorsal bank of the intraparietal sulcus, provided that the study by Bakola et al. have left unanswered several questions. These relate to the topographical distribution of the cells projecting from different areas to PEa and MIP, their degree of segregation and overlap in the tangential domains of the cortex, as well as the principles governing their pattern of tangential and laminar organization. In spite of the evidence of functional gradients (Colby and Duhamel, 1991; Johnson et al., 1996) and of topographical organization (Seelke et al., 2012) along the dorso-ventral extent of this area, so far histological studies have not been able to study the connectivity of the different parts of MIP and adjacent area PEa, because of the difficulty to inject in a selective fashion their different sectors.
In perspective, this difficulty can be overcome by MRI-based diffusion tract tracing (DTT), better known as tractography, which is a promising tool to study brain connectivity, especially in humans, where invasive methods are not allowed. However, when compared with histological studies in monkeys (see Girard et al., 2014; Markov et al., 2014; Jbabdi et al., 2015; Maier-Hein et al., 2017), Tractography still suffers from many limitations. Among these, the number of false positives and negatives and the under-representation of long and curved pathways, which depend on the gyral bias, that over-represents the streamlines of the crown of a gyrus (for a discussion see Girard et al., 2014; Thomas et al., 2014).
Given these difficulties, we have combined histological and tractography analysis to elucidate the full connectivity of areas PEa and MIP. Both areas were injected with different retrograde fluorescent tracers in two monkeys, and in a third animal their connectivity (and that of other intraparietal parietal areas) was studied with tractography. To explore potential connections of PEa and MIP not yet revealed by histological studies, the dorso-ventral extent of these areas has been subdivided into different regions of interest (ROIs). This choice was inspired by physiological studies (Johnson et al., 1996) showing a trend of neural activity-types related to encoding visual signals about target location, hand movement planning, and hand movement
7 execution, as one moves from the depth of the dorsal bank of the IPS ventrally, to its crown dorsally. This is reminiscent of the different functional properties shown in area LIP (lateral intraparietal), where the dorsal part (LIPd) contains neurons preferentially encoding eye movement plans, the ventral parts (LIPv) both oculomotor intention and visual attention (Liu et al., 2010). For this reason, we have also re-assed the connectivity of LIP, as suggested by this change of properties.
The combined approach based on histology and tractography allowed direct comparison of the results and a cross-validation of the two methodological approaches within a local network suitable for quantitative analysis and to a critical evaluation of the physiological plausibility of new connections not yet shown by histology.
In the present thesis, I will focus on the discussion of the histological results, given that the analysis of DTT results is still in progress, however some preliminary results will be presented, to highlight the potentially of probabilistic tractography.
8
MATERIALS AND METHODS
Animals, surgical procedures, and tracer injections.
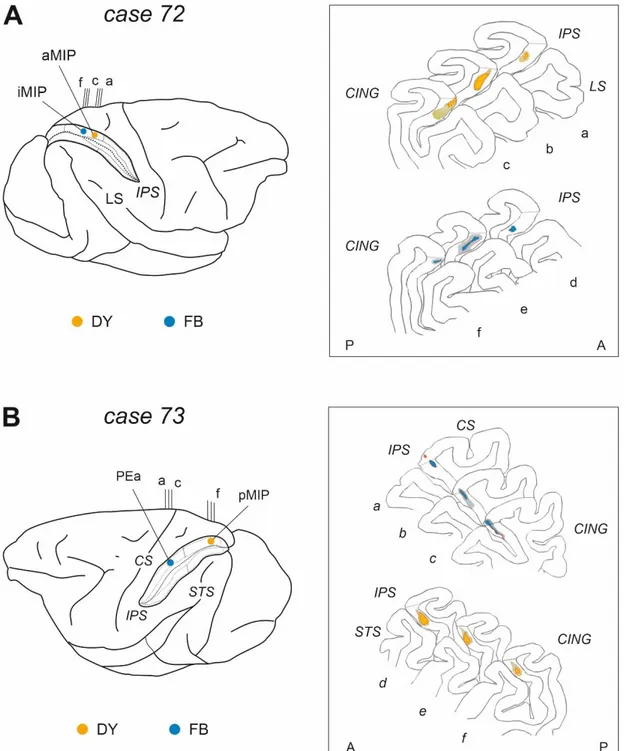
Two male rhesus monkeys (Macaca mulatta; Monkey 72 and Monkey 73; body weight 12 kg and 12.50 Kg, respectively) were used. All surgical procedures were performed under aseptic conditions. The animals were pre-anaesthetized with ketamine (5 mg/kg; i.m.) and dexmedetomidine hydrochloride (0.01 mg/kg; i.m.), intubated and anaesthetized with a mix of Oxygen/ Isoflurane (1-3% to effect). Lidocaine (2%) was used locally to minimize pain during skin incision in the scalp. Desametasone (6mg/kg) was given before dura opening, to prevent brain inflammation and oedema. The skull was then trephined over the target region, and the dura was opened to expose the intraparietal sulcus. A constant infusion of Fentanil (0.2mg/kg/h; i.v.) was performed until the end of the surgical procedures. Once the appropriate site was chosen, fluorescent tracers (Fast Blue [FB] 3% in distilled water, Diamidino Yellow [DY] 2% in 0.2 M phosphate buffer at pH 7.2, were slowly pressure injected with a glass micropipette attached to the needle of a Hamilton micro-syringe. Tracers (0,15 µl) were delivered at about 2 and 4 mm (0,15µl at each depth) below the cortical surface within the dorsal bank of IPS, aiming at areas MIP and/or PEa (Fig. 1; Table 1).
In case 72, two injections were made at two different antero-posterior (A-P) levels of MIP, separated by about 3.6 mm. DY was injected in the anterior part (aMIP), FB more posteriorly, at an intermediate location (iMIP) (Fig. 1; Table 1). In case 73, DY was injected in the most posterior part of area MIP (pMIP), while FB was delivered in area PEa. The two injections were separated by about 9 mm. (Fig. 1; Table 1). At the end of the injections, the dura and the skin were sutured, and the animals ventilated and assisted until they fully recovered from anaesthesia. They were then transferred in their cages for the survival period, which lasted 26 days in case 72 and 23 days in case 73. After surgery, Meloxicam (Metacam; 0.5 ml; i.m.) was given for 4 days to prevent post-surgical pain, and enrofloxacin (Baytril; 3 ml; i.m.) for 9 gg. as antibiotic to prevent postsurgical infections.
9 At the end of the survival time, the animals were given a dose of atropine (0.4 ml; i.m.) and diazepam (Valium, 2ml; i.m.), pre-anaesthetized as above, and received an intravenous lethal injection of sodium thiopental (200 mg/kg; i.v). They were perfused through the left cardiac ventricle with saline, 3.5-4% paraformaldehyde, and 5% glycerol in this order. All solutions were prepared in phosphate buffer 0.1 M, pH 7.4. Each brain was then blocked coronally on a stereotaxic apparatus, removed from the skull, photographed, and placed in 10% buffered glycerol for 3 days. Finally, the brain was cut frozen in coronal sections 60 µm thick. One section of 5 was mounted, air-dried, and coverslipped for fluorescence microscopy. Under U.V. illumination and with the aid of a long-pass barrier filter used to visualize wavelengths greater than 395 nm, FB-retrogradely-labelled cells (RLC) were identified by a sky-blue fluorescence in the cytoplasm, while DY-labelled neurons by a yellow-green fluorescent nucleus. In both cases, 1 series of each fifth section was stained with the Nissl method (thionin, 0.1% in 0.1 M acetate buffer, pH 3.7), for cytoarchitectonic analysis and aiding the attribution of labelled cells to cortical areas.
Table 1. Retrograde tracer injections.
Animal Hemisphere Injected
area
Tracers Number ×
amount
Survival (days)
Case 72 right MIP DY 2 × 0.15 µl 26
MIP FB 2 × 0.15 µl
Case 73 left MIP DY 1 × 0.3 µl 23
10
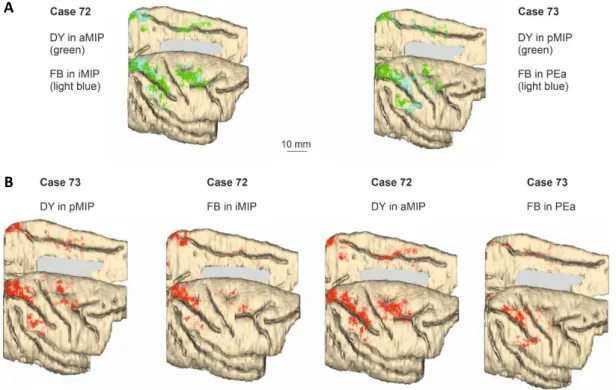
Fig. 1. Retrograde tracers’ injections of Fast-blue and Diamidino-yellow were performed in two
monkeys along the dorsal bank of the intraparietal sulcus, in areas PEa and MIP. In case 72 (A), DY and FB injection were assigned to aMIP and iMIP, respectively, based on their rostro-caudal location along the A-P extent of the intraparietal sulcus. In case 73 (B), the FB injection was assigned to area PEa, while the DY injection was assigned to pMIP. For both cases, the insets show plots of coronal sections (a-f) of the brain (corresponding to vertical lines on the brain figurine) with the central core and halo of diffusion of the injection, that were all confined to the grey matter. Abbreviations: central (CS), cingulate (CING), intraparietal (IPS), superior temporal (STS) and lateral (LS) sulci.
11
Data analysis
The X-Y location of each labelled neuron was plotted with the aid of a transducers mounted on the X and Y axes of the microscope stage, digitalized and stored. The total number of labelled cortical neurons and the proportion of labelled cells for each area were calculated for quantitative analysis, as shown in Table. 2. To this purpose, we used all labelled neurons that were located beyond the limits of the halo of tracer diffusion at the injection sites, and that showed laminar selectivity. Cores and halos at the injection sites were classified as described in the literature (Bentivoglio et al., 1980; Bharos et al., 1981; Keizer et al., 1983; Schmued et al., 1990). Animal care, housing, and surgical procedures were in conformity with European (Directive 63-2010 EU) and Italian (D.L. 26-2014) laws on the use of non-human primates in scientific research.
Assignment of the labelling to the cortical areas
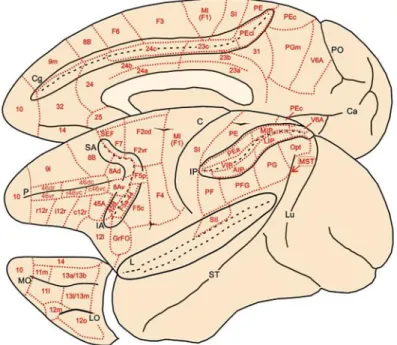
The area attribution of the retrogradely-labelled cells was made according to the map and criteria described in Caminiti et al., 2017 (Fig. 2). Briefly, the subdivision and nomenclature adopted for the parietal cortex is mainly referred to that proposed by Pandya and Seltzer (1982), updated with a more recent parcellation including area V6A in the anterior-bank of the parieto-occipital sulcus (Galletti et al., 1996; Luppino et al., 2005), area MIP (Colby and Duhamel, 1991; Johnson et al., 1996) in the caudal part of the SPL, the ventral (VIP; Colby and Duhamel, 1991; Lewis and Van Essen, 2000), lateral (LIP) and anterior (AIP) intraparietal areas (Blatt et al., 1990; Taira et al., 1990; Borra et al., 2008) and the four subdivisions of the exposed part of the inferior parietal cortex (Rozzi et al., 2006). The primary (SI) and the secondary (SII) somatosensory areas were considered as single entities, regardless of their subdivisions, because of the paucity or incongruence of connectivity data about them. The criteria for the agranular frontal cortex are those proposed by Matelli et al. (1985, 1991, 1998), modified and integrated by further subdivisions, such as the supplementary eye field (SEF; Schlag and Schlag-Rey, 1987), in the dorsorostral part of area F7, and three subdivisions of area F5 (Belmalih et al., 2009), one of which (F5a) is considered together with area 44 in the fundus of the inferior arcuate sulcus.
12 Subdivision of the cingulate cortex in a caudal granular (23) and a rostral agranular (24) areas was made according to Brodmann (1909) and, for gyral (23a and 23b; 24a and 24b) and sulcal (23c and 24c) sectors, according to Vogt et al. (1987). Area 24c of the present study includes also area 24d (Matelli et al., 1991; Vogt et al., 2005). Insular and temporal cortex attribution has been conducted according to Mesulam and Mufson (1982) and Boussaoud et al. (1990), while for prefrontal areas 8A (FEF) 8B, 46d and 46v it was made regardless their respective subdivisions, since very few labelled cells were found in them.
Fig. 2. Brain figurine showing the location of the cortical areas on the mesial, lateral, and orbitofrontal
aspects of the macaque cerebral cortex. The cingulate (Cg), superior arcuate (SA), inferior arcuate (IA), intra-parietal and lateral (L) sulci are opened to better display the location of cortical areas buried in their banks. PO and Ca on the mesial aspect of the hemisphere indicate parieto-occipital sulcus and calcarine fissure, respectively. Lu, P and ST in the lateral view of the hemisphere indicate lunate, principal and superior temporal sulcus. LO and MO in the orbitofrontal cortex indicate lateral and medial orbital sulci, respectively. Cortical areas are defined on the basis of both architectonic and connectional criteria. (from Caminiti et al., eNeuro 2017)
13
Comparison of the labelling distribution
To compare in a quantitative fashion the similarities and differences among the distributions of cells projecting to the four injected regions (Pea, aMIP, iMIP, pMIP), we applied the Kullback-Leibler divergence test. This test was applied to the four probability distributions, each consisting in the percent of labelled cells projecting to a specific injection site (see Table 2). In order to make the probability space (consisting in the set of the projecting areas) identical for the four distributions, the percentages have been re-calculated after excluding the local projections from PEa to MIP, and viceversa. In fact, we could not include a percentage for area PEa projecting to itself and similarly for MIP. After this renormalization process, the labelling distribution of each one of j-th injected areas (j=1,…,4), has been compared in pair-wise fashion to each k-th distribution of the remaining three ones, by computing the Kullback-Leibler divergence, as follows :
𝐷𝐾𝐿(𝑗,𝑘)(𝑃𝑗||𝑄𝑘) = ∑ 𝑃𝑗(𝑖) 𝑖
log2 𝑃𝑗(𝑖) 𝑄𝑘(𝑖)
that provides an index of divergence of a distribution 𝑃𝑗(𝑖) from a second distribution 𝑄𝑘(𝑖). A value 𝐷𝐾𝐿(𝑃||𝑄) = 0 indicates that the two distributions in question are identical, while values far from 0 indicate a great divergence of 𝑃𝑗(𝑖) with respect to 𝑄𝑘(𝑖). For a final overall evaluation among the four distributions, for each j-th area we have calculated the sum
𝐺𝐷𝐾𝐿(𝑗) = ∑ 𝐷𝐾𝐿(𝑗,𝑘)(𝑃𝑗||𝑄𝑘) 4
𝑘=1
which provided a global divergence (𝐺𝐷𝐾𝐿(𝑗)) index for the labelling distribution associated to the four different intraparietal regions.
14
RESULTS
Ipsilateral cortical projections to area MIP
Three injections targeted aMIP, iMIP, and pMIP (Fig. 1, Table 1). Two of them were made in case 72, where DY was injected in aMIP, and FB in iMIP, while pMIP was injected in case 73, together with area PEa, which is located more rostrally within the dorsal bank of the IPS. The analysis of the tangential distribution of RLC in the same hemisphere revealed substantial labelling in both frontal and parietal areas, with smaller contribution from selected cingulate zones (Table 2). In what follows, we will describe the overall results together, to highlight the differential connectivity pattern not only of areas PEa and MIP, but also that of the three subdivisions of MIP.
- Projections from frontal and cingulate cortex
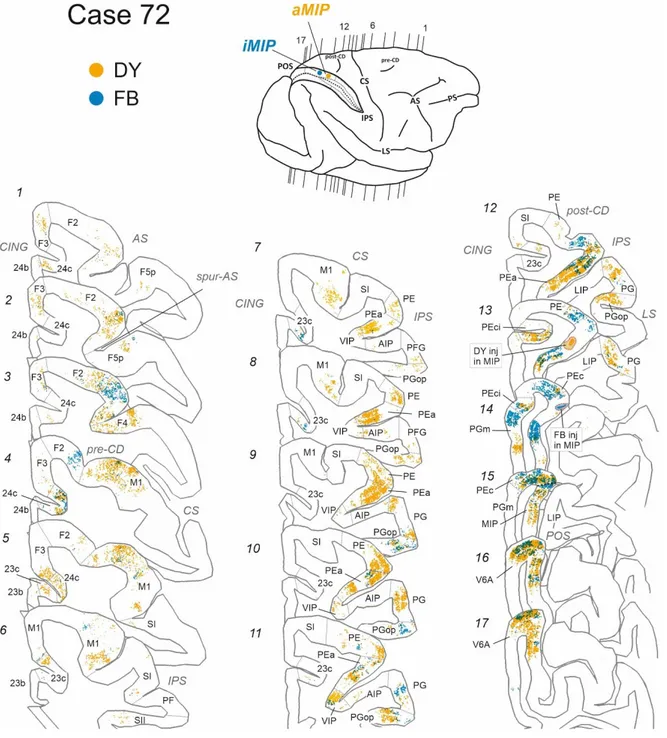
In frontal cortex, RLC were found mostly in a region spanning from the ventro-rostral sector of area F2 (F2vr; Matelli et al., 1998) around the spur of the arcuate sulcus (AS; Fig. 3: 1-3, yellow and blue; Fig. 4:2-3, yellow) up to the border with M1 in the dorsal part of premotor cortex (Fig. 3: 4-5, yellow and blue; Fig. 4: 4-6, yellow). In all three cases, they represented on average the 11% of the total number of labelled cells. However, when comparing the A-P distribution of yellow and blue RLC, a tendency emerged for rostral F2 sectors to project to rostral MIP and for caudal F2 sectors to caudal MIP. Labelling extended over the classical arm region described in previous studies that combined anatomical tract tracing and physiological recording during reaching tasks (Caminiti et al., 1991; Johnson et al., 1996), as well as in the region of the arcuate spur, more related to hand movement (Fogassi et al., 1999).
On the contrary, in primary motor cortex (F1/M1), RLC were found mostly (12.1%) after injection in aMIP (Fig. 3: 4-8; yellow), and in much smaller proportion after injections in iMIP (3.9%) and pMIP (3,7%) (Fig. 3: 4-6, blue; Fig. 4: 5-11, yellow). In this respect, aMIP receives an input from M1 which is similar to that M1 addresses to PEa (14.9%), which suggests that in terms of visuomotor function PEa and anterior MIP share basic roles. Labelling was coextensive with both the arm region of M1 (Johnson et al., 1996), lateral to the pre-central dimple (pre-CD; Fig. 3: 4-6) and with the “new” M1 (Rathelot and Strick, 2009), within the anterior bank of the CS (Fig. 3:
15 contain RLC projecting to the caudal part of MIP (Fig. 4: 6-11, yellow), which suggests that only the rostral part of this area receive hand-related information from motor cortex. Furthermore, no RLC were found in the mesial part of M1 (see Figs. 3-4), in the leg and foot representations, although this might depend on an incomplete tracer filling of MIP, where the more ventral sectors could not be injected and, to our knowledge, have never been injected so far. An alternative interpretation is that MIP functions mostly related to coordinated eye-hand action and visuomotor behavior. Smaller proportions of RLC were found in premotor areas F3 (supplementary motor area, SMA), mostly (4.4%) after aMIP injection (Fig. 3: 1-5, yellow and blue; Fig. 4:
1-6, yellow), in the caudal subdivision of ventral premotor area F4 (Fig. 3: 3, yellow;
Fig. 4: 3-4, yellow), which mostly (2.6%) projected to aMIP, in the cingulate areas 24c (about 2.7%; Fig. 3: 1-5, yellow and blue; Fig. 4: 1-6, yellow) and 23c (Fig. 3:
5-12, yellow and blue; Fig. 4: 7-13, yellow), which mostly (2.3%) projected to the pMIP.
Minor projections were addressed to aMIP by area F5p (Fig. 3: 1-2, yellow and blue; Fig.4: 1-2, yellow).
- Projections from posterior parietal cortex
Cells projecting to MIP were found in both superior (SPL) and inferior (IPL) parietal areas.
In SPL area PE, (Fig. 3: 7-13, yellow and blue), RLC projected to the aMIP (8.0%) and iMIP (12.0%), in smaller proportion (3.5%) to pMIP, as also seen in Fig. 4
(13-15, yellow).
Moving posterior, in area PEc, most RLC (26.2%; Fig. 3: 14-15, blue) projected to iMIP, a smaller proportion (13.3%) to pMIP (Fig. 4: 16, yellow), and a modest one (5.6%) to aMIP (Fig. 3: 14-15, yellow).
In area PEa, the largest proportion (22.1%) of RLC projected to aMIP, smaller proportion (15.5%) to pMIP, and iMIP ((9.4%) (Fig. 3: 7-12, yellow and blue; Fig. 4:
9-13, yellow). This suggests that PEa projections shape to main terminal territories,
one in the anterior and another in the posterior parts of MIP.
Very few RLB projected from SI and SII to the three sectors of MIP (Fig. 3: 6-12, yellow).
16
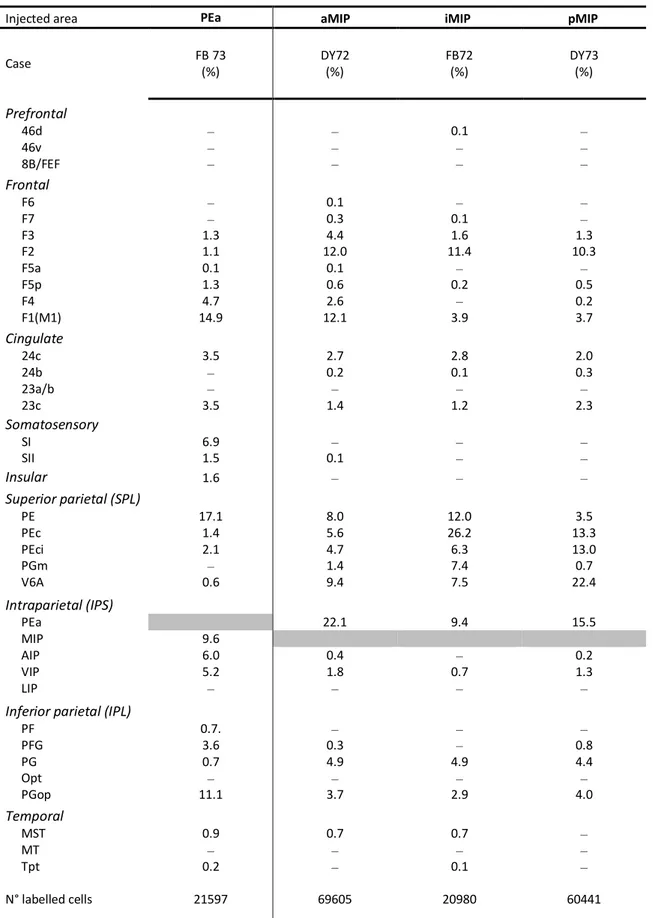
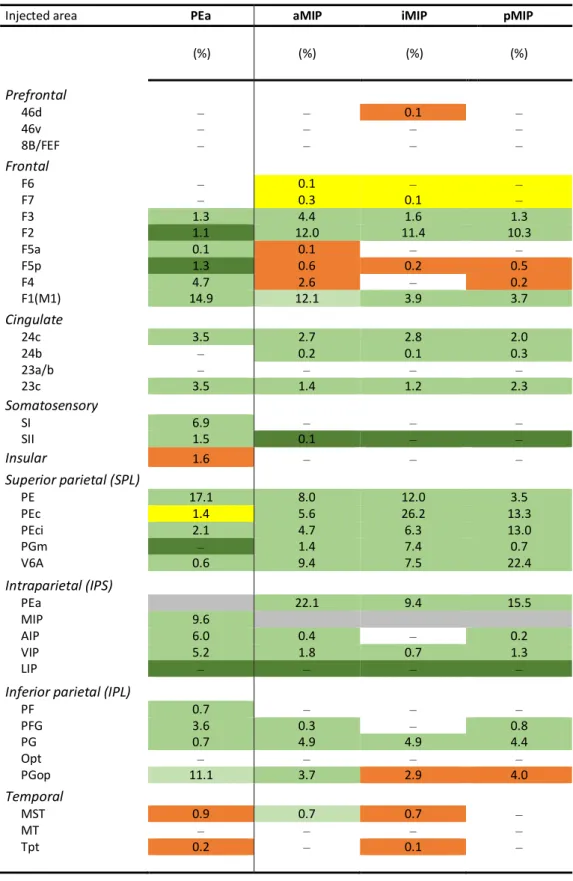
Table 2. Percentage of labelled neurons for each cortical area after injections in PEa and in the anterior (aMIP),
intermediate (iMIP) and posterior (pMIP) parts of area MIP. Injection sites are sorted with regard to their rostro-caudal position along the dorsal bank of the intraparietal sulcus, to better display the gradient-like distribution of their projections.
Injected area PEa aMIP iMIP pMIP
Case FB 73 (%) DY72 (%) FB72 (%) DY73 (%) Prefrontal 46d ‒ ‒ 0.1 ‒ 46v ‒ ‒ ‒ ‒ 8B/FEF ‒ ‒ ‒ ‒ Frontal F6 ‒ 0.1 ‒ ‒ F7 ‒ 0.3 0.1 ‒ F3 1.3 4.4 1.6 1.3 F2 1.1 12.0 11.4 10.3 F5a 0.1 0.1 ‒ ‒ F5p 1.3 0.6 0.2 0.5 F4 4.7 2.6 ‒ 0.2 F1(M1) 14.9 12.1 3.9 3.7 Cingulate 24c 3.5 2.7 2.8 2.0 24b ‒ 0.2 0.1 0.3 23a/b ‒ ‒ ‒ ‒ 23c 3.5 1.4 1.2 2.3 Somatosensory SI 6.9 ‒ ‒ ‒ SII 1.5 0.1 ‒ ‒ Insular 1.6 ‒ ‒ ‒ Superior parietal (SPL) PE 17.1 8.0 12.0 3.5 PEc 1.4 5.6 26.2 13.3 PEci 2.1 4.7 6.3 13.0 PGm ‒ 1.4 7.4 0.7 V6A 0.6 9.4 7.5 22.4 Intraparietal (IPS) PEa 22.1 9.4 15.5 MIP 9.6 AIP 6.0 0.4 ‒ 0.2 VIP 5.2 1.8 0.7 1.3 LIP ‒ ‒ ‒ ‒
Inferior parietal (IPL)
PF 0.7. ‒ ‒ ‒ PFG 3.6 0.3 ‒ 0.8 PG 0.7 4.9 4.9 4.4 Opt ‒ ‒ ‒ ‒ PGop 11.1 3.7 2.9 4.0 Temporal MST 0.9 0.7 0.7 ‒ MT ‒ ‒ ‒ ‒ Tpt 0.2 ‒ 0.1 ‒ N° labelled cells 21597 69605 20980 60441 ‒, labelling < 0,1 % or no labelling
17 On the medial wall of the SPL, area PEci, projected in similar fashion to aMIP (4.7%) and iMIP (6.3%) (Fig. 3: 12-13, yellow and blue), more substantially (13.8%) to pMIP (Fig. 4: 14-16, yellow), while area PGm projected mostly (7.4%) to iMIP (Fig. 3: 14, blue) and aMIP (1.4%; Fig. 3: 14, yellow). Finally, area V6A projections were mostly (22.4%) addressed to pMIP (Fig. 4: 17-19, yellow), in smaller proportion to aMIP (9.4%) and iMIP (7.5%) (Fig. 3: 16-17, yellow and blue).
- Projections from the inferior parietal cortex
The only IPL area projecting to MIP, although with a modest proportion of cells, was area PG (Fig. 3: 9-13, yellow and blue; Fig. 4: 13-14, yellow), that contributes about 4.5% of the cells to each of the three MIP zones discussed here. Labelled cells were modest in VIP (Fig. 3: 7-11, yellow), virtually absent (0.4%) in AIP, none in LIP. Area MST contained a very small proportion (0.7%) of cells projecting to aMIP and iMIP.
18
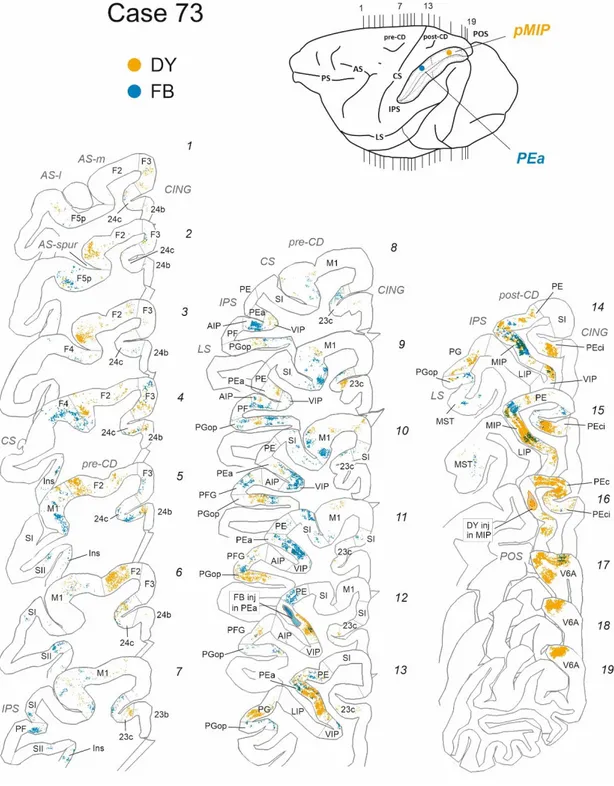
Fig. 3. Ipsilateral cortical projections to anterior and intermediate parts of area MIP. Distribution of
retrogradely-labelled cells (RLC) in frontal and parietal areas after injection of diamidino yellow (DY) and fast blue (FB) in aMIP and iMIP (blue dots), in the dorsal bank of the intraparietal sulcus (IPS), as from the inset of the brain figurine, where the level of individual coronal sections (1-17) is shown by the vertical thin lines. In each section, yellow dots show RLC projecting to aMIP, blue dots those projecting to iMIP. The borders of cortical areas are indicated by thin interrupted lines. Sulci abbreviations: cingulate (CING), principal (PS), arcuate (AS), central (CS), intraparietal (IPS), superior temporal (STS), lateral (LS), parieto-occipital (POS) sulci; pre-CD and post-CD, indicate pre-central and post-central dimple, respectively.
19
Fig. 4. Ipsilateral cortical projections to area PEa and to posterior part of area MIP (pMIP).
Distribution of retrogradely-labelled cells (RLC) in frontal and parietal areas after injection of diamidino yellow (DY) in pMIP and fast blue (FB) in PEa in the dorsal bank of the intraparietal sulcus (IPS). The inset of the brain figurine shows the injection sites of tracers and the level of individual coronal sections (1-19). In each section, yellow dots show RLC projecting to pMIP, blue dots those projecting to PEa. Abbreviations and symbols as in Fig. 2
20
Ipsilateral cortical projections to area PEa
The injection of FB in case 73 targeted a caudal region of area PEa and was confined to its dorsal and intermediate parts within the medial bank of the IPS (Fig. 1B, insets a-c) close to the boundary with area MIP, as defined in literature (Colby and Duhamel, 1991; Johnson et al., 1996; Matelli et al. 1998; Bakola et al., 2017).
- Projections from frontal and cingulate cortex
As shown in Table 2, the frontal projections to PEa mostly (14.9%) arise from motor cortex (M1/F1; Fig. 4: 5-11, blue dots). A modest proportion of labelled cells was found in area F4 (4.7%; Fig. 4: 4, blue dots), 23c (3.5%; Fig. 4: 8-10, blue), 24c (3.5%; Fig. 4: 3-7, blue) and in area PEci (2.1%; Fig. 4: 15-16, blue). Weaker inputs were observed from area F5p (1.3%; Fig 4: 1-2, blue), dorsal premotor area F2 (1.2%) and SMA (F3; 1.3%) (Fig 4: 1-5, blue). Thus, the major frontal input to PEa stems from primary motor cortex.
- Projections from parietal cortex
Area PE, in the convexity of the SPL, is the main source (17.1%) of cortical inputs to area PEa (Fig. 4: 11-14, blue). Strong projections (11.1%) also arise from area PGop (Fig. 3: 8-14, blue) in the caudal part of the parietal operculum, pMIP (9.6%; Fig. 4:
14-15, blue), while weaker connections originate in SI (6.9%; Fig. 4: 6-11, blue), AIP
(6.0%; Fig. 4: 8-9, blue) and VIP (5.2%; Fig. 3: 8-14, blue). Moderate labelling was observed in PFG (3.6%; Fig. 4: 10-12, blue) and in the insular cortex (1.6%; Fig. 4:
4-7, blue). Sparse labelled cells in other parietal subdivisions as SII, PEc, MST, PF, PG,
V6A are reported in Table 2, and can also be seen in Fig. 4. Therefore, area PE on the exposed dorsal part of SPL is the main source of parietal input to rostral and dorsal intraparietal area PEa.
An overall view of the tangential distribution of the cells projecting to PEa and MIP and their spatial relationships in the tangential domain of the cortex is shown in the 3D reconstruction of part of the brain in Fig. 5A. Moreover, a single reconstruction for each injected area is shown in an orderly fashion from pMIP to PEa (Fig. 5B) to better
21 display the diversity of the connectivity profiles of different sectors within the dorsal bank of the IPS.
Fig. 5. 3D reconstruction of the lateral and mesial aspects of the brains, showing the cortical distribution
of retrogradely labelled cells in the tangential domain of the cortex. The results of both tracer injections for each individual case are shown in A, where DY and FB-labelled cells are represented by green and light blue, respectively. B shows brain reconstructions and labelling distribution after single injections in pMIP, iMIP, aMIP and PEa. In both panels, the left hemisphere of case 73 is shown reflected in order to facilitate the visualization of differences across injections.
A
22
Connectivity profiles of PEa, aMIP, iMIP and pMIP
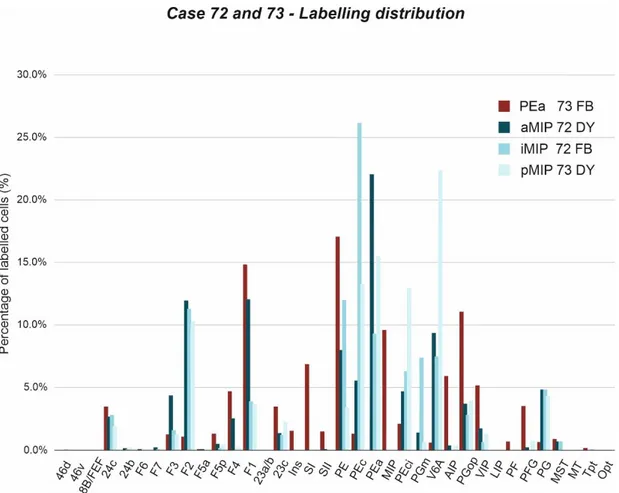
To offer a comprehensive view of the results, the data reported in Figs. 3-4-5 and in Table 2 have been expressed in the form of frequency distribution. Figure 6 reports the proportion of RLC (Y axis) across cortical areas, which are arranged from left to right (X axis) according to their approximate A-P location in the cortex.
Fig. 6. Ipsilateral cortical projections to areas PEa, aMIP, iMIP, pMIP. Proportion of cells
projecting from different areas to the four injection sites located in area PEa (dark red), aMIP (dark blue), iMIP (light blue), pMIP (azul). pMIP cells projecting to PEa, and vice versa, area included.
It can be seen that parietal area PEa receives cortical afferents (red bars) from both frontal and parietal areas, although in a rather selective fashion, since in the frontal lobe most of them stem from M1 (14.9%), with smaller contributions from cingulate areas and from ventral premotor area F4. Most parietal afferents to PEa come from areas PE (17.1%), PGop (11.1%), MIP (9.6%), SI (6.9%), AIP (6.0%), and VIP (5.2%). Thus, both frontal and parietal areas project to PEa in a graded fashion.
23 Concerning area MIP, aMIP receives most of its frontal afferent from dorsal premotor (F2; 12%) and primary motor (12, 1%) cortex, and a substantially smaller contribution from two other premotor areas, such as SMA (F3; 4.4%) and F4 (2.6%). Interestingly, while F2 projects with similar strength to iMIP and pMIP, M1 projections to both iMIP (3.9%) and pMIP (3.7%) are scant. This is a clear example of a gradient-like distribution of frontal projections to parietal cortex. Parietal afferents to aMIP comes almost exclusively from PEa (22.1%), V6A (9.4%) and PE (8%).
The dominant source of parietal afferents to iMIP is area PEc (26.2%), with much smaller contributions from PE (12%), PEa (9.4%), V6A (7.5%), PGm (7.4%), PEci (6,3%), and PG (4.9%).
The sector pMIP receives frontal projection from dorsal premotor area F2 (10.3%), with a smaller contribute from M1 (3.7%). The main sources of parietal afferent to pMIP are V6A (22.4%), PEa (15.5%), PEc (13.3%) and PEci (13%). Thus, the parietal afferents to pMIP are dominated by one area, with gradually decreasing contributions from others.
In the cingulate gyrus, area PEci projects with increasing strength to PEa, and to the three subdivision of MIP, shaping another gradient of projections within the dorsal bank of the IPS.
In synthesis, both dorsal premotor and motor cortex projections to area MIP decrease as one move from aMIP, to iMIP and pMIP, that is in caudalward direction along the dorsal bank of the IPS. This pattern extends beyond MIP, in V6A as well, since this area is connected with dorsal premotor cortex, but not with motor cortex (see Johnson et al., 1996; Marconi et. al., 2001), as if frontalprojections to posterior parietal cortex fade away as one moves toward areas which are far removed from the peripheral motor apparatus.
A pictorial representation of the gradient-like organization of this part of the parieto-frontal system can be seen in Fig. 7.
24
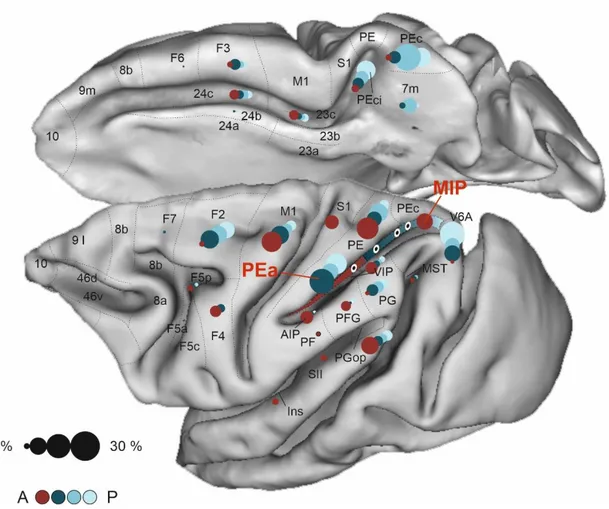
Fig. 7. Gradient-like organization of the parietal and frontal projections to the dorsal bank of IPS.
Brain figurine showing the areas where RLC (1-30%) were found after tracer injections at the four different levels of the dorsal bank of the IPS, in PEa, aMIP, iMIP and pMIP (white/black circles). In each cortical area, the circle size is proportional to the fraction of labelled cells, as shown in the calibration circles on the left (1-30%), circle color the target area in the A-P extent of the cortex.
Segregation and overlap of frontal and parietal retrogradely-labelled
cells projecting to anterior, intermediate and posterior MIP.
To study whether MIP is a homogenous area in terms of cortical afferent projections we focused on the tangential distribution of frontal and parietal RLC cells projecting to the aMIP, iMIP and pMIP. In fact, in the tangential domain of the cortex there exists an orderly arrangement of properties, which can relate to the representation of sensory receptors, motor intention, motor output, visual attention, working memory, etc.
25 In case 72, where DY was injected in aMIP, and FB in iMIP, in the same animal, it can be seen that both frontal and parietal cortex mostly contain cells (Fig. 3, yellow) projecting to aMIP, while those projecting to iMIP (Fig. 3, blue) occupy restricted efferent frontal zones, mainly located in F2. With the exclusion of a restricted part of the latter (Fig. 3: 2-3), cell projecting to aMIP and iMIP were largely segregated in the tangential domain of the cortex. In parietal cortex, cells projecting to both sectors of MIP were similarly segregated (Fig. 3: 7-17), also when found in the same area, as for PGm (Fig. 3: 14). Some overlap was found in areas PEc, PEci and V6A (Fig. 3:
14-17).
When comparing the distribution of cells projecting to aMIP and iMIP, as shown in Fig. 3, with that found after DY injections in pMIP (Fig. 4; yellow labelling), is worth noticing the lack of overlap in the “new M1”, in area PE and PEa.
Altogether, these results suggest that aMIP, iMIP and pMIP in terms of ipsilateral connectivity could be considered as three different fields within the gradient-like architecture of the parietal lobe connectivity, and that each of them receives efferent messages characterized by a significant functional heterogeneity.
Concerning PEa, our data shows that this area is preferentially connected with aMIP, and that both shares significant inputs from motor cortex and PE, rather than with iMIP and pMIP.
Given these premises, to compare in a quantitative fashion the similarities and differences among the distributions of cells projecting to the four injected regions, we applied the Kullback-Leibler divergence test (see Methods). The labelling distribution of each one of the four injected areas has been compared to each of the others.
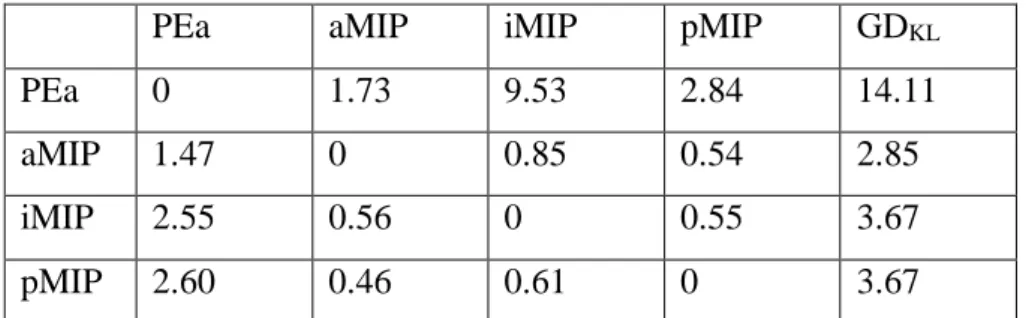
Results of such analysis are reported in Table 3. It can be noticed that PEa can be indeed distinguished from aMIP, iMIP and pMIP on the basis of the different labelling distribution of parieto-frontal cells projecting to it, with respect to the other areas. This distribution in fact compared to the other leads to larger divergence values, which sum up to the highest GDKL value equal to 14.11 (Table 3; Fig. 8). For all three sectors of
26 contrasted the GDKL value measured for injection in PEa, thus suggesting a more
similar pattern in the distribution of projecting cells for the three MIP subdivision.
PEa aMIP iMIP pMIP GDKL
PEa 0 1.73 9.53 2.84 14.11
aMIP 1.47 0 0.85 0.54 2.85
iMIP 2.55 0.56 0 0.55 3.67
pMIP 2.60 0.46 0.61 0 3.67
Table 3. Results of the Kullback-Leibler divergence analysis. Values
near to zero indicates little divergence between the distributions, far from zero higher divergence.
Fig. 8. Plot representing the global KL divergence (GDKL) consisting in
the sum, for each injected area, of the divergence (DKL) with all other
27
Laminar distribution of retrogradely labelled cells
The results of Fig. 3 show the existence of a marked bilaminar distribution (layers III-V) of parieto-frontal cells projecting to aMIP (yellow labelling) and iMIP (blue labelling) from F3 (1-2, 5), F2 (2-4) and M1 (4-6), as well as of parietal cells projecting to aMIP. In the SPL these were areas PE, PEa, MIP, PEc, MIP, PEci, 7m, and V6A. In IPL areas, bilaminar projections arise from PFG, PG, PGop, as well as VIP in the fundus of the IPS. Projections to iMIP (blue labelling) from parietal areas PG, PE, PEa, PEc, PEci, PG, and V6a showed also a marked bilaminar pattern.
Similar results are shown in Fig. 4 for the frontal and parietal projections to PEa and pMIP. This case provides additional information about the laminar distribution of the cells projecting from PEa to pMIP (yellow labelling) and from the latter back to former (blue labelling). We found that in both cases the cells of origin of the reciprocal connections between these areas had a clear bilaminar structure (Fig. 4: 13, yellow labelling in PEa; 14-15, blue labelling in MIP).
In synthesis, both long cortico-cortical relationships between parietal and frontal areas and local reciprocal intraparietal connections between dorsal intraparietal areas occurs through projecting cells located in layers II-III and V.
28
DISCUSSION
The results of this study show that the areas of the dorsal bank of the intraparietal sulcus are primarily connected with different parietal and frontal premotor and motor areas. Most of the latter project to both PEa and MIP, although with different strength, since the proportion of projecting cells follows a gradient-like distribution, depending on the rostro-caudal level of their areas of origin. Thus, although MIP and PEa receive their inputs mostly from the same areas of the network, they show notable differences in their connectivity profiles with frontal and parietal areas.
The connectivity profiles of areas PEa and MIP
From an overall perspective, both cases of this study show that parietal area PE and its caudal subdivision PEc, display a substantial number of projection neurons, but the former entertains stronger connections with PEa, the latter with MIP, especially with its intermediate and posterior sectors. On the contrary, pMIP receives a substantial input from V6A, which addresses weaker projection to iMIP and aMIP and is not connected to PEa. Thus, the projections of V6A decrease as one moves rostrally within the dorsal bank of the IPS.
Similar trends can be found in the frontal cortex, where M1 and F4 project in a selective fashion to PEa and aMIP; on the contrary, F2 entertains strong and privileged connections with all sectors of MIP. The connectivity gradients described in this study are particularly smooth, highlighting the existence of an orderly anatomical organization of the projections along the rostro-caudal extent of the dorsal bank of the IPS. This provides an anatomical substrate to the gradual change of functional properties of neurons observed across its different sectors (Colby and Duhamel, 1991; Johnson et al., 1996). Such an arrangement offers a rich and flexible anatomo-functional reservoir to face the manifold task demands underlying eye and hand operations in the action space (Mountcastle et al., 1975).
From a more detailed perspective, when considering the connectivity profiles of the injected areas individually, we found that, beyond PEa, all the three sectors of MIP receive projections from different and quasi-segregated efferent zones, as testified by the very few cases of overlap of projection cells in the tangential domain of the cortex. Furthermore, we have observed a gradual shift in the amount of frontal projections
29 addressed to MIP. In fact, the motor and dorsal premotor inputs become progressively weaker moving caudally from aMIP to pMIP, which is also congruent with previous studies (see Johnson et al., 1996; Caminiti et al., 1999; Marconi et al., 2001) showing that V6A at the occipito-parietal junction does not receive projections from M1 and receives moderate input from F2. The same logic, although in a mirror fashion, seems to guide the connectivity of other parietal areas, such as PEci, that projects with increasing strength along the A-P extent of MIP. Therefore, the ipsilateral cortical connectivity suggests that aMIP, iMIP and pMIP could be regarded as three different fields sharing only some connectivity patterns within a heterogeneous functional continuum along the medial bank of the IPS.
Topographical aspects of cortical projections to PEa and MIP
As expected from the neurophysiological literature on the functional role of the areas of the medial bank of the IPS, labelled cells in the motor and premotor cortices projecting to them were mostly identified in the forelimb and hand representation zones. Nevertheless, also in this case, each of the individual cortical territories injected in the present experiment, displayed a unique arrangement of the input from these regions. We found that F2 projects to the medial bank of the IPS from segregated frontal efferent zones. In fact, that anterior part of F2 is preferentially connected to aMIP, while the more posterior ones to iMIP. Moreover, projections to aMIP arise particularly from the hand representation zone around the spur of the arcuate sulcus, while more caudally and medially, both iMIP and pMIP might receive some lower limb-related information.
Surprisingly, we report absence of labelling in the leg and foot regions of M1 after all the injections in PEa and MIP, with only few cells projecting to pMIP. On the contrary, as in premotor cortex, in motor cortex labelled cells were mostly found in the forelimb (Johnson et al., 1996) and hand representation regions zones (Rathelot and Strick, 2009). Among them, only moderate projections were addressed to iMIP and pMIP. The strongest arm/hand-related input from M1 is addressed with equal strength to PEa and aMIP, and stems from both the “new M1”, in the anterior bank of the central sulcus, and the lateral surface of the cortex. Intriguingly, some of the labelling found
30 on the lateral surface might overlap with a physiologically defined M1 grasp region (see Gharbawie et al., 2011), which is target of projections from PEa and aMIP. Congruent with our results, the latter areas have been described as parietal region containing a large representation of the distal forelimb (Seelke et al., 2012). Furthermore, PEa addresses disynaptic corticospinal projections to hand motoneurons (Rathelot et al., 2017), and is considered one of the crucial nodes of a parallel parieto-frontal network involved in grasping (Gharbawie et al., 2011). Moreover, PEa receives moderate inputs from AIP, VIP and PFG, all areas playing important roles in visuomotor transformations for grasping (Borra et al., 2008; Gharbawie et al., 2011). Additional inputs from SI might provide re-entrant somatosensory information regarding the current hand/arm geometry and position, which are useful for the control of hand movement and haptic exploration.
Altogether, these data indicate that despite the well-established role of the medial bank of the IPS in encoding motor plans for reaching through the integration and transformation of visual and somatosensory signals (Colby and Duhamel, 1991; Johnson et al., 1996; Caminiti et al., 1996) into motor commands, the gradient-like architecture of connectivity along the sulcus could subtend a gradual rostro-caudal shift from more basic object-directed actions (i.e., grasping) involving solely the control of hand to more complex visually-guided movements, such as reaching and tool use that require visual information, which can be conveyed through area V6A (Colby et al., 1988; Shipp et al., 1998; Caminiti et al., 1999; Marconi et al., 2001; Galletti et al., 2001). Thus, PEa would be more specialized in performing actions (such as reaching and grasping) under somatosensory control (see also Gregoriou and Savaki, 2003), while caudally in iMIP and pMIP both the connectivity pattern and the functional properties of neurons (Johnson et al. 1996; Battaglia-Mayer et al., 2001; Marconi et al., 2001) subtend forms of behaviour requiring a continuous update of both somatosensory and visual information.
Furthermore, both PEa and aMIP are targets of strong projections from the new M1, a phylogenetically recent zone of motor cortex which is source of output for highly skilled fingers and hand movements, since it contains cortico-motoneuronal cells (CMs) that, thanks to monosynaptic connections with motoneurons, allow direct control of the motor output (Rathelot and Strick, 2009). Thus, it is also possible that
31 parallel connections between M1 and PEa could subserve different ethologically relevant hand-related actions and that the underlying networks are preferentially activated on the basis of the task complexity and/or stage. One processing stream, involving the “old M1”, can subtend simpler and evolutionary earlier behaviours such as primitive forms of grasping or injury avoidance; a second one, involving the “new M1”, could mediate more complex object manipulations and dexterous tool use. The reciprocal link between these areas offers to the parieto-frontal operations a flexible anatomo-functional substrate through which the motor output could be modulated in a combined or independent fashion, thanks to the cortico-descending projections from the old and new M1, as well from PEa (Rathelot et al., 2017). This arrangement provides an important substrate for the existence of different local command systems, which can operate independently as a function of the task demands, as it will be discussed in the next chapter.
The relationships between parieto-frontal connectivity and
cortico-spinal systems
In the last decades, the idea that M1 is the only motor cortical command area has been challenged by the discover that many other cortical areas display direct access to the spinal cord (Hutchins et al., 1988; Dum and Strick, 1991, 2002; Luppino et al., 1994; He et al., 1995; Borra et al., 2010; Rathelot et al., 2017). Among them, the premotor areas are a substantial source of descending projections, which all together are similar in numerical terms to those stemming from M1 (Dum and Strick, 1991). Furthermore, specific sectors of the cingulate cortex and anterior parietal areas (AIP, PEa; Rathelot et al., 2017; Innocenti et al., 2018) participate to the cortical control over the peripheral motor output system of the spinal cord. As a consequence, the old view according to which the motor output is the result of a serial processing achieved through hierarchical steps mediated by different areas, from parietal to frontal ones, with a unique cortical motor output centre in the motor cortex has been abandoned in favour a more dynamic mechanism requiring the recruitment of parallel cortico-cortical and cortico-descending systems involved in a simultaneous read-out and representation of several movement-related information (e.g., visuospatial coordinates, object properties, effector selection, etc.) (Rathelot and Strick, 2017; Innocenti et al., 2018;
32 Battaglia-Mayer and Caminiti, 2019). Within these networks, the entry nodes can be recruited depending on the task demands and eventually re-selected and dynamically updated to face novel demands during the temporal evolution of the task (Caminiti et al., 2017; Battaglia-Mayer and Caminiti, 2019), such as during fast reach corrections after change of target location, or more complex visuo-manual operations, such as tool use and objects construction.
The gradient-like architecture of connectivity observed in the present study is not surprising, if seen through this conceptual framework. In fact, it has been shown that in the parieto-frontal system brain functions and the underlying networks are arranged according to rostro-caudal and dorso-ventral gradients (for a recent review, see Battaglia-Mayer et al., 2016) as, for instance, the representation of hand movement-related activity is dominant in the primary motor cortex and gradually decreases as one moves far from it both rostrally and caudally in the network, where instead eye movement-related activity becomes dominant. The same gradient is also evident in the present results and it acquires significance when comparing the connectivity of the different rostro-caudal sectors of the medial bank of the IPS with the areas projecting to the spinal cord.
Another gradient described in the literature (see Battaglia-Mayer et al., 2016) shows that signals related to the planning of the eye and/or hand movement are more represented at rostral frontal and caudal parietal levels of the network, while those concerning execution of eye and/or hand movement are more represented at more rostral levels of both frontal and parietal cortices. In fact, MIP has been so far described as a crucial substrate for the encoding of motor plans concerning visual reaching (Colby and Duhamel, 1991; Caminiti et al., 1996; Johnson et al., 1996; Snyder et al., 1997; Andersen and Cui, 2009) and their online correction (Archambault et al., 2009), thanks to the availability of a wide range of activity-types (visual, motor, somatosensory) characteristic of its neurons (Colby and Duhamel, 1991; Johnson et al., 1996). Together with PEa and PEc, MIP is considered to be part of a parietal arm-dominant domain (Battaglia-Mayer et al., 2016; Caminiti et al., 2017; Battaglia-Mayer and Caminiti, 2019), that can access the peripheral motor output thanks to the descending parieto-spinal projection described above. The outflow information of this domain (Johnson et al., 1996; Matelli et al., 1998; Battaglia-Mayer et al., 2001) is
33 conveyed in a parallel fashion to the frontal motor output domain, that is formed exactly by those motor, premotor and cingulate areas endowed with cortico-descending pathways. The cortico-cortical connections linking these two domains give rise to the Dorsal Reaching System (Battaglia-Mayer et al., 2016; Battaglia-Mayer and Caminiti, 2019), which, beyond reaching, is also involved in other aspects of the online control of hand and arm movement. Reaching movement, in fact, especially in ecological contexts, consists in a reach-to-grasp process that can be decomposed into a transport and grasp phases (Jannerod et al., 1992; Caminiti et al., 1996), which are likely supported by parallel neural mechanisms. Indeed, the recent view according to which cortical areas are arranged through anatomo-functional domains and parallel networks (Caminiti et al., 1996; Johnson et al., 1996; Rizzolatti et al., 1998; Kaas et al., 2011; Kaas and Stepniewska, 2016) in a gradient-like fashion (Battaglia-Mayer et al., 2016) suggest a dynamical recruitment of the nodes within the networks rather than a rigid mechanism whereby any given network is unequivocally linked to a single function.
Interestingly, a recent study (Innocenti et al., 2018) provided for the first time a systematic analysis of the axon diameter and conduction velocities of the cortico-descending projections arising from motor, premotor and parietal areas of macaque brain. As expected, the fastest conduction velocities have been found for primary motor cortex, slower ones for SMA, F7, PEa/AIP, SI and F4, in this order. The wide spectrum of conduction velocities through which these areas address their signals to the spinal cord allows multiple and parallel outflow systems which might not require the recruitment of motor cortex through cortico-cortical pathways, as to operate a fine local regulation of the motor output on the basis of the current request and the complexity of the task.
In conclusion, our data suggest that PEa and, potentially, aMIP could be regarded as a parietal hand/arm motor domain, reciprocally connected through ipsilateral cortical connections with the areas forming the frontal motor output domain. Thus, both areas could contribute to the motor output generation aimed either to grasping and reaching or to dexterous and more complex object manipulations through parallel pathways addressed to the “old” and the “new” M1, respectively. At the same time, PEa can directly address information to the peripheral motor output system thanks to its
34 projections to the last-order interneurons of the spinal cord (Rathelot et al., 2017 Innocenti et al., 2018). On the contrary, iMIP and pMIP, when compared to PEa and aMIP, could be more involved in the processing and integration of high-order information concerning the visuospatial coordinate transformations for the composition of motor plans. However, the heterogeneity of functional properties and the multiplicity of afferent connections within this gradient-like architecture displayed along the medial bank of the IPS, do not support the presence of sharp anatomo-functional borders among its areas, but rather fits with a anatomo-functional continuum through which the transition from motor intention to action can be shaped.
Laminar distribution of cells projecting to PEa and MIP
An influential theory concerning the information processing flow from primary visual cortex toward extrastriate areas and back (Felleman and Van Essen, 1991) holds that lower-order visual areas, such as V1, project from supragranular layers in a feed-forward fashion to extrastriate areas, where they target layer IV, and receive feed-back information from cells in infragranular layers that do not target granular layers, and project back to lower-order visual areas in a fashion that is related to the hierarchical distance (Markov et al., 2014). Feed-forward signals would convey mainly sensory information, while feedback signals would modulate the latter based on task requirements (Lamme and Roelfsema, 2000).
The parietal lobe in monkeys is considered as the interface between vision and movement and as a crucial node for encoding motor intention and selected visual attention, among other functions. Therefore, we asked whether relations similar to those shown in the occipital cortex could be found between areas considered at different hierarchical level in parietal and frontal cortex, in other words whether the hierarchical position occupied by any given area in the parieto-frontal system could be decided based on the laminar characteristics of its efferent and afferent cortical projections.
The results of this study show that the ipsilateral projections from most parietal and frontal areas to both PEa and MIP are characterized by a marked bilaminar pattern.
35 More important, the reciprocal connections between these two areas also originate from both supra- and infragranular layers. Therefore, both long cortico-cortical connections between parietal and frontal areas and local reciprocal intraparietal connections between dorsal intraparietal areas occurs through projecting cells located in layers II-III and V. Similar results were obtained in earlier studies of parieto-frontal relationships (Caminiti et al., 1985; Johnson et al., 1989; 1996; Marconi et al., 2001), as well by Bakola et al., (2017), who however did not comment this result.
Although this study does not provide information about the layer of termination of the axons of the labelled cells, their laminar distribution does not conform to that required by the feedforward/feedback scheme typical of the visual hierarchy, suggesting that the latter breaks down at the occipito-parietal junction.
Comparison with previous studies: reciprocal connections of the
dorsal bank of the IPS
The present study confirms and extends previous findings about the cortico-cortical connections of the dorsal bank of the IPS. Most of the projections to MIP and PEa reported herein are in agreement with recent results (Bakola et al., 2017). Moreover, due to the lack of anterograde tracing in the present experiment, we tested the reciprocity of connectivity between the injected areas (PEa, aMIP, iMIP, pMIP) and their source of projections by comparing our results with the data available in literature. A semi-quantitative approach was used, since the election criterion for this analysis was represented by the percentage of retrogradely labelled cells, a data that was not always reported. Thus, a complementary and careful examination of texts, maps and figures of the reference articles was also conducted. The latter was particularly useful in order to determine which one of the A-P sectors of MIP was source of outputs, and in the case in which different nomenclatures were used. An overview of reciprocal connections of PEa, aMIP, iMIP and pMIP with other areas is shown in Table 4, where numbers represent inputs to PEa and MIP (present study), and colours represent their outputs (available literature).
36
Table 4. Color codes superimposed to Table 2 represent the outputs of PEa and MIP, as described
in literature, and together with numbers (inputs) provide a visual summary of the reciprocal connections of the dorsal bank of the IPS with other cortical areas. Intermediate shade of green indicates that the outputs have similar strength to that of the inputs described herein. Dark and light green indicate that outputs are stronger and weaker than inputs, respectively, orange that they are absent, yellow that the findings are controversial.
Injected area PEa aMIP iMIP pMIP
(%) (%) (%) (%) Prefrontal 46d ‒ ‒ 0.1 ‒ 46v ‒ ‒ ‒ ‒ 8B/FEF ‒ ‒ ‒ ‒ Frontal F6 ‒ 0.1 ‒ ‒ F7 ‒ 0.3 0.1 ‒ F3 1.3 4.4 1.6 1.3 F2 1.1 12.0 11.4 10.3 F5a 0.1 0.1 ‒ ‒ F5p 1.3 0.6 0.2 0.5 F4 4.7 2.6 ‒ 0.2 F1(M1) 14.9 12.1 3.9 3.7 Cingulate 24c 3.5 2.7 2.8 2.0 24b ‒ 0.2 0.1 0.3 23a/b ‒ ‒ ‒ ‒ 23c 3.5 1.4 1.2 2.3 Somatosensory SI 6.9 ‒ ‒ ‒ SII 1.5 0.1 ‒ ‒ Insular 1.6 ‒ ‒ ‒ Superior parietal (SPL) PE 17.1 8.0 12.0 3.5 PEc 1.4 5.6 26.2 13.3 PEci 2.1 4.7 6.3 13.0 PGm ‒ 1.4 7.4 0.7 V6A 0.6 9.4 7.5 22.4 Intraparietal (IPS) PEa 22.1 9.4 15.5 MIP 9.6 AIP 6.0 0.4 ‒ 0.2 VIP 5.2 1.8 0.7 1.3 LIP ‒ ‒ ‒ ‒
Inferior parietal (IPL)
PF 0.7 ‒ ‒ ‒ PFG 3.6 0.3 ‒ 0.8 PG 0.7 4.9 4.9 4.4 Opt ‒ ‒ ‒ ‒ PGop 11.1 3.7 2.9 4.0 Temporal MST 0.9 0.7 0.7 ‒ MT ‒ ‒ ‒ ‒ Tpt 0.2 ‒ 0.1 ‒