SAPIENZA Università di Roma Facoltà di Farmacia e Medicina
Ph.D. in
MORPHOGENESIS AND TISSUE ENGINEERING XXXII Ciclo
(A.A. 2016-2019)
Chromosomal and functional characterization of the early stages of human embryogenesis
Ph.D. Student Adriano Giancani
Tutor Coordinator
Index
1. Summary ... 3
2. Introduction ... 5
3. Aims... 14
4. Results and Discussion ... 15
4.1 Retrospective time-lapse study (ExCs) ... 15
4.2 Time-lapse predictive power on euploid embryo life birth rate 25 5. Materials and Methods ... 39
5.1 Stimulation Protocol and eggs collection ... 39
5.2 Semen evaluation and preparation ... 39
5.3 Oocyte preparation... 40
5.4 Equipment for micromanipulation ... 40
5.5 Microtools for ICSI... 41
5.6 ICSI procedure ... 41
5.7 Embryo Culture ... 42
5.8 Assessment of oocyte survival, fertilization and further development ... 43
5.9 Blastocyst biopsy and PGT-A ... 43
5.10 Embryo vitrification and warming ... 45
5.11 Cryopreserved embryo transfer ... 45
5.12 Establishment of pregnancy ... 46
5.13 Retrospective time-lapse analysis ... 46
5.14 Statistic Analysis ... 48
6. acronyms list ... 50
6.1 General acronyms list ... 50
6.2 Morphocynetic acronyms list ... 51
7. References ... 53
1. SUMMARY
The main objective of modern IVF is to maximize the effectiveness of the times to achieve a pregnancy and at the same time also manage the risks, looking for new predictive parameters of the embryonic developmental competence. The analysis of embryo morphodynamic growth is not associated with its euploidy or implantation competence. However, some static parameters of embryo quality might exist that could be associated with embryo competence beyond its chromosomal constitution.
The aims of this project are:
i) To study from a morphodynamic, genetic and clinical point of view,
embryos that show an abnormal development during
preimplantation growth, in particular, the exclusion of cells (ExC) from embryonic mass at the moment of morulation.
ii) Trying to understand if the morphodynamic characterization of euploid blastocyst development allows a higher prediction of live-birth (LB) after single-embryo-transfers (SET).
For both the aims set in this Ph.D. project, preimplantation development and morphodynamic growth of embryos were observed in a time-lapse culture system (Embryoscope, Vitrolife). For the first aim, our preliminary data show that the exclusion of cells from the body of the blastocyst could be not-intuitively associated to a higher competence resulting from the embryonic capacity to overcome an abnormal cleavage pattern occurred in the very first divisions before the activation of the embryonic genome (4 to 8cell stage in humans). It is exciting the future perspective of collecting the ExC aiming at analyzing them through the karyomapping technology as well as biochemical assays, to better describe both the chromosomal segregation and the cellular physiology.
SETs from 1069 patients undergoing preimplantation-genetic-testing-for-aneuploidies (PGT-A) cycles at 2 IVF centers were investigated (training set). All embryos were cultured in a specific time-lapse incubator with continuous media. The data from the time of polar-body-extrusion to time starting-blastulation were collected. Trophectoderm (TE) and inner-cell-mass (ICM) static morphology were also assessed. Logistic regressions were conducted to outline a predictive model of LB, whose power was estimated through a ROC-curve. In phase2, this model was tested in an independent dataset of 319 consecutive SETs from 546 PGT-A cycles at 3 IVF centers (validation set). The average LB-rate in the training set was 40% (N=207/511). Only time-of-morulation (tM) and trophectoderm quality were outlined as putative predictors of LB at both centers. The model showed a significant AUC (area under the curve) of 0.65. In the validation set, the euploid blastocysts characterized by tM<80hr and high-quality trophectoderm resulted in an LB-rate of 55.2% (n=37/67), while those with tM≥80hr and a low-quality trophectoderm resulted in an LB-rate of 25.5% (N=13/51;p<0.01). The ROC-curve analysis pictured an AUC of 0.6. A model including tM and trophectoderm quality involves a better prediction of euploid blastocyst reproductive competence. This model was reproducible across different centers under specific culture conditions. These data support the crucial role of morulation for embryo development, a stage that involves massive morphological, cellular and molecular changes requiring more investigations. Moreover, important guidelines for IVF laboratories that do not conduct a time-lapse-based embryo culture may arise from these two studies.
2. INTRODUCTION
The main objective of modern IVF is to maximize the effectiveness of the times to achieve a pregnancy and at the same time also manage the risks (multiple pregnancies, spontaneous or therapeutic abortions). Assisted reproduction techniques (ART) have been continuously advanced over the last few decades. Improvements in this field can be attributed to the continuous efforts of laboratories around the world to optimize the formulations of the culture media. However, it is evident that the culture media are only one aspect of the embryo culture system, which includes other factors, both chemical and physical. These isolated factors have been shown to have dramatic effects on embryonic physiology and vitality (Fig.1 Wale and Gardner, 2016). The strategy of elective SET is considered a necessity for a good clinical practice especially to avoid multiple pregnancies (Cutting et al., 2008; Harbottle et al., 2015).
With the improvement of embryonic culture conditions, it was possible to bring the embryos up to the blastocyst stage, allowing a better embryo selection than a culture up to day3 (Stoop et al., 2011; Sfontouris et al., 2017), increasing success rates and reducing the number of cycles needed to reach a pregnancy. The identification of better techniques for embryo selection will be significant in the improvement of the outcome of ART.
Fig.1 An overview of the main chemical and physical factors that influence the development of the mammalian embryo in vitro; red represents chemical factors and blue represents physical factors. QC, Quality Control; QA, quality assurance; VOCs, volatile organic compounds. (Wale and Gardner, 2016).
Historically, the most widely used selection method in the world is the embryonic morphology. this selection can be done on the third day, considering the number of cells, the percentage of fragmentation and the symmetry between the blastomeres that are in a cleavage stage embryo, or at the blastocyst stage, assigning the alphanumeric values indicating the degree of expansion of the blastocysts, the quality of the TE and the quality of the ICM(Gardner and Schoolcraft, 1999).
Traditional scoring of morphology at the cleavage stage has been shown to be predictive of blastocyst formation (Bolton et al., 1989), and at cleavage and blastocyst stages, of pregnancy rates (Balaban et al., 2011). However, scoring morphology has been limited by the use of static assessments at specific intervals, moreover, static morphology is highly subjective (Storr et al., 2017) and it is well known that even those embryos classified as
“top quality” may not implant (Rhenman et al., 2015). Static morphology evaluation is considered a non-invasive embryo selection, however, there is a more important embryonic selection tool, considered an invasive procedure that involves embryo manipulation, the preimplantation genetic testing (Lee et al., 2015).
Over the past decades, genetic technologies have evolved from the diagnosis of a monogenic disease to a wide range of indications including inherited genetic diseases, Robertsonian translocations, and chromosomal aneuploidies (van Echten-Arends et al., 2011). In PGT-A and preimplantation genetic testing for monogenic disease or structural disorder (PGT-M or PGT-SR), embryos from couples with a decreased chance of achieving a pregnancy through IVF would be biopsied, and the cell(s) analyzed for their full chromosomal content (PGT-A) or specific mutation or structural disorder (PGT-M or PGT-SR) with the hope that if only chromosomally normal embryos are replaced to the mother, the chances of a healthy pregnancy and live birth would increase. Nevertheless, pre-implantation genetic technologies have limitations, such as not giving many advantages in young women with a good prognosis, being invasive due to high embryonic manipulation and not having a very high efficacy, since a normal genetic structure is not a sufficient condition to have an embryonic implantation rate greater than 50%.
Therefore, finding new selection criteria to better define the embryonic reproductive potential remains a significant challenge in ART.
There are several new fields in which international research is trying to find new non-invasive selection methods, such as miRNA, metabolomics, cell cumulus analysis, non-invasive genetic tests and the study of embryonic morphodynamics via time-lapse imaging.
The hypothesis that there is a relationship between metabolic parameters and embryo viability has been upheld in numerous studies over the past 30 years. The analysis of the embryo metabolism involves either the detection of specific nutrients that have been consumed from the surrounding culture medium or the detection of metabolic factors that are secreted from the embryo into the culture medium. Specifically, the embryo‟s glycolytic activity (Gardner et al., 2011), pyruvate consumption (Hardy et al., 1989) and changes in amino acid concentration (Brison et al., 2004) in the spent culture medium have been strongly correlated with embryo developmental competence and pregnancy outcome. However, randomized control trials are still missing to confirm the value of these measurements to select the best embryo for transfer. Moreover, it is difficult to standardize these methods so as to use them routinely in embryology lab since embryo metabolism and development is a dynamic procedure that is affected by various factors such as patient characteristics (Bellver et al., 2015). However, a recent meta-analysis (Vergouw et al., 2014) highlights the need to validate this technology, in clinical practice, since it has not been proven to offer any additional predictive value over the classical morphological embryo assessment.
Cumulus cells (CC) transcriptomic analysis is another promising technique to evaluate, indirectly, the developmental potential of the enclosed oocyte and consequently of the embryo. The quantitative analysis of the expression of single CCs genes that are implicated in follicular development and oocyte maturation was first achieved with quantitative real-time PCR (qRT-PCR) or microarray technology, that within the past years, enabled the simultaneous analysis of transcripts of several target genes (Uyar et al., 2013). Some transcriptome analysis studies, with qRT-PCR of CCs from individual cumulus-oocytes complexes (COCs), revealed a group of genes that are correlated with the oocyte‟s developmental potential to blastocyst stage (Scarica et al., 2019), implantation
rates (Gebhardt et al., 2011) live birth rates (Ekart et al., 2013), and pregnancy outcome (Iager et al., 2013). However, Despite the suspected impact of CCs gene expression on the prediction of IVF outcome, the method needs to be standardized further to be used in clinical practice, as CCs gene expression varies significantly in patients with polycystic ovary syndrome (PCOS) as compared to non-PCOS patients (Haouzi et al., 2012) and is differentially affected from patient‟s age (McReynolds et al., 2012) and stimulation protocol (Borgbo et al., 2013), making this method not yet applicable in the clinic.
The first use of time-lapse technology in embryology was in 1929 to map the development of rabbit embryos (Massip and Mulnard, 1980). The first reported use of time-lapse in human IVF however, was not until several decades later in 1997, when the technology was used to map the development of human embryos that had been fertilised by intracytoplasmic sperm injection (ICSI) (Payne et al., 1997). Since then, several time-lapse devices have been devised, and many studies have been performed to assess how time-lapse technology could improve prospects in embryology for both
human and non-human animal species.
Traditionally, embryo monitoring subsequent to IVF involves removing embryos from the culture environment, at least once per day, to evaluate embryo morphology and developmental progression. This method only provides embryologists with one still image, per day, of a dynamic process. Additionally, culture conditions such as temperature, pH, and humidity are disrupted which in turn has been shown to have a detrimental impact on the embryo‟s development (Campagna et al., 2001). Time-lapse technology is a non-invasive, alternative to this approach that permits continuous, uninterrupted, observation of embryo development from the point of fertilisation to transfer (Kirkegaard
et al., 2012). Under time-lapse imaging, the culture conditions are
more detailed information such as cleavage patterns, the timing of cell divisions and changes to embryo morphology.
This technology involves the acquisition of multiple images from each embryo in short time intervals (5–15 min) during embryo development. Since time-lapse microscopy that allows the continuous, real-time, observation of embryo development, enabled the evaluation of morphological parameters at the early stages of development and time points at crucial cell cycle events are recorded, it was hoped that it would be possible, also through the use of system‟s software and with specific algorithms, to be able to find parameters that would give substantial indications on the capacity of development and embryonic implantation.
Several studies have been carried out in this regard, some were looking for correlations between the times of the various cell divisions and the ability to develop into blastocysts or implantation capacity (Wong et al., 2010; Meseguer et al., 2011; Dal Canto et
al., 2012; Pribenszky et al., 2017), others tried to find a correlation
between morphokinetic times and embryonic aneuploidies, hoping to be able to replace invasive pre-implantation genetic tests (Chavez et al., 2012; Campbell et al., 2013; Basile et al., 2014). Although these studies associate embryo aneuploidy with its morphokinetic profile, many authors argue that time-lapse image technology cannot be considered as a reliable alternative to preimplantation genetic screening (Ottolini et al., 2014; Rienzi et
al., 2015). Moreover, three large-scale studies (Kaser and
Racowsky, 2014; Polanski et al., 2014; Armstrong et al., 2018) have failed to correlate time-lapse technology with improved clinical, ongoing and live birth rates when compared with standard incubation. Accordingly, a recent well designed randomized controlled trial (RCT) failed to correlate the use of time-lapse microscopy (TLM) with a significant increase in implantation (IR) and clinical pregnancy rates (CPR) (Goodman et al., 2016).
At this time there is not yet a full agreement between the observations made in the various studies (Kaser and Racowsky, 2014), probably due to laboratory and clinical routine differences that lead to slight but significant differences in the study of morphokinetics, including also the moments considered crucial in embryonic development and the nomenclature used.
Although it is not possible to define the embryonic chromosomal structure through observation of its morphokinetics, in this Ph.D. study, we wanted to deepen the use of this tool to see if it is possible to observe competence in embryonic implantation parameters observing its development in time-lapse, after having established the embryonic chromosomal structure with pre-implantation genetic tests. The aim is to identify some parameters to further enhance selection among euploid blastocysts and the current predictive power of aneuploidy testing per se.
This new technology, in addition to the possibility to identify developmental mechanisms of the embryos until now unknown, has improved the knowledge of the early stages of human beings, encouraging new fields of research. An example is the work of Coticchio and colleagues, where they described human fertilization, redesigning with higher precision the timing of previously described parameters and illustrating previously unrecognized or neglected aspects of fertilization (Coticchio et al., 2018) (Fig.2).
Fig.2 Temporal distributions of morphokinetics events occurring during fertilization and relevant to meiotic resumption, pronuclear dynamics, chromatin organization, and cytoplasmic/cortical modifications. (Coticchio et al., 2018)
After fertilization it has been observed different biological events that can bring anomalies of the cell cycle or aberrant forms of divisions (Berrisford and Cater, 2015). Some of the most common morphokinetic abnormalities that have been observed are:
- direct cleavage (DUC), during which, generally in the first cellular divisions, a cell divides directly into three cells (Kalatova
et al., 2015; Zhan et al., 2016)
- cytokinesis failure (CF), this is an event that is observed during the cytokinesis of a blastomere. Cytokinesis is interrupted and the two extremities of the dividing blastomere return to reunite centrally reforming a single blastomere (Iwata et al., 2014).
- chaotic cleavage. In this case, it can be observed a division that leads to the formation of two or more blastomeres with irregular dimensions and the simultaneous appearance of different cellular fragments (Athayde Wirka et al, 2014)
-reverse cleavage (RC), during which, one or more blastomeres fuse immediately after a correct division, returning to form a single blastomere (Liu et al., 2014)
- multinucleation: it is defined as the presence of more than one nucleus in a single blastomere, including micronuclei (Desai et al, 2018).
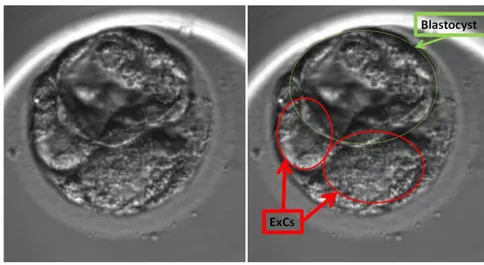
-cell exclusion (Fig. 3). During the compaction and morulation it is possible to observe the presence of cells that are excluded from the cellular mass and that, after blastocysts hatching from the zona pellucida, remain isolated within the zona, because they are no longer part of the constituent mass of the embryo (Ebner et al., 2009).
Fig. 3 Example of two cells excluded from the embryonic cell mass at the starting blastulation stage
3. AIMS
The clinical introduction of time-lapse has marked a real new era that opened new knowledge of the fascinating initial stages of human life. In this Ph.D. study, we wanted to investigate the basic knowledge of the first phases of human embryogenesis, in particular focusing our attention on the excluded cells, trying to shed light on them, and trying to describe their behavior, their formation and the possible biological significance of their presence in the human embryo. Furthermore, we wanted to investigate the presence of new predictors of implantation and LB, analyzing the pre-implantation development by time-lapse, of embryos defined as euploids by PGT-A and transferred with SET.
4. RESULTS AND DISCUSSION 4.1 Retrospective time-lapse study (ExCs)
In our preliminary study for the observation of developmental anomalies and their possible correlation with the formation of excluded cells, we have observed the development of 64 embryos with time-lapse imaging technology. We considered in this study only embryos that reached compaction at morula stage because it is possible to define a cell as excluded, only after compaction, during the morula stage, since only at that moment the mass forming the embryo is defined. The embryos were obtained from women between the ages of 33 and 41 years (37.5 mean age), undergoing IVF cycles between 2015 and 2017, randomly selected.
We excluded from the analysis the embryos with errors in fertilization, 19/64 (appearance of more or less than two pronuclei or two polar bodies), and only embryos with regular fertilization, 45/64, that showed or did not show anomalies in the cleavage were considered.
Among the 45 embryos that were correctly fertilized, 27/45 did not show cleavage abnormalities (Tab 1) and 18/45 had abnormal cleavage (Tab 2).
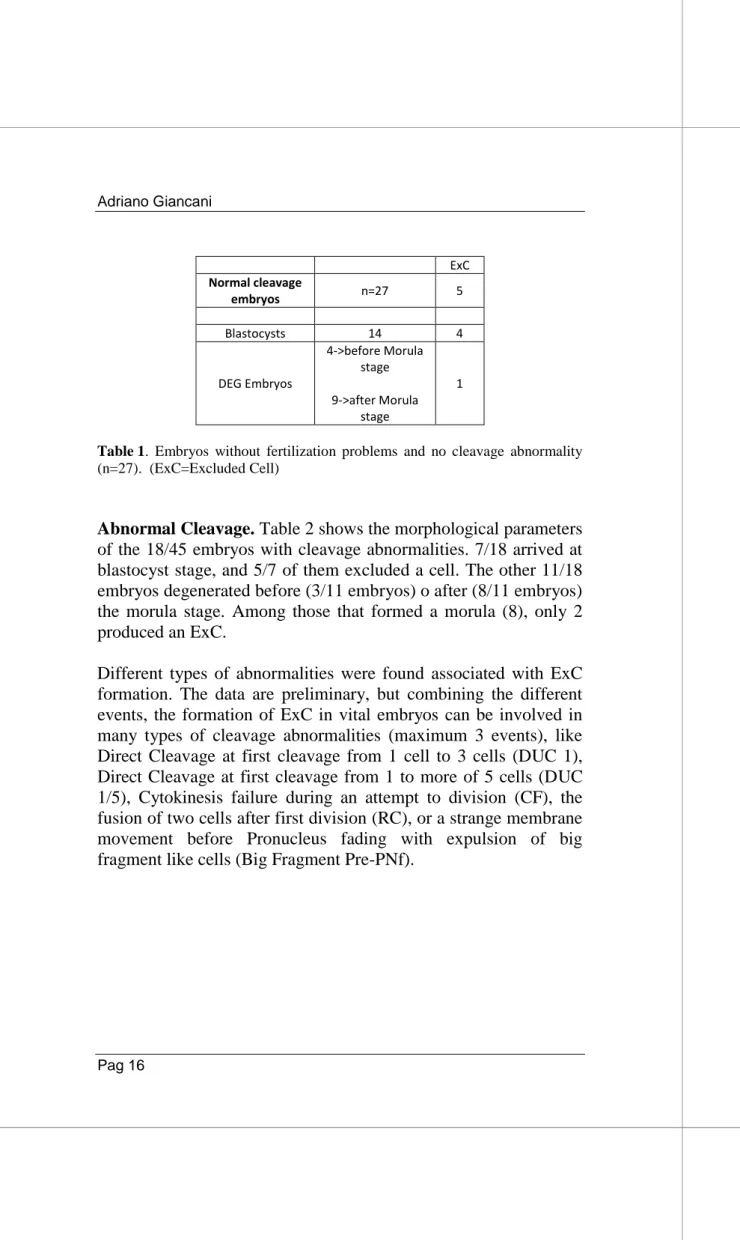
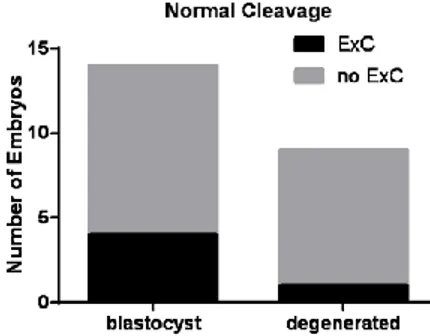
Normal Cleavage. Considering the 27/45 embryos without cleavage abnormalities, Table 1 shows that 14/27 arrived at blastocyst stage and 4/14 of these embryos showed the exclusion of a cell. The other 13/27 embryos degenerated before (4/13 embryos) o after (9/13 embryos) the morula stage. Among those that arrived a morula (9), only 1 produced an ExC.
ExC Normal cleavage embryos n=27 5 Blastocysts 14 4 DEG Embryos 4->before Morula stage 9->after Morula stage 1
Table 1. Embryos without fertilization problems and no cleavage abnormality (n=27). (ExC=Excluded Cell)
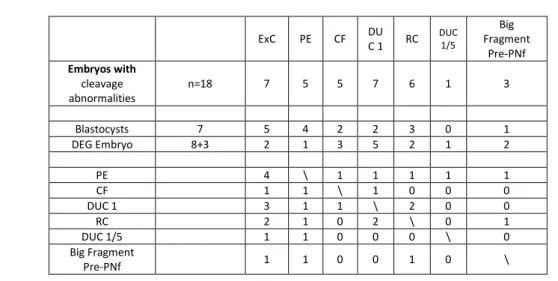
Abnormal Cleavage. Table 2 shows the morphological parameters of the 18/45 embryos with cleavage abnormalities. 7/18 arrived at blastocyst stage, and 5/7 of them excluded a cell. The other 11/18 embryos degenerated before (3/11 embryos) o after (8/11 embryos) the morula stage. Among those that formed a morula (8), only 2 produced an ExC.
Different types of abnormalities were found associated with ExC formation. The data are preliminary, but combining the different events, the formation of ExC in vital embryos can be involved in many types of cleavage abnormalities (maximum 3 events), like Direct Cleavage at first cleavage from 1 cell to 3 cells (DUC 1), Direct Cleavage at first cleavage from 1 to more of 5 cells (DUC 1/5), Cytokinesis failure during an attempt to division (CF), the fusion of two cells after first division (RC), or a strange membrane movement before Pronucleus fading with expulsion of big fragment like cells (Big Fragment Pre-PNf).
ExC PE CF DU C 1 RC DUC 1/5 Big Fragment Pre-PNf Embryos with cleavage abnormalities n=18 7 5 5 7 6 1 3 Blastocysts 7 5 4 2 2 3 0 1 DEG Embryo 8+3 2 1 3 5 2 1 2 PE 4 \ 1 1 1 1 1 CF 1 1 \ 1 0 0 0 DUC 1 3 1 1 \ 2 0 0 RC 2 1 0 2 \ 0 1 DUC 1/5 1 1 0 0 0 \ 0 Big Fragment Pre-PNf 1 1 0 0 1 0 \
Table 2 Embryos without fertilization problems but with cleavage abnormalities (n=18).
Among the 45 embryos that were correctly fertilized, 47% (21/45) arrived at blastocyst stage, 38% (17/45) degenerate after morula Stage and 15% (7/45) degenerated before morulation. We evaluated the percentage of embryos that formed ExC only in the first 2 groups, embryos that arrived at blastocyst stage versus embryos that degenerated after morula stage. This is because we can define the exclusion of a cell from the embryonic mass only after morulation and compaction, therefore we excluded embryos that degenerated before morulation.
We compared the frequency of ExC formation in the 45 embryos without fertilization problems that completed the development up to blastocyst stage (21/45) and the embryos that did not complete in vitro development and degenerated between morulation and blastocyst stage (17/45). The results show that the first group (blastocysts), produced a higher percentage of ExC compared to
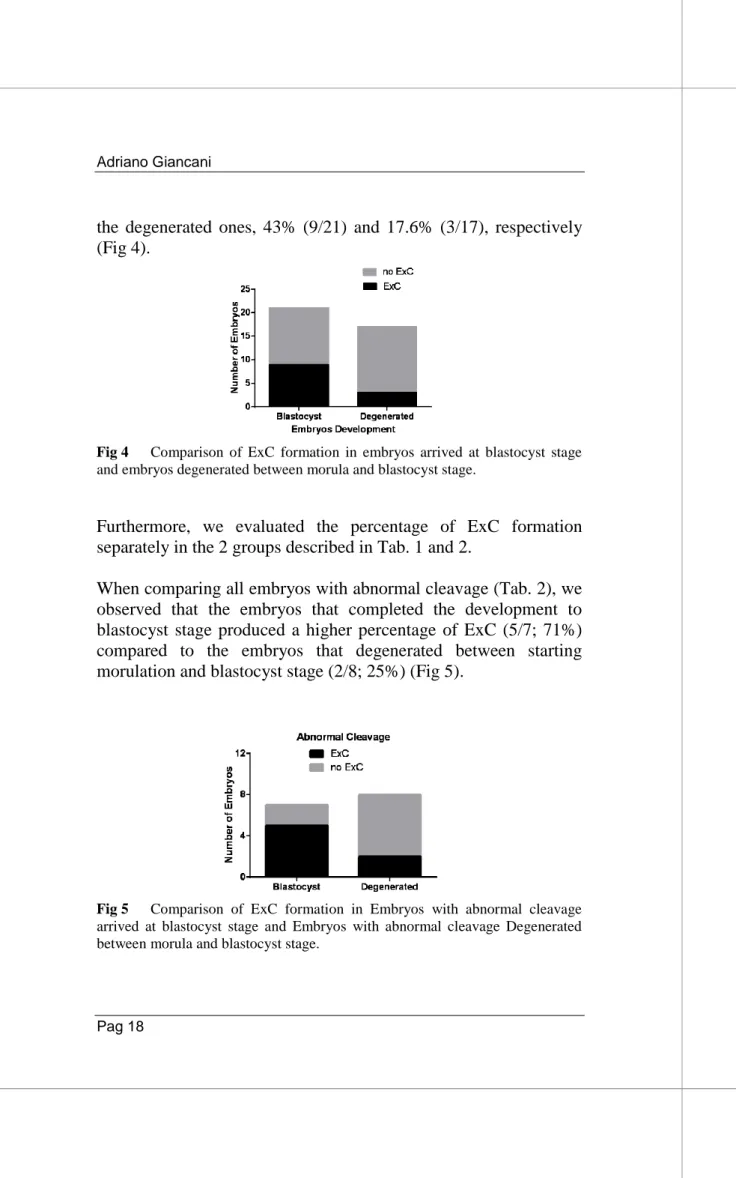
the degenerated ones, 43% (9/21) and 17.6% (3/17), respectively (Fig 4).
Fig 4 Comparison of ExC formation in embryos arrived at blastocyst stage and embryos degenerated between morula and blastocyst stage.
Furthermore, we evaluated the percentage of ExC formation separately in the 2 groups described in Tab. 1 and 2.
When comparing all embryos with abnormal cleavage (Tab. 2), we observed that the embryos that completed the development to blastocyst stage produced a higher percentage of ExC (5/7; 71%) compared to the embryos that degenerated between starting morulation and blastocyst stage (2/8; 25%) (Fig 5).
Fig 5 Comparison of ExC formation in Embryos with abnormal cleavage arrived at blastocyst stage and Embryos with abnormal cleavage Degenerated between morula and blastocyst stage.
About the blastocyst without cleavage abnormalities (Tab. 1), 4 of the 14 that arrived at blastocyst stage produced ExC (28.6%), while only 1 out of 9 of those that degenerated between morula stage and blastocyst stage (11%) produced ExC (Fig 6).
Fig 6 Comparison of ExC formation in Embryos with normal cleavage arrived at blastocyst stage and Embryos with normal cleavage degenerated between morula and blastocyst stage.
Moreover, if we considered only the embryos that arrived at blastocyst stage with (Tab.2) or without abnormal cleavage (Tab.1), we observed that embryos with an abnormal cleavage produced with more frequency ExC (5/7; 71%) compared to embryos with a normal cleavage (4/14; 28.6%) (Fig 7).
Fig 7 Comparison of ExC formation in Embryos arrived at blastocyst stage, with normal cleavage or abnormal cleavage.
Moreover, a higher percentage of embryos forming ExC was found in the group of embryos with abnormal cleavage. In fact, when we considered the totality of embryos without fertilization problems that arrived at least at morula stage (38/45), 22% (5/23) of those without abnormalities in the cleavage (23/38) produced ExC, while 47% (7/15) of embryos showing Cleavage abnormalities (15/38) produced a higher percentage of ExC (Fig 8).
Fig 8 Comparison of the formation of ExC in all Embryos without fertilization problems (excluding the embryos Degenerated before Starting Morulation).
Taken into consideration these results, it is possible to note how the exclusion of cells from the Embryonic mass could be associated with a better embryonal capacity to develop to
blastocyst, and a better embryonal capacity to face the possible abnormality of cleavage.
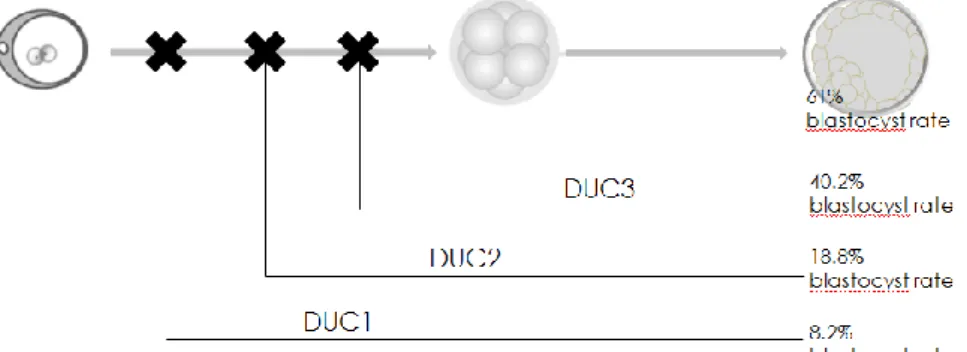
It has been observed in some studies that cells excluded from monkey embryos are strongly chaotic, presenting loss and gain of different chromosomes, as is also the case for the visible cellular fragment in embryogenesis. It is probable, considering the evolutionary closeness of primates to humans, that this is applicable also to humans (Daughtry et al., 2019). The formation of excluded cells has been associated with cleavage abnormalities, such as the direct cleavages studied by Zhan in 2016. Also, in this study (Zhan et al., 2016) it was possible to observe how the embryos that presented a direct cleavage had a greater probability of forming cells excluded (66.8%; 152/232) compared to those embryos with a normal cleavage (8.9%, 171/1913). Zhan additionally observed that although there is a lower rate of blastulation compared to embryos without developmental anomalies (Fig. 9), embryos presenting direct cleavage during the early stages of development have the same competence to develop compared to embryos without anomalies, with a comparable life birth rate (41%, 34.8% respectively).
Fig. 9 Comparison of the blastocyst rate between embryos presenting a direct cleavage in the first, second or third cell division (respectively DUC1, DUC2, DUC3) and embryos with normal cleavage (Zhan et al., 2016).
Furthermore, Lagalla in 2017 has observed how analyzing the excluded cells with array-CGH and comparing them with the trophectoderm of the respective blastocysts, it is evident that they often present aneuploidies that are not present in the embryos that are instead euploid (Fig. 10) (Lagalla et al., 2017).
Fig. 10 Comparison between the genetic structure of excluded cells and the respective trophectoderm of the blastocysts in which they were formed, through array-CGH analysis (Lagalla et al., 2017).
It is possible to speculate the ExC formation may be a possible rescue of a mitotic error. In fact, although >95% of aneuploid embryos show meiotic segregation errors (Ottolini et al, 2015), it was observed an impact of around 4-5% of mosaicism at the blastocyst stage because of a mitotic error (Capalbo et al., 2017).
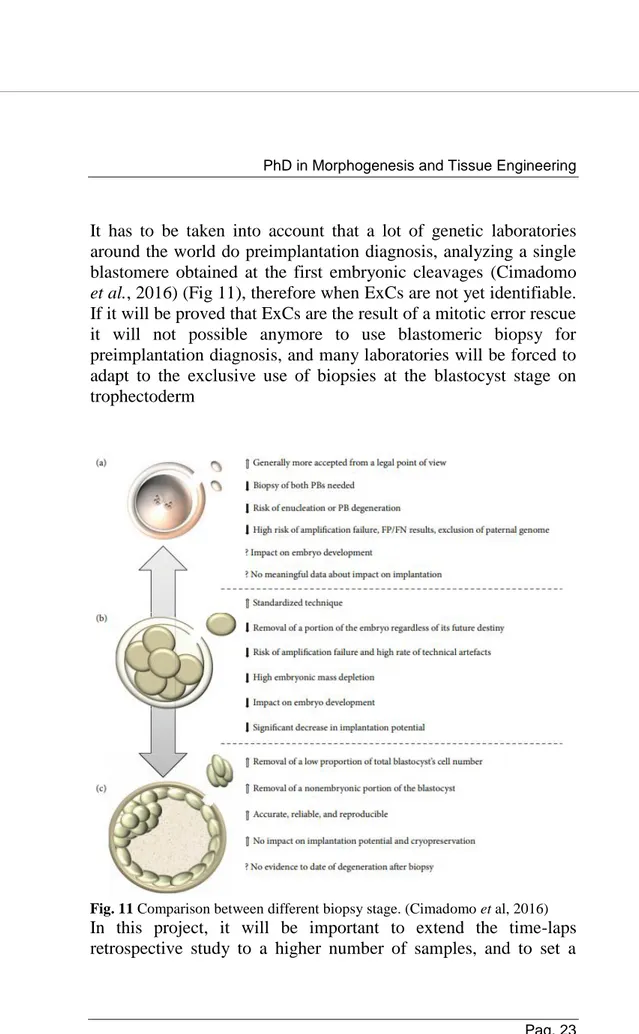
It has to be taken into account that a lot of genetic laboratories around the world do preimplantation diagnosis, analyzing a single blastomere obtained at the first embryonic cleavages (Cimadomo
et al., 2016) (Fig 11), therefore when ExCs are not yet identifiable.
If it will be proved that ExCs are the result of a mitotic error rescue it will not possible anymore to use blastomeric biopsy for preimplantation diagnosis, and many laboratories will be forced to adapt to the exclusive use of biopsies at the blastocyst stage on trophectoderm
Fig. 11 Comparison between different biopsy stage. (Cimadomo et al, 2016) In this project, it will be important to extend the time-laps
molecular prospective study of ExCs to better understand if the Exclusion of these Cells is really a possible natural mechanism of rescue from mitotic errors in embryo development in order to reduce a mosaicism rate.
It is possible to collect the cells excluded in those embryos subjected to a TE biopsy for PGT-A (Fig12), without damaging the embryo, since these cells are no longer part of the embryonic mass. After the collection of a good number of cells, it will be possible to create a kariomapping protocol (Ottolini et al, 2015) that will allow us to compare the cells to the karyotype profile of the respective embryo, allowing us to understand the derivation and the state of this cells.
Fig.12 A, collapsed blastocyst, before the TE biopsy, with a visible excluded cell underneath (ExC). B, Biopsy sampling of a TE fragment from the Blastocyst, with a visible ExC underneath. C, Retrieval of the excluded cell after biopsy of the TE of the Blastocyst
4.2 Time-lapse predictive power on euploid embryo life birth rate
To try to identify the predictive parameters of embryonic competence associated with preimplantation genetic diagnosis (Fig 13), also trying to take into account the differences between the various laboratories that often make the results of embryonic morphokinetic publications difficult to compare, we divided this study into two phases, involving three European IVF centers.
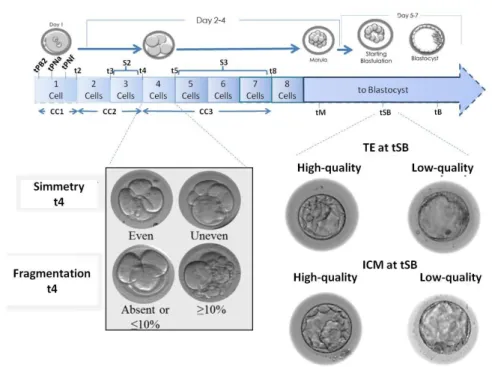
Fig 13. Schematization of the parameters of embryonic development analyzed. The time-lapse parameters adopted in this study were previously defined by Ciray and colleagues (Ciray et al., 2014). The ICM and TE were graded according to the parameters defined in the Istanbul consensus (Balaban et al., 2011). Class 1 and class 2 were clustered together and defined “high quality”, while class 3 was defined as “low quality”. All the evaluations were performed by a single expert operator at each center.
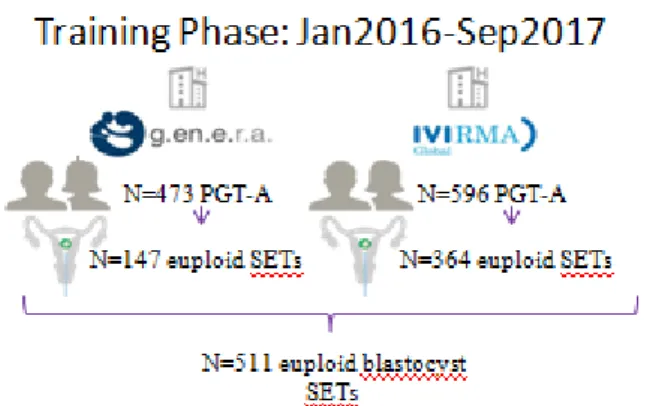
In the first phase, we tried to define a prediction model of LB after vitrified-warmed euploid blastocyst transfer, in the second phase, we tried to validate the prediction model built in the first phase. Phase 1: retrospective cohort study of PGT-A cycles performed between January 2016 and September 2017 at two European IVF centers: G.EN.E.R.A. Center for Reproductive Medicine (Rome, Italy; IVF center 1) and IVI (Valencia, Spain; IVF center 2) (Fig. 14)
Fig. 14 First phase study design, cycle enrolment and allocation. Phase 2: the model defined in the first phase of the study was then tested for its consistency and reproducibility on an independent dataset encompassing the euploid blastocyst SETs performed after PGT-A cycles between September 2017 and June 2018 at IVF center 1 and 2, as well as at a further clinic, European Hospital (Center for reproductive medicine, Rome, Italy; IVF center 3). (Fig. 15)
Fig. 15 Second phase study design, cycle enrolment and allocation.
In study phase 1, 473 and 596 PGT-A cycles were conducted at IVF centers 1 and 2, respectively. At IVF center 1, 201 cycles were excluded since a sequential culture media was adopted, 49 and 76 PGT-A cycles resulted in no blastocyst and no euploid blastocyst produced, respectively. At IVF center 2, 98 and 134 PGT-A cycles resulted in no blastocyst and no euploid blastocyst produced, respectively. Therefore, 147 and 364 first vitrified-warmed euploid blastocyst SETs were included from IVF centers 1 and 2, respectively (Figure 14). The overall LB rate was 40.5% (N=207/511). There was no difference between the two IVF centers (43.5%, 95%CI 35.5-52.0, N=64/147 versus 39.3%, 95%CI 34.3-44.5, N=143/364, respectively; p=NS). The maternal age was also similar in the two IVF centers (38.1±3.2, 26-44 yr and 37.8±3.7, 25-45 yr; p=NS).
Among the morphodynamic parameters under investigation (Fig 13), a significant association was reported from the univariate analyses for tPB2, t4, t5, s3, cc3, t8, tM and tSB (Tab 3). However, the tM was the only parameter found significant from the multivariate analysis (OR: 0.97, 95%CI 0.94-0.99, p=0.04). Among the static morphological features at tB (Fig 13), both the
ICM and TE were significantly associated with LB after euploid blastocyst vitrified-warmed SET from the univariate analyses. However, only the TE was still significant from the multivariate analysis (OR: 0.38, 95%CI 0.23-0.63, p<0.01). Both maternal age and IVF centers did not show any association with LB.
Tab. 3 Logistic regression on the morphodynamic and static parameters taken into consideration as possible implantation predictors
We did not include the blastulation timings any further (tB and tEB), due to the different blastocyst biopsy policies adopted at the two centers, namely, simultaneous zona opening and TE cells retrieval versus day3 zona opening-based approach at center 1 and 2, respectively (Fig16).
Fig.16 The two different blastocyst biopsy approaches. Down the IVF center 1 approach and Up the IVF Centre 2 approach. (Cimadomo et al, 2016)
A cut-off value for tM was then calculated based on the logistic regression analysis. In detail, a tM of 80hr during the
preimplantation development of an euploid blastocyst
corresponded to the 50th percentile of prediction of LB after vitrified-warmed SET in the training set. Therefore, we built our predictive model based on TE morphological quality evaluated at tB (high versus low) and tM (<80hr versus ≥80hr) (Figure 16). This model resulted in a significant AUC 0.65 (95%CI 0.6-0.7, p<0.01) from the ROC curve analysis. Specifically, the euploid blastocysts characterized by a high-quality TE at tB and a tM <80hr resulted in an LB rate of 62.5% (N=45/72; 95%CI 50.3-73.4) after vitrified-warmed SET (Figure 17).
Fig. 17 Predictive model to obtain a greater live birth rate, extrapolated from the analysis of the first dataset of the two centers in phase 1
In the second phase, the predictive model was applied to an independent dataset from IVF centers 1 and 2, as well as from IVF center 3. This design allowed us to test its consistency and reproducibility on this validation set. In this study phase, 126, 280 and 140 PGT-A cycles were conducted at IVF centers 1, 2 and 3, respectively. After blastocyst culture and aneuploidy testing, 74, 168 and 77 first vitrified-warmed euploid blastocyst SETs could be included from IVF centers 1, 2 and 3, respectively (Figure 15). The overall LBR was 42.9% (N=137/319), consistent among the 3 IVF centers (45.9%, 40.5% and 45.5% at IVF centers 1, 2 and 3, respectively). Figure 18 shows the LBR in each specific group (group A, high quality TE and tM<80hr: N=37/67, 55.2%, 95%CI 42.6-67.2; group B, high-quality TE and tM≥80hr: N=82/184, 44.6%, 95%CI 37.3-52.1; group C, low-quality TE and tM<80hr: N=5/17, 29.4%, 95%CI 11.4-55.9; group D, low quality TE and tM≥80hr: N=13/51, 25.5%, 95%CI 14.8-39.9; chi-squared=0.01; Fisher‟s exact test group A versus D p<0.01 and power=0.9, group B versus D p=0.02 and power=0.7). The results were consistent
among the 3 IVF centers (e.g. group A: 61.5%, 55.0% and 50.0% at IVF center 1, 2 and 3, respectively; group D: 30.0%, 25.0% and 23.1% at IVF center 1, 2 and 3, respectively). The ROC curve analysis outlined an AUC 0.6, 95%CI 0.54-0.66.
Fig. 18 Validation of the predictive model built in phase 1, on a new dataset obtained from the three European IVF centers.
The ROC curve analysis defined an AUC of 0.65 derived from a model including TE quality and tM to foresee euploid blastocysts chance to result in LB. To validate this model an independent dataset (validation set) of vitrified-warmed euploid blastocysts SETs from IVF centers 1 and 2 was therefore tested including the data from a third IVF center. A lower predictivity was reported in the validation set (AUC of 0.6). This reduction in the AUC is imputable to the lower number of euploid blastocysts, characterized by a low-quality TE, transferred in the validation set (N=68 of 319 blastocysts, 21.3%) with respect to the training set (N=169 of 511 blastocysts, 33.1%). Nevertheless, the live-birth rate (LBR) of euploid blastocysts with a high-quality TE and undergoing morulation before 80hr was ~55%, almost matching
the same group of embryos from the training set (~62%). These data confirm the predictivity of both these parameters and encourage their future use to conduct embryo selection.
Taking into consideration these results, which significantly link the quality of embryonic development and the competence of implantation and development of euploid embryos, it is possible to deduce the importance for the embryo of compaction with consequent arrival at the morula stage and the quality of the TE. In the clinical routine, since the majority of world laboratories do not use the time-lapse systems, embryos are checked and selected for transfer at specific moments of development: day 1, to observe their correct fertilization, day 3 to observe the trend of cell divisions and possibly in day 5-6 for blastocyst cultures, they are rarely observed in day 4, the moment in which the embryo reaches the morula stage, since no particular advantages have been observed. All this, above all to avoid stress for the embryos that must be removed from their incubators to be observed under a microscope. Even in time-lapse systems, laboratories tend to evaluate and take into consideration the same evaluation criteria of a static evaluation, thus standardizing the evaluation for all patients.
In this study, however, it was seen that an observation of the formation of the morula associated with an evaluation of the embryonic genetic arrangement can be predictive of the development capacity of an embryo once transferred. If this will be confirmed, it will be necessary to establish a new important timing to be checked, the 80h of embryonic development. This time coincides with the fourth day of development, the day when the embryos complete the transition from cleavage stages, in which the blastomeres appear distinct and spherical, passing to the state of compacted morula, characterized by cells closely interconnected with margins no longer visible (http://atlas.eshre.eu).
The morula stage remains little described in the literature, however, recent data have shown that it is fundamental for the formation of the blastocyst, for the instruction of the first cell lineages and consequently for the whole process of embryonic development. For example, in the early stages of embryonic development, the embryo remains silent using the maternal material and is reaching the 4 cells stage, the moment in which in the human species the embryonic genome is activated, that there is a metabolic change through a transition from a metabolic state with low activity and low energy, characteristic of the cleavage stage, to one with more active glucose-based aerobic activity, in preparation for the formation and expansion of the blastocyst in the following phases (Leese, 2012). Moreover, the morula stage undergoes further changes in gene expression prior to compaction. The transition from cleavage to morula stage is recognizable by the activation of over 667 genes that are mainly enriched in genes implicated in metabolic processes involving proteins, lipids, amino acids and carbohydrates (Vassena et al., 2011). From a development point of view, the morula stage is the phase in which the first crucial decision on cell fate is made, in which blastomeres will contribute to the ICM or TE compartment (Mihajlović and Bruce, 2017). In this phase, those with the expression of transcription factors specific to pluripotency remain restricted to ICM cells, excluding markers of TE lineage (Vassena et al., 2011). In the early studies of the 1980s, it was observed that the differential distribution of cellular determinants during 8-10 cell stages generated functional diversity between internal and external cells (Johnson and Ziomek, 1981), and this different position, inside or outside the morula was instrumental in giving instructions on the fate of cells (Fleming, 1987).
The compaction and subsequent development of the morula involve the flattening of the blastomeres and the consequent formation of junctions between them, followed by a massive redistribution of surface microvilli and other components of the
plasma membrane (Iwata et al., 2014). During morula formation a substantial remodeling of the cellular cytoskeletal component was observed with formation of adherent junctions (Perez-Moreno et
al., 2003), which ensure mutual lateral adhesion between epithelial
cells, thus contributing to the maintenance of epithelial cell polarity, important for the activation of cell differentiation pathways (Ralston et al., 2010; Hirate et al., 2013). There is the formation of filopodia, which extend between adjacent blastomeres, causing cellular flattening during compaction (Fierro-González et al., 2013). Furthermore, new information has revealed the crucial role of an actin zipping mechanism, located at the margins of adjacent cells that are prone to the formation of an actomyosin ring, ensuring intercellular sealing and establishing a permeability barrier required by the expansion process of blastocele (Zenker et al., 2018). Finally, some studies conducted
with conventional incubation and static morphological
classification systems have also highlighted the importance of the evaluation of the morula to predict the quality and/or competence of the blastocyst (Tao et al., 2002; Skiadas et al., 2006; Feil et al., 2008; Ebner et al., 2009; Fabozzi et al., 2016). All this evidence together with our data stimulates future investigations on this developmental phase. Further data focused on this topic are fundamental to understand how euploid embryos acquire, maintain or lose their reproductive competence during morulation.
The only parameter for a static morphological evaluation that has been identified in our study in association with the reproductive competence of euploid embryos is the quality of the TE. Instead, the ICM was not found to be a predictive parameter, following the correction of the analysis with the other confounding factors associated with the implantation capacity of euploid embryos (including the quality of the TE), although its importance in the establishment of a pregnancy was observed in several studies (Licciardi et al., 2015; Subira et al., 2016).
We could not take into consideration the full expansion stage of the blastocysts since in the center 2, in order to perform the trophectoderm biopsy, perforation of the zona pellucida was practiced on day 3 to allow the embryo to hatch at the blastocyst stage (Cimadomo et al 2016) (Fig 16). This forced us to interrupt evaluation at the blastocyst formation in order to standardize the databases of the various centers.
Possible mechanisms through which a higher grade of TE better predicts live birth outcome may be linked to improved TE functions. Indeed, TE is the compartment that give rise to extraembryonic structures, including the placenta, essential for maintaining pregnancy. Moreover, it is plausible that at this stage of embryo development, a blastocyst ready to start the complex process of implantation needs healthy TE cells that have the capacity to invade the endometrium (Norwitz et al., 2001) (Fig.19).
Fig.19 the complex system of cross-talk between endometrium and blastocyst necessary for the implant (Norwitz et al., 2001)
Moreover, TE secretion of human chorionic gonadotropin (hCG) plays a critical role in maternal-embryonic crosstalk and in the establishment of a successful pregnancy. Several studies have shown how hCG modulates endometrial receptivity, supporting the remodeling of the tissue in preparation for implantation (Licht et
al., 2001). Moreover, at the endocrine level, an increasing hCG
increases maternal serum progesterone allowing the maintenance of the corpus luteum (Niswender et al., 2000) (Fig. 20). The hCG is the first known signal deriving from the human embryo, through which the embryo is able to trigger the mechanisms of maternal-fetal immunological tolerance (Tsampalas et al., 2010).
Fig. 20 schematization of the complex maternal-fetal communication system for the establishment of immunological tolerance and maintenance of the implant (Norwitz et al., 2001)
Interestingly, it has been observed that embryos with good quality trophectoderm can produce higher levels of hCG earlier (Dokras et
al., 1993; Lopata, 1996). This is perhaps because a good quality
trophectoderm has more cells, with good qualities, ready to produce hCG, leading to more enhanced signaling than blastocysts with poor quality TE, with greater probability of implantation and
maintenance of pregnancy. Moreover, recent studies have shown an overexpression in TE of genes involved in adhesion and cellular communication associated with positive pregnancy outcomes (Parks et al., 2011).
All these evidences support our data, making us hope for their use in clinical practice. Although the morulation time is one of our morphodynamic parameters, but it will still be possible to use it as a predictive parameter of the implantation capacity of euploid embryos even in clinics that do not have time-lapse culture systems, checking embryonic development on day 4 and defining the arrival at the morula stage before or after 80h. However, future studies would be needed that should better reveal the cellular and molecular events that characterize the morulation process. Thanks to this study it was possible to define a new algorithm to be associated with embryonic euploidy in order to define the capacity of implantation and maintenance of pregnancy, whose consistency and reproducibility have been independently validated in different IVF centers. Furthermore, the algorithm can be used regardless of the type of biopsy used in the blastocyst stage. However, this model was constructed and validated under specific culture conditions in the three centers (continuous media, time-lapse incubator and low-oxygen atmosphere). Therefore, further investigations are needed to understand their validity under different conditions. A multicenter randomized controlled study is desirable, in which the predictive model defined here is applied or not, to finally evaluate its real value.
5. MATERIALS AND METHODS 5.1 Stimulation Protocol and eggs collection
Patients underwent controlled ovarian stimulation (COS) for IVF with four different protocols based on their characteristics (Ubaldi
et al., 2014): long gonadotrophin-releasing hormone agonist
(GnRH agonist), GnRH antagonist, microdose GnRH agonist flare-up, as previously described (Oron et al., 2014), or natural cycle (Schimberni et al., 2009). All patients that underwent COS were treated by recombinant follicle-stimulating hormone (FSH; Gonal-f, Merck-Serono, Germany; Puregon, Organon, Netherlands). Final maturation of follicles was induced by the administration of 10,000 IU of hCG (Gonasi, IBSA, Switzerland) or a single subcutaneous bolus of GnRH agonist (50 IU Buserelin; Sanofi-Aventis, Canada) when three follicles reached an average diameter >17 mm. Transvaginal ultrasound and serum oestradiol concentrations were used to monitor the cycle. Oocyte retrieval was performed under vaginal ultrasound guidance 35 h after hCG trigger.
5.2 Semen evaluation and preparation
Semen samples were collected at the time of oocyte retrieval by masturbation after 3–7 days of sexual abstinence and were allowed to liquefy for at least 20 min at 37°C. Sperm concentration, motility, and morphology were assessed by microscopy according to World Health Organization (2010) criteria. First, sperm samples were washed by centrifugation at 1200 g for 10 min in Sperm Wash Medium (IrvineScientific, USA). The supernatant is removed very gently with a pasteur pipette taking care not to touch the pellet. Subsequently, 0.1-0.5 ml of culture medium (Continuous single-step medium, CSCM, Irvine Scientific) is stratified onto each pellet and test tubes are left in the incubator (6% CO2 and 5% O2, 37 ° C) inclined at 45 ° for 15-45 minutes, at
of which 0.1-0.2 ml of medium are taken (taking care to take the part that is higher up, away from the pellet) that are transferred to a clean sterile 5 ml tube. Samples were stored at room temperature until ready for ICSI. The incubation period of the prepared spermatozoa was approximately the same as that of the oocytes.
5.3 Oocyte preparation
During oocyte retrieval, the aspirated follicular fluid was passed to the adjoining laboratory. COCs were identified in sterile plastic dishes, rinsed, transferred in 5 ml tubes with 1 ml of continuous media (Continuous single-step medium, CSCM, Irvine Scientific) and 0.3 ml of oil, pre-equilibrate overnight in the incubator (IrvineScientific, USA), and incubated at 37°C in an atmosphere of 6% CO2 and 5% O2 until the ICSI procedure, about 2h. Immediately before the ICSI procedure the cumulus and corona cells were removed by a brief exposure to HEPES-buffered medium (Irvine Scientific, USA or Quinn‟s Advantage, Cooper Surgical Fertility Companies, USA) supplemented with 5% Human Serum Albumin (HSA, Irvine Scientific or Quinn‟s Advantage) and containing 20 IU/ml of Hyaluronidase (Hyaluronidase Solution 80 IU/ml, Irvine Scientific or Quinn‟s Advantage) covered with oil (IrvineScientific, USA) . To enhance enzymatic removal of the cumulus and corona cells, the oocytes were aspirated in and out of a hand-drawn Pasteur pipette with an approximate inner diameter of 170 µm. Denudation was performed in a four-well culture dish. Denuded oocytes were then examined under an inverted microscope at X200 magnification to assess integrity and the stage of maturation. Only morphologically normal-appearing mature oocytes with a visible first polar body were microinjected.
ICSI was performed using a Nikon (Nikon Ltd, Tokyo, Japan) Diaphot TMD microscope equipped with Hoffman Modulation contrast, a 37°C heating stage (cod. MS100; Linkam Scientific Instruments Ltd, Surrey, UK), two Narishige MM188 electric coarse movement controls, two MO188 3D oil hydraulic micromanipulators and two Narishige IM6 injectors for holding the oocyte and the injector pipette (Narishige Ltd, Tokyo, Japan).
5.5 Microtools for ICSI
The holding pipette used to hold the oocyte in position during ICSI had an outer diameter of 100 µm, an inner diameter of 15-20 µm and a distal tip angle of 35° (Sunlight medical, U.S.A). The microinjection needle pipette had an inner diameter of 5 µm, a heat-formed spike and a distal tip angle of 39° (Sunlight medical, U.S.A).
5.6 ICSI procedure
ICSI was performed at x400 magnification. Immediately before microinjection, a 10 µl droplet of 10% polyvinylpyrrolidone (PVP, IrvineScientific, USA) was placed in the middle of a Petri dish and surrounded by eight droplets of 10 µl HEPES-buffered medium (Irvine Scientific, USA or Quinn‟s Advantage, Cooper Surgical Fertility Companies, USA) supplemented with 5% Human Serum Albumin (HSA, Irvine Scientific or Quinn‟s Advantage). The droplets were then covered by pre-equilibrated mineral oil to avoid evaporation. Finally, 1–2 µl sperm suspension were added to the middle of the drop containing PVP and an oocyte was placed in each surrounding droplet. When the sperm suspension was added to the drop containing PVP, motile spermatozoa migrated into the viscous medium, which decelerated the spermatozoa allowing for careful observation and facilitation of aspiration. A single
spermatozoon of apparently normal morphology was selected, immobilized by touching the tail and aspirated tail first in the injection pipette. The pipette containing the sperm cell was then moved from the PVP droplet into one of the peripheral droplets containing an oocyte. The oocyte was rotated to locate the first polar body at the 6 o‟clock position, held by gentle suction on the holding pipette, and the equatorial plane located in focus. The spermatozoon was then ejected slowly, close to the tip and the edge of the pipette and pushed gently horizontally from the 3 o‟clock position deep into the ooplasm. To ensure that the spermatozoon was always deposited aneuploid, gentle suction was carefully applied to break the oolemma membrane. The cytoplasmic organelles and the spermatozoon were ejected back into the cytoplasm slowly with the smallest amount of medium possible. Thereafter the injection pipette was gently withdrawn, and the oocyte released from the holding pipette. This procedure was repeated for each oocyte. The injected oocytes were then rinsed in continuous media (Continuous single-step medium, CSCM, Irvine Scientific) and placed one by one in an equilibrated culture slide for development.
5.7 Embryo Culture
Embryo culture was conducted individually in 25μl of a continuous culture media (Continuous single-step medium, CSCM, Irvine Scientific) covered by pre-equilibrated mineral oil in a microwell of the EmbryoSlide (Vitrolife, Sweden). No media change-over in day3 was performed. Only EmbryoScope time-lapse incubator (Vitrolife, Sweden) was used. Images of each embryo were acquired every 15 min on 7 different focal planes. Embryos were cultured until blastocyst stage in 6%CO2 and 5%O2.
5.8 Assessment of oocyte survival, fertilization and further development
Oocytes were observed 12–18 h (Day1) after ICSI to assess the presence of pronuclei (PN) and polar bodies. Fertilization was considered normal only when two distinct pronuclei containing nucleoli were present. Embryo cleavage of the two-pronuclear oocytes was evaluated after 48 h (Day3) of in-vitro culture. For each embryo, the number and size of the blastomeres were recorded, as well as the percentage of anucleate fragments.
Subsequently, the embryos are again checked on the fifth and sixth day to evaluate the arrival at the blastocyst stage.
5.9 Blastocyst biopsy and PGT-A
Blastocyst biopsy was done with two different methods in different clinics.
PGT-A was conducted by qRT-PCR or next-generation sequencing (NGS) at IVF center 1 (Treff et al., 2012; Capalbo et al., 2015; Vera-Rodriguez et al., 2018), by array-CGH or NGS at IVF center 2 and 3 (Mir et al., 2013; Fiorentino et al., 2014; Capalbo et al., 2015; Vera-Rodriguez et al., 2018).
5.9.1 Zona opening in day3 and biopsy
On day 3 of embryonic development, the zona pellucida was breached using a laser and all embryos were transferred again in EmbryoSlide for a further 48 hours at 37C in 5% O2 and 6% CO2. On the morning of day 5, blastocyst development was assessed. Expanding and expanded blastocysts underwent biopsy of herniating trophectoderm cells using a laser. Cavitating morulas and early blastocysts were transferred to a fresh individual 30 L drop of blastocyst medium and biopsy was attempted 24 hours
later. The biopsy procedure performed on a blastocyst is detailed in (McArthur et al., 2005).
5.9.2 Direct zona opening and biopsy
All the biopsy procedures were performed on the heated stage of a Nikon IX-70 microscope, equipped with micromanipulation tools, in dishes prepared with three droplets of 10 ml HEPES-buffered medium (Sage) overlaid with pre-equilibrated mineral oil. A diode laser (Research Instruments, Cornwall TR11 4TA, UK) was used to assist the opening of a 10 – 20 mm hole in the zona pellucida. The biopsy procedure performed on a blastocyst is detailed in a recent paper (Maggiulli et al., 2019). The blastocyst is positioned on the holding pipette to give a clear view of the ICM at 7 o‟clock (i.e. away from the biopsy pipette) under high power magnification. An opening in the embryo zona is made with a series of laser pulses, working inwards from the outer surface of the zona taking care to avoid damaging the embryo. As soon as the aperture is wide enough to accommodate the passage of several TE cells ( 10 mm), the biopsy pipette is carefully pressed against the zona, gently expelling medium through the breach to release the TE cells from the internal surface of the zona. This step helps to avoid blastocyst collapse during the subsequent TE cell separation. Once the TE is detached from the internal surface of the zona, 3 – 10 cells are aspirated into the biopsy pipette with gentle suction. The laser was positioned to the thinnest part of the aspirated cells and several laser pulses were directed at the junctions between cells to disconnect the aspirated cells from the body of the embryo. In the meanwhile, a moderate suction was applied to the biopsy pipette to stretch the target cells, helping the separation from the body of the embryo. Five to ten TE cells are aspirated into the TE biopsy pipette and released into the biopsy drop.
5.10 Embryo vitrification and warming
Vitrification and warming procedures were then performed according to Cobo and colleagues (Cobo et al., 2012). In detail, the blastocysts were equilibrated at room temperature for 14 min in an equilibration solution (ES) containing 7.5% ethylene glycol (EG) and 7.5% dimethyl-sulfoxide (DMSO) and then transferred in a vitrification solution (VS) with 15% e.g. 15% DMSO, 0.5% sucrose for 1 min. During this phase, the blastocysts were rinsed to dilute the excess of ES. In the last 10 s the blastocysts were placed onto the tip of the Cryolock (Biotech Inc., USA) surrounded by a minimal volume of VS. The devices were lastly plunged into liquid nitrogen. For the warming procedure, the Cryolock was immediately moved from liquid nitrogen into a thawing solution (TS) of 1 M sucrose for 1 min at 37°C. Then, the blastocysts were moved to a dilution solution (DS) of 0.5 M sucrose for 3 min and lastly into a washing solution (WS) for 5 min at room temperature. The blastocysts were then cultured at 37°C for at least 2 h before embryo transfer (ET) into the same medium used for embryo culture. Two kits of vitrification/warming were used during this study (a variable included in the logistic regression analyses as putative confounder), namely, Kitazato BioPharma Co. (Japan) and Irvine Scientific
5.11 Cryopreserved embryo transfer
Frozen embryo transfers (FET) were performed either with a modified natural cycle or after hormone replacement therapy-based protocol. Specifically, in the modified natural protocol a single intramuscular dose of 10,000 IU hCG was administered when the leading follicle was >17 mm and the endometrium measured >7 mm with a trilaminar aspect; in these patients, 400 mg/day of micronized vaginal progesterone (Progeffik; Effik, Italy) was administered as luteal phase support starting 36–40 h post-hCG
administration (Day 0). In the hormone replacement therapy-based protocol, oral oestradiol valerate (Progynova; Bayer, Germany) was administered three times a day from the second or third day of the cycle and when the endometrial thickness reached at least 7 mm, 600 mg/day of micronized progesterone was started (Day 0). ETs were performed after 4 and 6 days of progesterone supplementation according to cleavage or blastocyst stage, respectively. The blastocysts to be transferred were selected independently from morphodynamic parameters and based only on an euploid chromosomal constitution. SETs were not performed in case of i) an endometrium <7mm and/or not trilaminar, ii) endometrial fluid in the uterine cavity, iii) hydrosalpinx, and/or iv) high levels of TSH (≥2.5 IU/l).
5.12 Establishment of pregnancy
-hCG was measured 11 or 14 days after cleavage or blastocyst stage FET, respectively. BPL was here defined as serum -hCG levels 50 IU/l in at least two pregnancy tests (2–4 days elapsed between consecutive examinations), but not associated with any ultrasonographical evidence of intrauterine or extrauterine pregnancy 20–25 days after FET. Clinical pregnancy was defined as the presence of a gestational sac with fetal heartbeat. A clinical pregnancy loss earlier than the 20th gestational week was considered a miscarriage.
5.13 Retrospective time-lapse analysis
For each analysis, a specific database was set up with embryos cultured in specific periods of time and the videos produced in time-lapse were analyzed retrospectively.
For all embryos, it was possible to record the different cellular events thanks to the incubator software (Embryo-Viewer, Vitrolife) which allows performing a retrospective analysis of embryos development (Fig. 13). The time-lapse parameters adopted in this study were previously defined by Ciray and colleagues (Ciray et
al., 2014):
- time to Second Polar Body extrusion (tPB2) - time to appearance of Pronucleus (tPNa) - time to fade of Pronucleus (tPNf)
- time to cellular division (t2=2Cells; t3=3cells, etc) - time between the Second Polar Body extrusion (tPB2) and first (t2) cell division (cc1)
- time between the first (t2) and third (t4) cell division (cc2) - time between the third (t4) and seventh (t8) cell division (cc3) - length of synchronization of cell divisions (s2, t4-t3)
- synchronization of cleavage pattern (s3, t8-t5). - time to morulation (tM)
- time to Start Blastulation (tSB)
The time of blastocyst formation (tB) and blastocyst full expansion (tEB) were not included
Furthermore, static parameters are included in the analysis like: -symmetry of the blastomeres at the 4-cell stage embryo (symmetric/asymmetric)
-fragmentation (<10% / ≥10%) at the 4-cell stage,
Therefore, to reach a consensus between the different IVF centers involved in the study, the grading of the ICM and TE quality was here performed at the tB. The ICM and TE were graded according to the parameters defined in the Istanbul consensus (Balaban et al., 2011). Class 1 and class 2 were clustered together and defined “high quality”, while class 3 was defined as “low quality” (Fig. 13). All the evaluations were performed by a single expert operator
at each center. The morphodynamic and static morphological criteria were tested through univariate and multivariate regression analyses. Finally, a receiver operating characteristic (ROC) curve analysis was used to estimate their predictive power upon euploid blastocyst reproductive competence (i.e. LB).
Furthermore, the following parameters were also evaluated for the study on the excluded cells:
- the direct cleavage - cytokinesis failure - chaotic cleavage. - the reverse cleavage,
- blastocyst collapse and riexpansion -embryo degeneration
For all these parameters it has been evaluated the possible correlation with the presence or absence of cells excluded during embryonic development
5.14
Statistic AnalysisThe investigated euploid blastocysts were divided into two groups based on whether they resulted in LB or not (i.e. reproductively-competent versus -inreproductively-competent). Continuous variables are shown as mean±SD and range. Shapiro-Wilk tests were conducted to investigate whether the data followed a normal (Gaussian) distribution. T-tests or Mann- Whitney U tests were conducted to assess statistically significant differences. Categorical variables are shown as rate with 95%CI. Fisher‟s exact or chi-square tests were conducted to assess statistically significant differences. We investigated the morphodynamic and static criteria from univariate and multivariate regression analyses by defining the binary
response parameter as LB achieved („„1‟‟) or not („„0‟‟). If required, the morphokinetic timings were converted from continuous variables into categorical by defining the cut-off value corresponding to the 50th percentile of prediction of LB. ROC curve was used to test the predictive value of the model with respect to LB achievement. P values<0.05 were considered statistically significant. Statistical analyses were performed using the Statistical Package for the Social Sciences 19 (SPSS). Power calculations were performed using G-Power v3.1.
6. ACRONYMS LIST 6.1 General acronyms list
Array-CGH : Array-Comparative Genomic Hybridization ART : Assisted Reproduction Techniques
Big Fragment Pre-PNf : expulsion of big fragment like cells CC : Cumulus Cells
COCs : Cumulus-Oocytes Complexes COS : controlled ovarian stimulation CF : Cytokinesis failure
CPR : clinical pregnancy rates
CSCM : Continuous single-step medium DMSO : dimethyl-sulfoxide
DS : dilution solution DUC : direct cleavage
DUC1: direct cleavage in the first cell division DUC2: direct cleavage in the second cell division DUC3: direct cleavage in the third cell division
DUC 1/5: Direct Cleavage at first cleavage from 1 to more of 5 cells
EG : ethylene-glycol ES : equilibration solution ET: Embryo transfer Exc : Excluded Cells
FET : Frozen embryo transfer FSH : follicle-stimulating hormone
GnRH : gonadotrophin-releasing hormone hCG : human chorionic gonadotropin ICM: inner-cell-mass
ICSI : Intracytoplasmic Sperm Injection IR : implantation rates
IVF: In Vitro Fertilization
IVF center 1: G.EN.E.R.A.; Center for Reproductive Medicine, Rome, Italy