SAPIENZA Università di Roma Facoltà di Farmacia e Medicina
Ph.D in
MORPHOGENESIS AND TISSUE ENGINEERING XXXI CICLO (2015 – 2019)
(A.A. 2017/2018)
A FRAMEWORK FOR IMAGE-BASED, AUTOMATED, MULTILEVEL ANALYSIS OF THE CYTOSKELETAL
MORPHOLOGY
Ph.D. Student Garima Verma
With the deepest gratitude, this thesis is dedicated to my parents and my brother
Declaration
I, Garima Verma, hereby declare that this Ph.D. thesis titled “A framework for image-based, automated, multilevel analysis of the cytoskeletal morphology” is the record of the original work done by me under the guidance of Tutor Prof. Mauro Grigioni, Dirigente Ricerca Bioingegneria presso Istituto Superiore di Sanità, Rome, Italy, and Co-Tutor Prof. Chaitanya Athale, Associate professor, Indian Institute of Science Education and Research, Pune, India. To the best of my knowledge, this work has not formed the basis for the award of any degree/diploma/certificate or a similar award, to any candidate in any University.
Dr. Garima Verma Sapienza University of Rome, Italy
Acknowledgments
I want to express my sincere appreciation to my supervisor Dr. Mauro Grigioni who has inspired and taught me many things and gave extensive useful suggestions during my doctoral degree program. At this present moment of accomplishment, my deep special thanks goes to him for his big support, encouragement as well as his guidance.
I am extremely grateful to my co-supervisor Prof. Dr. Chaitanya Athale at Indian Institute of Science Education and Research, Pune, India, who guided me to accomplish my research work for 6 months in the last year of my doctoral degree program. Without his motivation and kind support as well as suggestions this Ph.D. would not be achieved.
Many heartfelt thanks are owned to my doctoral committee members Prof. Mariano Bizzarri for his inspiration, valuable suggestions and advice.
I thankfully appreciate to Dr. Alessandro Palombo and Giuseppe D'Avenio for their valuable suggestions, guidance, and huge support.
I expand my thanks to my Lab mates and all my colleagues at Sapienza University of Rome (Italy), Istituto Superiore di Sanità, Roma, Italy and Indian Institute of Science Education and Research, Pune, India.
I would also like to give tremendous thanks and appreciation to all of my family and my friends, who helped me a lot with their moral support and valuable help. Besides, all of them, my deep sense of gratitude towards all of the people who knowingly and unknowingly helped me a lot in the successful completion of my Doctorate Thesis.
Index
ABSTRACT ... 1
SOMMARIO ... 3
1. Introduction and Background ... 5
1.1 System Biology ... 8
1.2 Cytoskeleton-I-beams of cell Biology ... 10
1.3 Measurable parameters of cytoskeleton and system ... 16
1.4 Quantitative methods to measure cytoskeleton parameters ... 17
1.5 Tools to analyze cytoskeleton morphology ... 24
1.6 Image analysis ... 27
1.7 Filopodyan- image analysis open-source software ... 28
1.8 Neuron J – Image J plugin ... 28
2. Aims ... 29
3. Results ... 32
3.1 A confocal based quantitative analysis in the cytoskeleton architecture of MCF-7 cells ... 32
3.2 Application of bioinformatics to analyse confocal image ... 32
3.3 Pilot study for cytoskeleton analysis ... 33
3.4 Validation of Image J software for the analysis of Cytospace Experiment ... 40
3.5 Analysis for identifying cytospace data through matlab ... 41
3.6 Validation of Matlab programming language for the analysis of Cytospace Experiment ... 53
3.7 Identification of analysis of neurite ... 56
3.8 Neurite data analysis ... 64
3.9 Neurite results produce from cell profiler ... 68
3.10 Neurite changing in different image in different time interval ... 76
3.11 Programming for detecting the neurites ... 78
3.12 Comparison of the total neurites length under various time series data ... 80
3.13 Detection of neurites from time period 0 to 2 hrs by Neuron J ... 82
3.14 Detection of neurites in PC12 cells from time period 0-11
hrs by Matlab and neuron J ... 85
3.15 Further detection of the neurite using Neuron J along with their logistic curves ... 86
3.16 Length of single neurite measured by Image J ... 98
3.17 Length of single neurite measured by Filopodyan ... 100
3.18 Validation of a tools and softwares for identification and analysis of Neurites ... 102
4. Material and Methods ... 103
4.1 The experimental sample of cytospace ... 103
4.2 Pipeline for the analysis of cells and Tubulin by MATLAB ... 105
4.3 Method for the analysis of neurites ... 118
4.4 Dataset of neurites ... 122
4.5 The experimental algorithms and protocols ... 123
Conclusion ... 130
Appendix A ... 131
References ... 138
List of publications ... 150
ABSTRACT
Aim: The aim of this thesis is to create an integrated bioinformatic
framework for the quantitative assessment of cytoskeleton (CSK) morphology. In this research, we demonstrated the validity of this approach by applying computational biology in two cases: Cytospace images and neurite images. I used these 2 dataset of images as reference dataset to build the computational biology framework and to verify its functionality. To accomplish this, I have analyzed Cytospace optical and confocal microscope images by Image J and MATLAB programming.
I have analyzed the neurite number and length of PC 12 cells by using the following software and tools: (a) custom made tool MATLAB, (b) Cell profiler, (c) Image J, and (d) Filopodyan. Outside this goal of CSK analysis I have also analysed the microcalcification and parenchyma images through my framework to verify the capability of the framework to operate on a different scenario.
Methods: We have developed various algorithms and protocols
for the analysis of nuclei, tubulin and microtubules. Each component of the cytoskeleton plays a very essential role in understanding the behaviour of the cell. Moreover, the confocal images were processed properly to extract the information regarding the cytoskelton.
Finally, we also studied PC 12 cells and selected / designed useful algorithms to analyze changes in the number and length of neurites.
Results: In the first part of this thesis we presented an in-silico
model constructed by using measurable parameters obtained from microscope images of cells. We use image analysis software Image J to identify cell shape parameters – including surface area, roundness, fractal dimension, such as entropy and coherency. In
the second part of thesis, we also analysed area, perimeter, major and minor axis, circularity, the solidity of the nuclei and tubulin by MATLAB programming. In the third part of the thesis, we anlayzed the dynamics of neurites by developing MATLAB scripts, using also other analysis tools such as Image J, Neuron J.
Conclusion: I have build a computational framework to analyse
in quantitative manner images from optical and confocal microscopy.
During the first two years of PhD course I select, develop and integrated bioinformatics protocols and algorithms to define optimized operational pipelines. I used two datasets of image as reference to tuning the computational pipeline.
In the last period of phd course I can apply my optimised framework on microscopy images for detection and analysis of neurites. By means of the application of the framework was possible reduce considerable time of biologist to analyse the images.
SOMMARIO
Obiettivo: Lo scopo di questa tesi è quello di creare un framework
bioinformatico integrato per la valutazione quantitativa della morfologia del citoscheletro (CSK). In questa ricerca, abbiamo dimostrato la validità di questo approccio applicando la biologia computazionale alle immagini di due casi sperimentali. Ho usato questo set di dati di immagini come set di dati di riferimento per creare il framework di biologia computazionale e verificarne la funzionalità. A tale scopo, ho analizzato alcune immagini da microscopia ottica e confocale del progetto CYTOSPACE mediante la programmazione di Image J e MATLAB.
Da immagini provenienti da un altro esprimento ho analizzato il numero e la lunghezza dei neuriti delle cellule PC 12 utilizzando i seguenti software e tools: (a) MATLAB, (b) Cell Profiler, (c) Image J e (d) Filopodyan. Al di fuori dell'analisi CSK ho anche analizzato le immagini di microcalcificazione e parenchima (da mammografie provenienti da un altro esperimento) attraverso il mio framework per verificare la capacità del framework di operare su uno scenario diverso.
Metodi: abbiamo sviluppato vari algoritmi e protocolli per l'analisi
di nuclei, tubulina e microtubuli. Ogni componente del citoscheletro svolge un ruolo molto essenziale nella comprensione del comportamento della cellula. Le immagini confocali sono state opportunamente elaborate per estrarre le informazioni relative al citoscheletro.
Infine, abbiamo anche applicato il framework computazionale ad immagini di cellule PC 12, al fine di individuare e misurare le variazioni dinamiche dei neuriti in termini di numero e lunghezza.
Risultati: Nella prima parte di questa tesi abbiamo presentato un
modello in silico costruito utilizzando parametri misurabili ottenuti da immagini di cellule acquisite tramite microscopia ottica e
confocale. Abbiamo usato il software di analisi delle immagini Image J per identificare i parametri di forma delle cellule, tra cui area superficiale, rotondità, dimensione frattale, entropia e coerenza. Nella seconda parte della tesi, abbiamo anche analizzato area, perimetro, asse maggiore e minore, circolarità, solidità dei nuclei e della tubulina mediante codice appositamente sviluppato in MATLAB. Nella terza parte della tesi, abbiamo analizzato la dinamica dei neuriti sviluppando script MATLAB, usando anche altri strumenti di analisi come Image J, Neuron J.
Conclusione: ho costruito un framework computazionale per
analizzare in modo quantitativo le immagini provenienti da microscopia ottica e confocale.
Durante i primi due anni del corso di dottorato ho selezionato, sviluppato e integrato protocolli e algoritmi bioinformatici per definire pipeline operative ottimizzate. Ho usato due set di dati di immagini come riferimento per ottimizzare la pipeline computazionale.
Nell'ultimo periodo del corso di dottorato ho applicato il framework ottimizzato su immagini al microscopio per il rilevamento e l'analisi dei neuriti. Tramite l'applicazione del framework è stato possibile ridurre considerevolmente i tempi del biologo per analizzare le immagini.
Chapter 1
1. Introduction and Background
The adult human body contains an estimated 3.72.1013 cells [1] that can be grouped into about 200 specialized cell types making [2] the complex tissue architecture that forms 60 organs [3].
Cells are the building blocks of the human body, and are responsible for taking the nutrients from the food and converting those nutrients into energy. Furthermore, with the developments in molecular biology, several molecular components and mechanisms have been revealed by which embryos are patterned; therefore, require cells to acquire different fates and tissue adopt their defined shapes. In particular, careful experimentations and quantifications, mathematical and computational modeling are increasing day by day to formulate the assumptions and to test the hypothesis, although a lack of appropriate methods and tools to represent multiscale multicellular systems hampers these studies.
In a normal living cell, all activities originate in the cytoskeleton which plays very important active roles. The cytoskeleton study is a very dynamic area of research from the past 70 years. The dynamic 3D structure popularly know as “cytoskeleton” is a system consisting of three main kinds of protein filaments crucial for the cell shape, division, and function within all three domains of life [4]. Important questions have since opened up at the interface of cell biology, system biology, molecular biology, tissue morphogenesis, and computational biology. Can we identify physiological changes and characterize the cellular biophysical properties such as density, connectivity, solidity, stiffness in drug treatments? Which methods and techniques we can use to represent the large image dataset of the cytoskeleton? Using tools and ideas from the computational biology and system biology approach, this interface can be understood.
On the one hand, the new techniques are required to manipulate and visualize these large image datasets of the cytoskeleton. Upcoming technologies such as high throughput screening [5,6] gene expression analysis [7,8] quantitative image analysis [9–11] are essential to produce the high-resolution quantitative data on these dynamics across the spatiotemporal scales. On the other hand, new methods for the mathematical and computational modeling are much needed to investigate the consequences of such a feedback; generally, the behavior of the complex dynamics systems goes far beyond the human intuition. The large amounts of quantitative data that are being acquired are prompting scientists to new hypothesis explaining the complex biological processes. Therefore, expressing these hypothesis regarding to the rules and equations which are simulated by the computer allows to investigate the non-intuitive consequences of the complex interactions and feedback loops. In addition, quantitative comparison of the simulation results with the large data enables one to narrow down the set of the possible hypothesis to a few plausible one that will able to tested experimentally (fig 1) .
Dynamic models are normally ordinary differential equations of the genetic regulatory networks which can allow us to know the cell fate decisions of multipotent cells and how their trajectories through gene expression space are constrained by the interaction between genes [12]. Spatial models such as reaction-diffusion models enable us to reveal how the morphogen gradients influenced these decisions and moreover how the patterned gradient can spontaneously be aroused through the interaction between diffusible morphogens [13]. Finally, cell-based models in which the cells are introduced as discrete and motile agents, can allow us to grasp how specific tissue shapes emerge from the mechanical interactions in between the cells [14].
Figure 1: The representation of the computational modeling in quantitative biology. To answer in a unified way for the specific biological questions, observations and quantification of wet lab experimentations are followed by the construction of the mathematical and computational models that are expressed through hypotheses and assumptions. Moreover, these kinds of models are basically based upon first principles and/ or on hypothesis which derived from the new experiments and observations. When the quantification of the large experimental data is used for the parameterization, simulations to generate predictions that can be used directly for the statistical validation against experimental data. The validation may be imposed model refinement or suggest the data acquisition of new experimental data. Through the immense repetitions between the workflow of experimentation, quantification, and modeling which
increase the confidence in the validity of the model assumptions leads to the formation of the new biological theory.
In this thesis, a framework is introduced, which facilitates the exploration of such an interplay. Conceptually, this framework is based upon the integration of the methods to tackle some specific questions on the interactions between the cytoskeleton complexity and morphogenesis.
1.1 System Biology
System Biology (SB) deals with the living systems and the functions of the system that is in the functional context, for example – free energy transduction, or formation of the building blocks for the biosynthesis. However, the biological systems have evolved such that these functions can take place under a great variety of conditions: gene expression or even evolutionary changes. Cellular function and its capability to adapt are dependent on the interactions between the components of the system. Therefore, system biology used to understand the system behavior based on the interactions and characteristics of the cellular components and their microenvironment [15]. System biology is an approach that is widely classified into two types: a) Pragmatic system biology b) System – theoretic biology.
Pragmatic system biology reveals the use of large scale molecular interactions along with the omics approach, which is aiming at building the multidisciplinary network by implementing mathematical modeling. It is helpful to understand the system behavior based on the interactions and characteristics of the cellular components and their microenvironments [16]. System biology involves various applications of experimental, theoretical, and modeling techniques with the goal to study of living organisms at all levels, from molecular, through cellular to the behavioral perspectives. Various developments in this field make it possible to understand determine and perform multidimensional analysis of modeling and design of the cytoskeleton architecture from
experimental data and system-level analysis [17]. Furthermore, the computational models are used widely to build and make improvements based on the analysis and comparison with the data experiments [18]. A large number of ongoing research and technological developments are making it possible to manipulate the great challenge of exploration. Clearly, morphogenesis and phenotypic differentiation are space and time-dependent processes: [19] morphological plasticity, rather than being the result of genetic “adaptation”, and shows the influence of external physio-chemical parameters on any material system and is, therefore, an inherent, inevitable property of the organism [20].
System biology (SB) is a discipline designed to promote an integrated approach focussed on the redefinition of the main idea of a biological system, understood as an integrated unit of observable entities, interconnected by quantifiable relationships capable of expressing a biological function that has, within certain limits, apparent autonomy. The model at the center of observation is again the cell and cellular populations - along with its micro-environment - since in biology subordinate levels to this are incapable of meeting the indispensable requirements of the living: replication, evolution, and differentiation. SB's approach tends to promote an organic vision that is capable to combine complexity prospects (both bottom-up and top-down), which are not immediately assimilable to classical concepts of deterministic causality but, as in the physics approach, to the concept of probabilistic causality.
SB believes that the flow of info that directs the observed processes depends on the concurrence of molecular signals (DNA, proteins, lipids, etc.) and physical (system state parameters: forces, thermodynamics constraints) interrelating with a dynamic not linear. This makes it necessary to have data on which statistical assessments can be conducted. This is how made possible by high throughput techniques (genomics, proteomics, metabolomics, fractal analysis, etc.) that can provide large amounts of information. Biological organisms are the major entities that maintain their existence through the mutual interactions of its parts [21], i.e., they
are systems [22]. Therefore, this view has become the dynamic force for an approach to study the complex biological systems, which is known as system biology. While the system biology approach has a major influence on the field of molecular biology and cellular biology, it has the main impact on developmental biology. However, providing the current focus on the quantification and dynamic modeling in order to understand the developing systems of the cytoskeleton, the role of the system biology is becoming essential to the developmental biology.
In this thesis, system biology is regarded to as a support discipline in the computational strategies to gain insight into the phenotype of the original and treated exposed cells. System biology is used for the quantitative collection, analysis, and integration of cancer cells [23]. System biology heavily relies on the mathematics of dynamical system theory as well as computational simulation methods in order to thoroughly understand the dynamics of the system and its emergent properties that arise from the nonlinear interactions [24]. Hence, within system biology, different methodologies are applied to produce high- throughput data that can be used to understand cellular phenotypes. In particular, SB highlights the detailed quantification of the experimental data in order to make the quantitative computational models that can be able to provide the testable predictions and able to validate these models against the experimental data. Owing to this fact, the integration of the huge amount of the data generated is the key challenge that system biology is facing in order to understand the establishment of a holistic view of the functioning of the cell.
1.2 Cytoskeleton – I- beams of the cells
In the earliest 1900s, several biologists started to explore the amazing deformations that some cells could undergo. They have assumed that the mechanical properties of those cells generated by a specific scaffolding of subcellular components, which is commonly known as the cytoskeleton by Paul Wintrebert in 1931.
One of the main discoveries in this regard was the characterization of the three-dimensional protein network, called cytoskeleton, which supports the various cell compartments and connects them mechanically and functionally one to another. The cytoskeleton is made up of a network of filamentous proteins that can dynamically polymerize and depolymerize. This network consists three types of structural elements that have different dimension and different molecular nature: microtubules (having a thickness of 25 nm and formed by the combination of alpha and beta-tubulin molecules), intermediate filaments, (which have a thickness of 8-10 nm and can be formed from various types of filamentous proteins such as cytokerite, vimentina, desmin, and laminae) and microfilaments (having a thickness of 5 nm and are formed by the association of G-actin molecules). One of the significant functions cited for the cytoskeleton was that of mechanical support of the cell: it was clear from the very beginning that the cytoskeleton elements were to ensure the maintenance of the cellular form in coherence with its differentiated state, to support and maintain core position and suspend the various organelles within the cytoplasm. However, the static view of the cytoskeleton that the study of cellular biology has profoundly and rapidly changed, pointing out how the cytoskeleton actually acts, and above all, to link the various cell compartments and thus virtually participate in active mode to most of the functions performed by the cells.
The cytoskeleton is composed of multiple strands of 3 main components microtubules, intermediate filaments, and microfilaments [25]. Each of these polymers has very different geometrical, biochemical, and mechanical properties. But some of the cell have more specialized cytoskeleton filaments [26]
(A) (B) (C)
Figure 2: Image of cytoskeletal components (A) microfilaments, (B) microtubules, (C) intermediate fibers
A systematic picture of a typical cell with its constituents is presented in Figure 3 along with a photo of a fibroblast cell with cytoskeleton components observed. In figure 3, the numerous components have their own responsibilities. For example, the main intracellular entity cell governing not only the mechanical behavior but also the cell shape, in a very active manner, which is an interconnected network of polymerized filaments called cytoskeleton.
Interestingly, the cytoskeleton is a cellular scaffolding that is bathed into the cytoplasm, and it is responsible for the structural integrity and mechanical force generation into the living cells. It also provides the cell with mechanical stability; it also helps in connecting the different parts by serving as tracks for the transportation of the proteins and vesicles and also directs the intracellular organization through the positioning of the organelles. Moreover, the cytoskeleton also plays a crucial role when cells rearrange their internal components as they grow, divide or adapt to changing the circumstances. Therefore, these processes are accompanied and driven by the rearrangement of the cytoskeleton.
Figure 3: A) The demonstration of a cell with its prominent constituents reproduced from [27] with permission from Macmillan Publishers Ltd. B) Fibroblast cell is visualized through the immunofluorescence staining under the microscope as - Zeiss AxioVert 40 CFL microscope, using Zeiss AxioCAM MRm digital camera as well as AxioVision software (Carl Zeiss AG) [28] the cytoskeleton networks are colored as blue for actin, green for intermediate filaments (vimentin) and red for microtubules.
Functionally, the cytoskeleton helps to maintain the cell shape, and also crucial in the movement of cellular components, segregation of chromosomes during mitosis and also in the development of a sensing network for mechanotransduction. The eukaryotic cytoskeleton is made up of three basic types of filaments, along with their associated proteins. Cytoskeleton filaments are interconnected with each other, and their functions are coordinated by hundreds of associated cytoskeleton accessory proteins [29]
The functions of the various components of the cytoskeleton classically can be schematized as follows:
• Microtubules are the third type of the cytoskeleton filaments, which is produced from the tubulin into a hollow cylinder with an outer diameter of roughly 25µm and is, therefore, a far higher bending stiffness than that of either actin or intermediate filaments [30]. The persistence length is so far more, about 6mm [30,31]. Along with the high bending stiffness and the rod-like appearance, they are also useful in supporting the creation of the long slender structure. Microtubules are often found in an arrangement in which
they radiate from the center of the cell [2]. They are very highly dynamic, allowing for the remodeling and adaptation of the cell structure [30].
Microtubules are liable to vesicular traffic and mostly to the movements of all diaphragm organelles; form the meiotic and mitotic cell melt, as well as the "midbodies" characteristic of the late phases of cell division; Also represent the structural and functional support of membrane expansions with movement such as cilia and flagella. Microtubules are assembled into hollow tubes to both sides of protofilaments [32]. The term tubulin is a microtubule subunit, which is called as an α/β heterodimer [33].
• Intermediate filament [34] are responsible for maintaining the cellular form in coherence with the differentiated state of the cell, as well as maintaining the shape and position of the nucleus [35,36].; They are also involved in the development of intercellular junctions and cell junctions and the extracellular matrix, thus providing the important chemical and physical information about the microenvironment in which they are immersed. The different kinds of Intermediate filaments share a similar type of basic characteristics and provide tensile strength of the cell [37]. Intermediate filaments are the family of various protein of which the expression is depending upon the type of the cell, and its functions such as endothelial cells express different types of keratin and vimentin is outstanding into the mesenchymal cells such as fibroblasts [38]. Furthermore, IFs are more resistant to high salt concentrations and much more stable than the actin filament or microtubules [30,39]. Generally, cancer cells have been observed to exhibit a disrupted intermediate filament network, which is collapsed around the nucleus along with the different mechanical properties.
• Microfilaments are located at the cortical cell cytoplasm level and are involved both in the creation of joining cellular structures and in cell migration as they are responsible for the formation of membrane expansions (filopods and lamellipods) necessary for the cell
movement; microfilaments also mechanically support real-world expansion such as microvilli that have absorbing or exchange function with the outside environment but which can function as "mechanical sensors" when exposed to fluids; finally, this type of cytoskeleton is involved in the plasma membrane deformation processes associated with the formation of endocytosis and exocytosis vesicles and the formation of cytoplasmic bridges [40,41].
While the previous scheme suggests a clear separation of functions between the various cytoskeletal components, it is good to keep in mind that the dynamic modification of the structure of one of the types of filaments of the cytoskeleton necessarily leads to a modification, albeit partial, of the set of other components: we can say that elements of the cytoskeleton act as an integrated system. For example, during mitosis, the shape of the cell changes radically, though the mitotic fusing is substantially formed by microtubules, while the cellular division also observes the change in the tonal filament and microfilament concept. The same considerations can be extended to cellular motion: although we know classically that filopods and lamellipods are related to changes in the actinic cytoskeleton, we cannot generate cell migration without profoundly altering its adhesive shape and shape, thus involving all cytoskeletal components in this event. Even vesicular traffic is an exemplary example of the integrated action of the cytoskeleton: the vesicles are transported on "tracks" of microtubules, but fusion with the outer membrane or with the internal membrane compartments also depends on the arrangement of the other cytoskeleton components. Finally, it is now known that elements of the cytoskeleton are involved in "signal transduction" within the cell, and therefore contribute substantially to modifying not only adhesive/migratory but also metabolic/functional behaviour. Signal transduction was initially studied regarding the stimulation of hormone cells or growth factors. However, it is now clear that cytoskeletal elements actively participate in this function and can activate it autonomously
in response to signals from the "mechanical" variation of the micro-environment.
It is clear that in order to study the structure of this three-dimensional network of protein filaments, it is necessary to evaluate "in situ" the use of protocols to maintain the structural integrity of the cell. This was possible thanks to the acquisition of cellular fixation techniques, which are the basis of most optical and electronic microscopy techniques. These techniques include the use of substances (in most cases, alcohols or aldehydes) that allow the structure of the molecules that make up the cells to be maintained, in conditions as representative as possible of what is happening in vivo.
1.3 Measurable parameters of cytoskeleton system
Image analysis approaches were used to measure a cytokeratin filament network visualized by immunofluorescence and confocal microscopy. There are two methods as follows that are used to segment sets of curvilinear objects.
1. Mesh approach – This approach is based upon the classical methods of the mathematical morphology, takes into consideration of global network topology.
2. Filament approach (novel) – This approach is based upon the individual element morphology.
Both methods, as well as their combination, will allow the calculation of several features at two levels of geometry: Global (network topology) and Local (filament morphology) [42].
Topology: It is known as the study of geometrical properties as well
as the spatial relations which are unaffected through a continuous change of shape or the size of the figures. Generally, the physical layout of the network is called topology [43].
Network Topology: The collection of all the network elements
can’t be itself constitute a network, however, there must be something equally real to make it function as a the whole. The way
in which the elements are “wired together” must also be specified in some rigorous manner. This pattern of the connections is called the network’s topology.
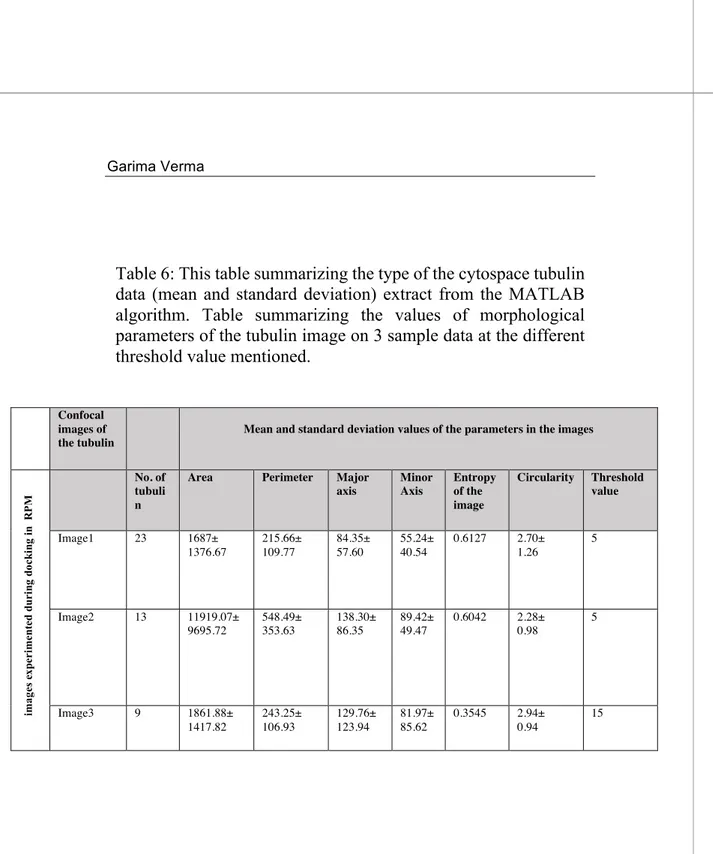
Table 1: The table representing the parameters to describe the topology and morphology of the Cytoskeleton [42]
Global parameters (Network Topology)
Local parameters (Filament Topology)
Network (degree) connectivity, - Number of connection points
(Ncp).
- Connecting index (Ic).
Filament (s) morphology, Filament shape, Polarity
Network density,
- Total length of detected filaments (Lf),
- Number of regions (Nr).
Length
The mesh structure, - Areas of regions (Ar), - Mean length of filaments,
enclosing a region (Lr), - Mean elongation factor (Ef).
Thickness, mean length of filaments enclosing a region (2x Lf/Nr)
1.4 Quantitative methods to measure cytoskeleton parameters
The possible survey methods for analyzing the structures so far described are based upon various microscopy technologies, each featuring specific strengths. In particular, we can highlight optical microscopy, confocal, and electronic microscopy.
1.4.1 Optical Microscopy
Optical microscopy [44] is a technique of observation capable of producing magnified images of objects or details of them, too small to be observed with a naked eye; The instrument used to perform
this technique takes the name of an optical microscope. The simple microscope is a converging lens between the eye and the object to be observed so that the latter is in the intermediate position between the focal plane and the lens itself. Under such conditions, the lens provides a straightforward and magnified virtual image of the object, even if it is at a distance from the lower eye to the next point. The maximum magnification obtainable with a single lens is 8-10 times (8x-10x).
Larger magnifications can be obtained thanks to the composite microscope, a system of two convergent lenses, respectively, lens and eyepiece. The object to be observed is placed in front of the lens that provides a real, upside-down, and enlarged image. This image is dropped at an appropriate distance in front of the eyebrow, which provides another image, virtual, magnified, and oriented in the same direction. 100x magnification is only possible with the technique of "immersion in oil bath."
In the cell culture study, optical microscopy is used at various enlargements to qualitatively and quantitatively evaluate the morphology of cells and their displacement, as it appears on the focus plane. Small magnifications are initially used to test cell culture, count, cluster, or aggregation display for the "broad-spectrum" statistical significance of the under-investigation phenomenon. As the magnification and resolution power increases, it focuses on the specific regions of interest (ROI) that the researcher feels useful to visualize the expected effects due to a specific treatment of the biological sample as compared to the controlled, untreated sample. The overall, qualitative and sometimes quantitative evaluations are closely linked to the researcher's ability and experience.
1.4.2 Immunofluorescence microscopy
Immunofluorescence microscopy [45] is generally used to define the cellular distribution of both the soluble and structural proteins. It is an essential technique for the determination of the distribution of the proteins within the cells. It is also useful to extract the information
on the location and function of proteins that are not well understood. One of the major application of immunofluorescence microscopy is the fixation conditions beneficial to prepare the cells for the antibody which truly preserves the in vivo distribution of the antigen of interest [46] Another application of the immunofluorescence microscopy is to visualize subcellular localization of proteins in the coat morphogenesis and chromosome as in packing throughout the development of sporulation in Bacillus subtilis [47].
1.4.3 Confocal Microscopy
The contemporary evolution of optical fluorescence microscopy and molecular biology has allowed to develop immuno-marking techniques which, preceded by fixation protocols, allow "in situ" observation of the distribution of molecules within the cells. Specifically, these experimental protocols provide for the use of specific antibodies that identify molecules of interest within the cells, even when they are part of cellular structures whose dimensions are below the optical microscope resolution power. A detailed study of the cytoskeleton plan would allow us to have not only information about the cell structure but also about the functional activities the cell itself is carrying out. A significant boost to the study of "in situ" cellular biology has been possible thanks to the development of confocal microscopy [48]: a system that uses a microscope capable of gathering information at various depth levels and giving a three-dimensional reconstruction of the analyzed fluorescent tracer. However, this technology is not used in laboratory practice to the utmost of its potential. Indeed, there is always a compromise between the detail that can be obtained for a reconstruction that involves the acquisition of a great number of sequential images and the time required for such acquisition and processing. These studies allow to perform morphological evaluations on a very small sample and on interpretative bases that may be partly subjective and may change from experimenter to experimenter. Hence a quantitative and qualitative analysis of the entire cell population is virtually never carried out, losing valuable
information that could give us new perspectives for cellular behavioral knowledge. Hence, it is necessary to develop new innovative technologies to optimize the use of the various microscopes and analyze simultaneously the information derived from a large number of different images and possibly to link the observations made using the different types of microscopy.
The Confocal Laser Scanning Microscopy (CLSM) is an optical microscopic technique that was applied to generate high resolution two dimensional and three-dimensional images, projections as well as three dimensional of autofluorescent objects. The application is widely distributed and related in such disciplines like petroleum geology, marine geology, archaeology, cell biology, etc. [49]. CLSM has low-cost computer data processing and imaging system with the availability of laser light sources. It is popular in the field of life sciences and semiconductor device technology. CLSM is also useful in characterizing the amorphous structure and also identify the gas-solid coexistence in deionized suspensions [50].
The figure 4 showing the principle for confocal microscopy. The CLSM using the fluorescence mode can collect the emissions originating from the interior of a biological sample, and hence CLSM has been extensively used to map intracellular mechanisms. When antibodies were used to stain the specific biological structures, fluorescent confocal microscopy provides a powerful way to simultaneously map the distribution of the different cellular components. The cells here were imaged using a confocal (Leica DMIR2) microscope.
Figure 4: The figure presents the principle of confocal microscopy.
1.4.4 Electronic microscopy
Electronic microscopy [51] was certainly the first technology to give structural knowledge about the existence of the cytoskeleton since cytoskeletal filaments all have a caliber less than the resolution power of a conventional optical microscope (0.2 microns). In particular, if electronic scanning microscopy (SEM) has provided very detailed information on cell surface characteristics (filopods, lamellips, cilia, flagellas, microvilli, etc.), electronic transmission microscopy (TEM) due to its extraordinary resolution power (0.2 nm) allowed for the first observation of cytoskeleton elements. If the cytoskeletal morphological/ultrastructural study was possible thanks to electronic microscopy, knowledge about the nature of the structural proteins of the cytoskeleton was possible thanks to molecular biology. Conventional molecular biology techniques, however, require the lysis of the cells that they want to study and, therefore, the loss of structural integrity of the same, so having a "proteomic" analysis of a cell population prevents, by chance, the possibility of simultaneously perform morphological observations on the same cell population.
TEM is a principal technology in the field of cell biology to make several contributions for over 50 years. TEM is valuable in the analysis of the cellular components, for example, cytoskeleton, membrane systems, organelles, cilia, and flagella, as well as several specialized structures in differentiated cells, for example, microvilli and synaptonemal complex [52]. TEM is also useful in the study of viral and bacterial infections and understanding their knowledge [53]. TEM was used to visualize nanocrystals (NCs), which is able to find in the crystallization drops [54].
1.4.5 Atomic Force Microscopy
Atomic Force Microscopy (AFM) [55] is a greatly involving technique for the exploration of the biological systems at the nanoscale. Biological samples can be viewed with AFM in two of the imaging modes: first is contact mode, and the second is tapping mode. AFM has been used for a long time in many scientific fields because of the study of the surface structure at nanometer to sub-angstrong resolution in an ambient and liquid environment. The application of AFM has a unique place in pharmaceutical research. Also, AFM has several advantages over SEM/TEM for the characterization of nanostructures. It also presents three-dimensional data so that it is possible to measure the height of the nanoparticles quantitatively. One of the characteristics of AFM is that it is a very cost-effective microscope for nanoscale imaging [56].
TABLE 2:
S.No. Visualization Techniques Major contributions Advantage References 1. Atomic force microscopy (AFM) It is used in material science and widely used applications in biological sciences. Used to probing the extracellular matrices and the mechanical properties of the cell including receptor-ligand interactions. [57] 2. Transmission Electron Microscope (TEM) It is used to study the biological structures and to understand how the images formed. Used to study the minute structures by taking the electron micrographs of thin sections. [58–60] 3. Immunofluorescence microscopy. It is used in modern biology and medicine developed by Coons et al in 1950. Used to develop the tissues and analyze the distribution of proteins and small biological and non-biological molecules. [61–63]
4. Confocal Laser scanning microscopy It is used to produce blur-free images of thick specimens at various depths Images are taken point by point and reconstructed with a computer, rather than projected through an eyepiece. [64,65]
1.5 Tools to analyze Cytoskeleton morphology
1.5.1 Cell profiler to quantify and identify the cells parameters Cell profiler is designed for biologists. It is used for the quantitative analysis of biological images. It is free and open-source software for the study of cellular functions. It is a flexible software tool and measures the cell size, shape, intensity and texture. Cell profiler can be downloaded from the website http://www.cellprofiler.org. It runs on various platforms Windows, Mac, and Unix. Cell profiler is a freely available image analysis software that can able to handle hundreds of thousands of images. In cell profiler, the analysis takes place the concept of a pipeline of individual modules for the image analysis. Each module works in a sequential order to construct a pipeline. Many modules are automatic, but the software adjusts each module appropriately [66].
1.5.2 Image J – the technical advance tool
Rasband develops image J software. It is one of the main scientific image analysis programs. To facilitate more advanced and precise results, the program provides plugins, which is necessary to add functionality and diverse visualization. This program is having large
bio formats used in over 30, 000 laboratories. In this way, image J is a very popular research tool helpful in imaging processing and can run in any web browser [67].
Moreover, both NIH image and image J used to keep the program very simple with no complex user interface. When we open image J, the single toolbar appears, and from this straightforward interface, all of the proficiencies of the Image J can be found and used. There are over 500 plugins that consist of a wide range of functions accessible on the Image J website. Most of the plugins are now distributed along with the core of the Image J [67].
Image J is called an image analysis program that is widely used in the biological sciences and beyond it. Owing to its ease of use, recordable macros, and extensible plug-in architecture, image J appreciates contributions from non-programmers, unprofessional programmers, and professional developers alike. Image J is a very powerful platform for image processing, which is developed by Wayne Rasband at the National Institute of Health (NIH). Since when its initial release in 1997, it has proven the paramount in many of the scientific endeavors and projects, and particularly those which come inside the life sciences. There are so many existing extensions – plugins, macros, and scripts for the image j application, which have proven very useful to the user community [68].
Interestingly, image J software is an open software platform that had a significant impact on the life of sciences and continues to do. Image J is growing significantly because of freely available and its lively and helpful user community. There are several scientists, interested biologists, technical assistants, students, and scientific staff who use Image J on a daily basis, and can exchange knowledge through a dedicated mailing list. The uses of image J is ranging from data visualization and teaching to the advanced image processing as well as statistical analysis. From the technical point of view, image J provides a very useful interface along with the function to load, display and save images, the basic image processing functionality like- convolution filters and extension mechanism which includes support for macros and plugins [69].
1.5.3 ICY TOOL
Icy is an open community platform software for bioimage informatics. It offers the software resources to quantify, visualize, and annotate the bioimaging data. Icy comprises a flexible framework that is designed around a plugin architecture; it also offers rich data structure for the biological images and output data, enhanced data visualization. Icy is open-source software that can address several issues by providing a comprehensive framework for the extensive reproducible research in two bioimage informatics. Moreover, the icy internal structure has a core layer that provides core functionality a plug-in layer which can implement the application-oriented modules and a plug-in management engine that can ensure plug-in interoperability. Plugin development takes advantage of a rich application programming interface (API) that can facilitate the development of the specific algorithms, augmented visualization tools, a database that can access and other software components. This software uses the Bio format library to read more than 100 different file types. Also, icy uses the internal data format and offers over 80 different functions for plug-in to access the image data. Icy is bundled with a set of bioimage informatics tools, which is released on April 2011, having more than 100 plug-ins published online [70].
1.5.4 MATLAB
MATLAB is a fourth-generation high-level programming language developed by Mathworks. MATLAB allows many functions like matrix manipulations, plotting of function of the data, implementation of the algorithms, creating the user interfaces, interfacing the programs written in the other languages such as C, C++, Java and FORTRAN. MATLAB provides an interactive environment for the iterative exploration, designing and problem-solving, In addition, it also provides the built-in tools for the visualization of the data and tools for creating custom plots.
MATLAB nowadays is very much used as a computational tool in the field of science and engineering as well as physics, chemistry, math field [71].
Moreover, MATLAB is a high- performance language used for technical computing. However, it integrates for the computation, visualization, and programming environment. Although it is a modern programming language environment that comprises sophisticated data structures, consists of built-in editing and debugging tools, it also supports object-oriented programming. Hence, these factors make the MATLAB an outstanding tool for research and teaching. MATLAB consists of many advantages as compared to conventional computer languages like C, Fortran to solve the technical problems. Interestingly, this software package has been commercially available since the past from 1984 and which is now been considered as a standard tool in most of the universities and industries worldwide. MATLAB is also known for as powerful built-in routines, which enable a very wide variety of computations. MATLAB consists of its specific applications collected in packages, which are called the toolboxes. There are several toolboxes such as signal processing, control theory, optimization, simulation, symbolic computation and other fields of engineering and applied sciences [72]. MATLAB is available on UNIX, PC, and MAC platform. We can get Matlab by double-clicking on the Matlab icon or by typing Matlab on Unix on the command line. We can also get access to the MATLAB command line, which is denoted by “>>”.
1.6 Image analysis
Image analysis is a very critical phase in most of the medical and biological applications and automated image analysis has become the central tool for such applications in recent times. A number of the commercial high content cellular imaging systems include software (Imaris – 3D/4D image visualization and analysis software, Solis software, Metamorph and Infinity can be used to characterize neuronal projections such as axon and dendrites[73]. In image analysis, one of the most crucial step is image segmentation [74].
Segmentation subdivides an image into its components. It also differentiates the object of interest from the background. Moreover, global thresholding or thresholding is an essential and quick method for characterizing the image region which has the same grey value [74].
1.7 Filopodyan – image analysis open-source software
Filopodyan or Filopodia Dynamics Analysis is a program developed in R and Fiji [75]. It is an image analysis open-source software used for automated segmentation and filopodia analysis which quickly annotates the huge number of dynamic filopodia. Furthermore, it also used to measure the filopodia fluorescence along with the full generation and automation of the large dataset of the fluorescence intensity at the sites of membrane proximal while formation and at the tip.
Filopodia are the thin membrane protrusion which acts as an antenna for the cell to probe the surrounding environment. Moreover, filopodia are commonly found embedded within or protruding from the lamellipodia at the free front of the migratory tissue sheets. Filopodia have a very important mechanical and sensory role in the movable cells.
Filopodyan performs great on high-magnification, high-quality images in the cell types along with the clearly differentiated filopodia, in 2D time series. Filopodyan is used for detecting the neurites as well as the filopodia [75].
1.8 Neuron J – image J plugin
The neurite tracing method is fully manual delineation and was tested with four users who repetitively traced the chosen neuronal processes in 20 fluorescence microscopy images of the cells inside the culture. By analogy with the Image J, the authors called the tool ‘Neuron J’. It provides functions to label and tracing, to load and store the tracings, to calculate and display the dimension of each and every tracing and perform statistics on the measurement of all the particular tracings[76].
Chapter 2
2.1 AimsOur first aim is to build an integrated framework for the quantitative assessment of cytoskeleton (CSK) morphology. That task implies that we should represent an in-silico model constructed by using measurable parameters obtained from cells imaging. This process is likely a translation from a ‘biological phenotype’ to an ‘electronic phenotype’. First of all, the quality of images provided by currently available technologies (confocal, optical and electronic microscopy) must be optimized in order to allow a reliable extraction of useful data. Currently, quantitative morphological appraisal of cells is usually restricted to only a few parameters (surface area, diameter), thus leading to a ‘reductionistic’ approach in grasping the morphological configuration. This approach is mainly disappointing when we are facing non-Euclidean structures – like ‘natural’ objects – that should be more realistically represent by fractal-based geometry. Therefore, we adopt a Systems Biology approach aimed at grasping the whole configuration of the living cell. This innovative model requires a great deal of integrated measures in order to identify the ‘observables’ (dependent as well as independent) that can exhaustively describe the dynamics of the system. By considering the cytoskeleton as the main driver of the cell shape, we assume to posit a correlation among CSK structure and cell shape parameters. Thus, we identified the following parameters describing CSK architecture: length, density, thickness, branching and hubs. Cell shape parameters belong to the following: roundness, solidity, fractal dimension, lacunarity, surface area, aspect ratio. Overall, those measures will be integrated in order to grasp the complexity of the cell morphology. To do that the cell morphology will be quantitatively assessed by means of fractal analysis, while CSK architecture will be evaluated by means of
coherency analysis. Coherency, indeed, has been proven to greatly differ from different cell phenotypes and it is currently deemed reliable parameters in following cell phenotypic transitions. These parameters will be included in an integrated and comprehensive in silico model for which specific protocols and algorithms will be defined. The in silico model will be used experimentally to measure the changes that occur in cell morphology after exposure to a specific treatment.
My second aim is to apply bioinformatic approach to evaluate in quantitative manner data from some experiment leaded by lab research team. I receive data about two experiments, cytospace experiments and the experiment of the breast microcalcification. In the last year of the PhD I receive data of the neurite.
From the various surveys of the literature, we have noticed that the earth’s gravity is one of the major factors limiting of the cell size. It also influences the diversity of the cell types and size throughout in the biological evolution. In one of the literature [77]. Pavel E. Morez ask the question that what is the role of gravity in the life of the cell? Cells have evolved in the earth's field of gravity and it is very interesting to study how gravity affects the cells on their size, variety, division rate and so on. With the beginning of the space travel in the recent years which is connected with the weightless environments, it is very essential to know more about the effects of both the reduced as well as the increased (more than 1g) gravity on the development and growth of the cellular and multicellular systems [77].
The third aim is to develop the image analysis algorithms through Matlab to describe the cytoskeleton network. The quantitative analysis of the microtubules and nuclei pattern was performed by using various images – analysis methods. Indeed, the aim is to identify the modifications in the CSK network.
Moreover, in our experiment, we have preliminary combined confocal and optical microscopy image analysis to improve the quantitative analysis of cytoskeleton architecture of the breast cancer cell line (MCF – 7).
The fourth aim is that the neurite numbers and length measurement of PC 12 cells were analyzed using the following software tools : (a) custom made tool MATLAB (b) Cell profiler (c) manual workflow in image analysis and (d) Filopodyan. We have shown some algorithms which are useful for analyzing the changes in the neurite and length. A comparison of the different software and tools suggests identifying the length of neurites can be achieved using image analysis.
Chapter 3
3. ResultsIn this chapter, we present the results achieved with our framework on the given dataset. We have worked upon the dataset of the cytospace experiments and neurites.
The complete analysis is taking place into 2 parts: analysis by image J and analysis by MATLAB. In the third part of the thesis, the neurite analysis takes place.
We now begin the analysis of the dataset with the flow of pipeline in the framework and showing how the results produced by image J.
3.1 A confocal – based quantitative analysis in the cytoskeleton architecture of MCF -7 Cells:
MCF – 7 is a breast cancer cell line derived from pleural effusion in 1970. The cell line is displaying 85 chromosomes. These cells tend to grow the colonies. MCF – 7 cells are capable of forming tumors in nude mice. These cell lines can easily grow in soft agar and having low to moderate activity. Hence, MCF – 7 cells have a low invasive capability in vitro.
A great variety of cellular alterations has been observed during the microgravity in the MCF – 7 cells.
The result section is divided into three parts – in the first part the cytoskeleton is analyzed by IMAGE J and in the second part, the cytoskeleton data is analyzed by MATLAB programming. The results are differentiating from one another. And in third part, the neurites data is analyzed by different tools and softwares.
3.2 Application of bioinformatics to analyse confocal image:
To explore the CSK morphology I received a prelimary data set from cytospace experiment.
A total of three experimental conditions were approached to participate in the cells, one subjected to Treated and Untreated with melatonin on ground; another subjected to treated and untreated with melatonin in space, and cells in space without melatonin at docking time. To build an integrated framework from the cytoskeleton image series we followed a step-by-step procedure: we split the color channels of the cytoskeleton confocal images to separates microtubules and nuclei. From the image J, we refine and adjust the threshold by the top and bottom slider. We calculate the threshold of each confocal image. Thus, projecting and applying the measurement properties to analyze the area, shape, descriptors, perimeter, mean, median, standard deviation. This results in a description of significant changes of each cytoskeleton nuclei at different conditions on the ground as well as in space and docking. The steps will be repeated for all the images of the nuclei and microtubules separately.
We identify the following parameters describing CSK architecture: length, density, thickness of microtubules. Descriptive nuclei shape parameters that belong to the following: roundness, solidity, fractal dimension, lacunarity, surface area, aspect ratio. Thus, to define the given parameters which are significantly higher or lower than predictable by chance, analyses were performed within all cytoskeleton structure. Differences were detected for ground, space, or docking nuclei experimental conditions.
3.3 Pilot Study for cytoskeleton analysis
We apply computational analysis to measure CSK morphology variation among the controls, docking, and space experimental conditions.
The objective of this study phase is not to investigate the real effect of microgravity on cells, but to develop a calculation model that takes into account all the parameters of interest. On the other hand, the images received are only a small set of images relating to the
experiment, representative from a point of view of image analysis but not sufficient to be able to formulate any scientific hypothesis on the possible biological meaning.
Here, I have put the formula to calculate each parameter.
For area of the cytoskeleton as: area of total number nuclei/area of total number microtubules.
Area of cytoskeleton (A1) = a1/a2
A1 = Area of the nuclei/Area of the microtubule This formula is applied to calculate each parameter
For the roundness of the cytoskeleton as: roundness of nuclei/roundness of microtubules.
Roundness of cytoskeleton (R1) = r1/r2
R1 = roundness of the total number of nuclei/roundness of total number of microtubules
And so on for other parameters as well…
3.3.1 Formula for the measurement of the cytoskeleton
• Area: The selected area was measured and calculated in square pixels in calibrated square units (e.g., mm2
, µm2, etc.). Note: To measure the area of the cells the function in the image J as: analyze---set scale parameter was used to spatially calibrate the image.
• Roundness: With this parameter, we have calculated the roundness of the nuclei, which gives the value directly relative to the aspect ratio and circularity.
4*[area]/∏*[Majoraxis]2
• Perimeter: The measured length of the outside boundary of the selection.
• Circularity: It was well defined as the ratio of the area and perimeter with the value 1.0, which is, signify the perfect circle. As the value is reached to 0.0, it shows an increased elongated shape. All the values might not be valid for the few particles.
4π*[area]/ [perimeter]2
• Solidity: Through this parameter, we are measuring the convex area selected by the specific command.
Solidity: [Area]/[Convex area]2
• Aspect ratio: In this parameter, the aspect ratio of the particle fitted in the ellipse.
AR = [Major axis]/ [Minor axis]
In this, the fitted ellipse is selected as the major and minor axis which are observed in the nuclei.
3.3.2 MCF -7 Cytoskeleton results calculated by Image J Software:
Figure 5: The Confocal microscopy analysis of the MCF -7 cytoskeleton structure. Qualitative analysis of MCF-7 cells: All bars representing the mean and standard
deviation. Mean and standard deviation are shown for each experimental group. (A) The cytoskeleton area (area of total number of nuclei/area of total number of microtubules) was calculated by Image J. (B) The cytoskeleton roundness (roundness of total number of nuclei/roundness of total number of microtubules) was calculated by Image J. (C) The cytoskeleton perimeter (perimeter of total number of nuclei/perimeter of total number of microtubules) was calculated by Image J. (D) The cytoskeleton circularity (circularity of total number of nuclei/circularity of total number of microtubules) was calculated by Image J. (E) The cytoskeleton solidity (solidity of total number of nuclei/solidity of total number of microtubules) was calculated by Image J. (F) The cytoskeleton aspect ratio (aspect ratio of total number of nuclei/aspect ratio of total number of microtubules) was calculated by Image J.
3.3.3 Discussion:
Our analysis providing the new horizons into the diversity of cell morphology and suggest the different experimental approaches for future study. Besides, coherency is being defined through the structure tensor, which evaluates the local orientation in a small region of a confocal image.
In figure 5 (A) showing the area of the cytoskeleton in different experimental conditions i.e., on the ground, in space and during docking with mean and standard deviation. Figure 5 Image (B) showing the roundness of cytoskeleton including nuclei and microtubules in three different experimental conditions. Image (C) showing the perimeter of the cytoskeleton in three different conditions. Image (D) showing the circularity of the cytoskeleton. Image (E) and (F) showing the solidity and aspect ratio of the cytoskeleton in all three experimental conditions which is not so much changing according to the graphical representation.
Fractal Dimensions: Fractal is a never-ending pattern. These are
infinitely complex patterns that are self-similar across different scales. However, they are used to create by repeating a simple process over and over in an ongoing feedback loop. Moreover,
simple process[78]. It is well known as a non-regular geometric shape that contains the same degree of non-regularity on all scales [79]. Fractal dimension was known to be firstly introduced by Mandelbrot. Fractal dimension usually describes the shape and appearance of an object, which consists of the property of self-similarity. The fractal dimension of many objects is usually calculated by using the concept of self-similiarity[80].
The fractal dimension (FD) is a real number which is used to define the geometric complexity of a fractal. One of the ways used to quantify FD is the box-counting method. It is used to covering of the image with the non-overlapping grid which is made up of the boxes and then counting how many boxes of the grid were covering our image. After that, this method is repeated by iterating the process using the finer grid. Hence, in the end, the pattern of N(r) changes with r which will be obtained, as represented in the graph. By using a logarithmic scale, a linear regression model will be used to fit the line. The FD value is given by the slope of this line. However, the input can be a 1D segment, a 2D image, 3D volume. In particular, smaller squares will pick up more detail, which will give a better approximation of the shape (N(r) squares of the side length r). In this sense, the more irregular surface, the higher the value will be. Box counting dimension is the typically used method which is in the characterization of irregular sets of the science.
We have performed our analysis with a standard box-counting method using FracLac which is based upon the multiple origins of the ROI. With the use of the box-counting method, we have defined the largest and the smallest box sizes.
Here, C = considered curve, L= Length of the curve C, ɛ = length of the segment used as unit to calculate L.
Along with this, we have processed the images properly and calculate the linear relationship when plotting the graph log(N(s))

![Table 1: The table representing the parameters to describe the topology and morphology of the Cytoskeleton [42]](https://thumb-eu.123doks.com/thumbv2/123dokorg/2888791.11106/23.892.103.816.65.1174/table-table-representing-parameters-topology-morphology-cytoskeleton.webp)

![Figure 7: figure (A) representing the desktop RPM which is placed in a standard incubator [85] Figure (B) representing the RPM which is made up of two motors](https://thumb-eu.123doks.com/thumbv2/123dokorg/2888791.11106/48.892.119.753.69.1142/figure-figure-representing-desktop-standard-incubator-figure-representing.webp)