1
Facoltà di Scienze Matematiche Fisiche e Naturali
DOTTORATO DI RICERCA
IN GENETICA E BIOLOGIA MOLECOLARE
XXXI Ciclo
(A.A. 2017/2018)
Elucidating Omomyc specific action in cancer:
a sensitive controller of oncogenic Myc
Dottorando
Fiorella Scagnoli
Docente guida
Dr. Sergio Nasi
Coordinatore
Prof. Fulvio Cruciani
2
INDEX
GLOSSARY
SUMMARY
INTRODUCTION
1. Myc
1.1 Structure of c-Myc1.2 The Myc/Max/Mad network: a matter of balance in the cellular milieu
1.3 Biological activities of Myc
1.4 Myc and cancer
2. Myc transcriptional activity
2.1 Global versus selective: two conflicting models?
3. Omomyc
3.1 Structure of Omomyc and its interactors
3.2 Overview of Omomyc action in cancer
4. Experimental models
3
4.2 Burkitt’s lymphoma (BL)
AIM OF THE RESEARCH
5. Results
5.1 Omomyc suppresses tumorigenic features of glioblastoma stem-like cells and Burkitt’s lymphoma cells
5.2 Impact of Omomyc expression on Myc genome occupancy
5.3 Impact of Omomyc on GSCs transcriptome
5.4 Omomyc minimally – or not at all - influences the global RNAPII binding at promoters and affects transcription only in a subset of target genes
5.5 Myc strengthens the regulatory nodes of glioblastoma gene expression networks
5.6 Omomyc decreases the expression of a gene set specifically bound by Myc
5.7 Myc promotes the symmetrical di-methylation of Arginine 1810 (R1810) residue of RNAPII
5.8 Myc-dependent R1810 symmetrical di-methylation requires PRMT5 catalytic activity
4
5.9 Myc and Omomyc modulate RNAPII carbossi-terminal domain (CTD) phosphorylation on Serine 2 (Ser2)
5.10 Relationship between Omomyc expression, changes in RNA Polymerase II distribution at transcriptional start and termination sites (TSS and TTS), and changes in gene expression
5.11 Discussion
MATERIALS AND METHODS
REFERENCES
5
GLOSSARY
FO Flag-Omomyc
DOX Doxycycline
GSC Glioblastoma Cancer Stem Cell GFP Green Fluorescent Protein
TRE Tetracycline Responsive Element
SOX2 SRY-box 2
CCND1 Cyclin D1
PTEN Phosphatase And Tensin Homolog
NCL Nucleolin
ODC Ornithine decarboxylase HDAC Histone deacetylase
DUSP10 Dual-specificity phosphatase
OLIG2 Oligodendrocyte transcription factor 2
KDM1A Lysine Demethylase 1A
RCOR2 REST Corepressor 2
TF Transcription Factor
ChIP-seq Chromatin Immunoprecipitation sequencing qChIP quantitative Chromatin Immunoprecipitation E-boxes Enhancer boxes
PI Propidium Iodide
FITC Fluorescein isothiocyanate TSS Transcriptional Start Site
TTS Transcriptional Termination Site
FPKM Fragments Per Kilobase of gene Million mapped reads
RPKM Reads Per Kilobase of gene per Million mapped reads
GSEA Gene Set Enrichment Analysis MsigDB Molecular signature database
GO Gene Ontology
6
PRMT5 Protein Arginine Methyl Transferase 5
GBM Glioblastoma
7 SUMMARY
The involvement of Myc in a wide range of molecular functions makes it, probably, the most studied transcription factor for 30 years. Myc deregulation is common in at least 70% of human tumors and gives rise to a wide variety of oncogenic phenotypes, including breast, lung, cervical, ovarian and brain cancer. Therefore, our primary interest was to interfere with Myc function in Glioblastoma Stem Cells (GSCs) and Burkitt’s lymphoma cells, using a small peptide, named Omomyc. It is a Myc-bHLH mutant with outstanding capabilities to inhibit several types of human cancers. Omomyc displayed a significant impact on tumoral behavior in both model systems. This occurs because Omomyc replaces Myc at promoters and disrupts Myc protein network (Savino et al., 2011), affecting the expression of all those key genes - Myc target and not - directly involved in tumorigenesis. Furthermore, we found that Myc and Omomyc interact with the Protein Arginine Methyltransferase 5 (PRMT5) (Mongiardi et al. 2015), which catalyses the symmetrical di-methylation of RNA polymerase II (RNAPII) at R1810, allowing proper termination and splicing of transcripts (Zhao et al., 2016). Myc regulates many aspects of transcription by RNAPII, as activation, pause release and elongation, but its role in termination is unknown. We found that Myc overexpression strongly increases symmetrical RNAPII arginine di-methylation (R1810me2s), while the concomitant expression of Omomyc counteracts this capacity. In addition, Omomyc expression modulates the RNAPII amount at Termination Transcription sites (TTSs) versus Transcription Start Sites (TSSs) in several genes. Altogether, these findings suggest that Myc modulates transcription termination through R1810me2s-RNAPII. Therefore, Myc overexpression may deregulate this process by influencing RNAP II arginine di-methylation levels, contributing to tumorigenesis. In this regard, Omomyc may fine-tune the expression of a variety of genes altered by Myc in cancer, affecting the PRMT5/Myc/RNAPII-R1810me2s axis.
8
Introduction
1. Myc
1.1 Structure of c-Myc. myc is a family of three related gene
products (c-Myc, n-Myc, and l-Myc; in this thesis, Myc will refer
to c-Myc). The myc gene was first identified as the transforming
agent within chicken retroviruses (Sheiness et al., 1978). In the human genome, c-myc localizes to human chromosome 8q24, it contains three exons which encode a translation product of 439 amino acids with a molecular weight of 64-kDa. The sequence of the Myc protein consists of two independent, functional and highly conserved polypeptide regions: a N-terminal transactivating domain and a C-terminal DNA binding segment. The transcriptional activation domain (TAD) contains two conserved regions known as Myc boxes (MBI and MBII). MBI box is involved in transcriptional activation in some context. In particular, MBI is the first contact point with P-TEFb, a cyclin CDK-complex that phosphorylates RNA polymerase II (RNAPII), stimulating transcriptional elongation (Rahl et al., 2010). MBII is essential for Myc ability to promote cellular transformation, to drive tumorigenesis, to activate and repress transcription of the majority of Myc targets; it also regulates Myc protein turnover. Further, Myc architecture has a middle region rich in proline, glutamic acid, serine and threonine residues (PEST), followed by two other conserved boxes (MBIII and MBIV), and a nuclear localization sequence. Myc MBIII box is involved in transcriptional repression by recruitment of histone deacetylase 3 (HDAC3), while MBIV seems to be required for the pro-apoptotic Myc function. Finally, a 100-amino-acid carboxyterminal region contains the basic helix-loop-helix-leucine zipper (bHLH-LZ) domain which mediates the heterodimerization with a small bHLH-LZ protein named Max (Fig. 1). This interaction is absolutely necessary to form a stable Myc-Max heterodimer able to contact directly specific DNA sequences called “Enhancer boxes” (E-boxes) to stimulate
9
transcription. Indeed, full-length Myc alone is unable to bind DNA (Grandori et al., 2000). Besides Myc-Max also Max-Max homodimers bind E-boxes (Dang et al., 1999; Nair et al., 2006; Tansey 2014). Although many functions of Myc appears to be dependent on its interaction with Max, there are considerable evidences that Myc retains some activity even without Max (Hopewell et al., 1995). Among the many identified Myc-interacting proteins, only a few exclusively bind to Myc alone. The transcription factor YY1, which usually inhibits Myc-Max activity, can also interact with Myc. Myc alone interferes with p21-PCNA interaction during DNA replication, while p21 inhibits Myc-Max transcriptional activation. Moreover, Myc was reported to associate with replication proteins and to localize to the origins of replication whereas Max was found at this level only at the sub-stoichiometric amount (Dominguez-Sola et al., 2007; Gallant and Steiger 2009). Finally, a cleaved, cytoplasmic, form of Myc, named Myc-nick, is able to trigger tumor migration and metastasis independently of its transcriptional function (Conacci-Sorrell et al., 2010, 2014).
Fig. 1 - Myc-Max heterodimer. A. The diagram depicts Myc and Max protein
structure with their major domains (modified by Dang et al., 1999). B. Crystal structure of Myc/Max bHLH regions bound to the E-box. (Tansey 2014).
10 1.2 The Myc/Max/Mad network: a matter of balance in the cellular milieu. The heterodimerization of Myc with Max plays
a fundamental role in proliferation, transformation, and apoptosis processes. Max has a short half-life but it is stable and constitutively expressed also in the absence of Myc, suggesting that Max activity is largely dependent on the abundance of Max-associated transcription factors. Max homodimers may block Myc biological activity, probably through competition for the E-box-binding sites. Other bHLH-LZ Max interactors are Mad1-4 (Mad1, Mxi1, Mad3, and Mad4), Mnt and Mga (Fig. 2). These proteins are characterized by some Myc properties: a) weak homodimerization and DNA-binding capacities; b) efficient heterodimerization with Max and consequent binding to the E-boxes; c) interference with Myc-Max activity. Specifically, Mad1, Mxi1 and related members constitute a family of transcriptional repressors at the same Myc-Max binding sites. A competition between Myc-Max and Mad-Max heterodimers determines cell decisions between proliferation/transformation and differentiation/quiescence (Eisenmann 1997). Indeed, increased expression of Mad proteins is associated with cellular differentiation and growth arrest. This occurs because Mad1-4 proteins share a repression motif that interacts with Sin3a and Sin3b corepressors, which in turn recruit HDACs and other chromatin modifying proteins to the complex. In summary, the opposite functions of Myc and Mad may be explained at three levels: competition for available Max to form heterodimers; competition between heterodimers and E-box-binding sites; transcriptional activation and repression of bound genes (Cultraro et al., 1997; Farhana et al., 2015). Interestingly, Mnt is a unique antagonist of Myc among Max protein partners. Indeed, it is constitutively expressed, and its expression overlaps with the expression of Myc (Billin et al., 1999; Grandori et al., 2000; Link et al., 2012; Yang & Hurlin, 2017). Recent studies show that Myc and Mnt compete for binding to limiting amounts of Max and, in turn, Max availability is further modulated by the turnover of Mxd protein family, whch display a short half-life, by
ubiquitin-11
mediated proteasomal degradation. Therefore, the complexity of the Myc-Max-Mad network implies a stoichiometric control of all its components. Moreover, Myc can also act as a transcriptional repressor at distinct subsets of genes impairing p300 recruitment by the transcriptional activator Miz-1 (Nair et al., 2006; Grandori et al., 2000). There are also differences in the subnuclear localization and binding affinities of Myc-Max and Mxd-Max complexes, indicating that the modulation of the levels of individual family members may have a distinct effect on network activity. Myc, for instance, is able also to upregulate the expression of MondoA and ChREBP, nutrient-sensing transcription factors, which control different facets of cellular metabolism, and their accumulation in the nucleus depends on changes in the metabolic flux. In turn, these two factors influence Myc-driven metabolic reprogramming during tumor progression (Lin et al., 2009; Kaadige et al., 2010). Furthermore, increased amount of MondoA and ChREBP sequestrates Mlx (Max dimerization protein X), increasing the competition between Myc and co-expressed Mxd proteins for Max. Therefore, an imbalance in the network may arise alterations typical of cancer cells.
12
Fig. 2 – The Myc/Max/Mad network. Schematic diagram of individual
interactions among Myc network components (double-headed arrows), (Conacci-Sorell et al., 2014).
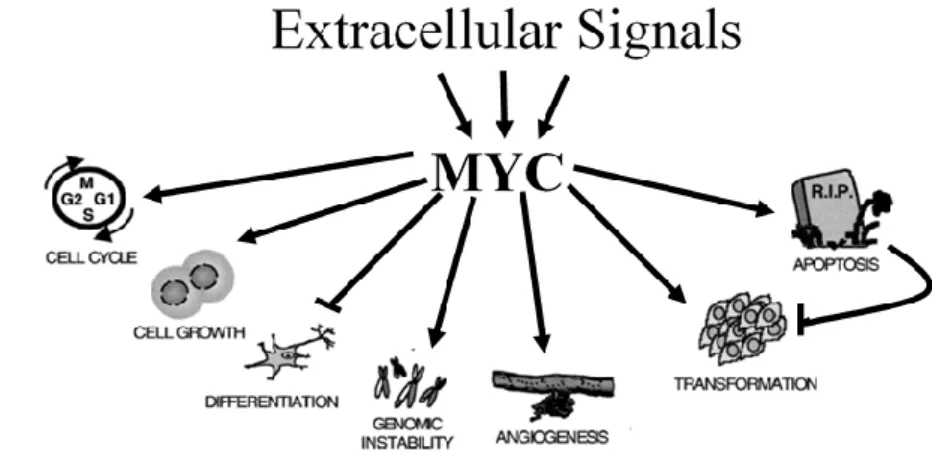
1.3 Biological activities of Myc. In normal, non-dividing cells,
Myc levels are low, while in dividing cells Myc expression is induced in a highly controlled manner and is maintained at a relatively constant, intermediate level during the cell cycle. This scenario changes when Myc expression overcomes two orders of magnitude in cancer cells. The control of Myc expression and activity starts at transcription. Myc is an intermediate early gene, rapidly induced in response to a wide range of growth factor, cytokines and mitogens, such as Wnt, Notch, Stat, receptor tyrosine kinases (RTKs), as well as hormone receptor pathways (Spencer and Groudine 1991; Morrow et al., 1992; Meyer et al., 2008; Eilers and Eisenman 2008). Regulation of Myc transcription is exerted at both the initiation and RNA polymerase (RNAP) II pause release level upon proper mitogenic stimulation (Grandori et al., 2000). eIF4E binds the Myc message early during the transcription process, avoiding free Myc mRNA escape from the nucleus, without appropriate restraints. Once in the cytoplasm, translation of the Myc mRNA is finely regulated and temporally limited by its short half-life. The Myc protein is even subjected to several post-translational modifications including phosphorylation, acetylation, glycosylation, and ubiquitylation. The rapid Ub-mediated proteolysis of Myc is crucial for keeping Myc levels low (Vervoorts et al., 2003, 2006; Chou et al., 1995). Myc is required for maintaining pluripotency and self-renewal of embryonic, neural stem cells and progenitors (Knoepfler et al., 2002) and at the same time is also required for the exit from the stem cell niche, balancing differentiation and growth of progenitor cells (Wilson et al., 2004). Indeed, the suppression of myc expression is an essential component to trigger differentiation (Johansen et al., 2001) (Fig. 3). Interestingly, Myc and other transcription factors, such as Klf4, Oct4 and Sox2, are able to convert differentiated mouse and human fibroblasts into pluripotent stem cells (iPS) by affecting
13
the epigenetic state of the target cell (Takahashi et al., 2007; Laurenti et al., 2009; Singh and Dalton 2009). Another important Myc function is the ability to induce apoptosis. Specifically, normal cells seem to be sensitive to unchecked Myc expression and activate programmed cell death in this condition. This phenomenon depends on Myc expression levels and extracellular stimuli. In normal conditions, the presence of high concentration of growth factors, in response to sustained Myc levels, pushes the cells towards proliferation; in limited growth factors conditions, cells respond undergoing apoptosis. Conversely, transformed cells frequently resist the apoptotic effects induced by deregulated Myc expression, responding only to its pro-proliferative signals (Zindy et al., 1998; Juin et al., 1999; Soucie et al., 2000; Eischen et al., 2001; Larsson and Henriksson 2010; McMahon 2014). To note, the ability of Myc to induce apoptosis in normal cells is consistent with the model in which Myc derepresses at least one level of apoptotic control, making cells more susceptible to death in only some contexts (Fig. 3). It is not clear whether Myc constitutively regulates all downstream effector pathways or whether each pathway becomes fully activated only upon the occurrence of a second stimulus. For example, both high levels of Myc expression and growth inhibitory signals are required to trigger cell death (Sears et al. 1999). For this reasons, Myc-dependent apoptosis has been referred to as a Myc latent or intrinsic tumor suppressor activity. Further, Myc is able to induce cellular senescence, a mechanism which impairs tumor development at the pre-malignant stage, under certain conditions. In general low levels of Myc were shown to induce or inhibit senescence (Zhuang et al., 2008). This apparent contradiction suggests that the role of Myc in promoting senescence is strictly dependent from overlapping pathways, cell context and, more specifically, protective factors deficiency (Vita and Henriksson 2006; Campaner et al., 2010) (Fig. 3).
14
Fig. 3 – Myc biological activity. Depending on changes of the extracellular
microenvironment Myc may affect several biological functions (Figure from Oster et al., 2001).
1.4 Myc and cancer. Deregulation of the myc protoncogene is a
catastrophic event which makes cells vulnerable to further oncogenic hits. In general, the principal hallmarks of cancer, acquired during the process of tumorigenesis, are self-sufficiency, growth signals, insensitivity to antigrowth signals, escape from apoptosis, sustained angiogenesis and tissue invasion with consequent metastasization. Myc may promote several of these capabilities simultaneously. Although myc gene alterations have initially been reported in a myeloid leukemia cell line (Dalla Favera et al., 1982b), they have also been found in colon carcinomas (Alitalo et al., 1983), in neuroblastoma, a childhood solid tumor with mycn gene amplification (N-Myc) (Khol et al., 1983), in small cell lung carcinomas (l-Myc; Neu et al., 1985). After these initial findings, several studies had confirmed that genetic alterations of myc gene family member probably underlie the etiology of all cancers. Therefore, understanding how and when cells lose the control of Myc is crucial to predict tumor outcome and to design successful therapies. The principal alterations, such as viral insertional events, chromosomal
15
translocations and gene amplification do not disrupt its protein sequence. Indeed, Myc deregulation in cancer does not depend on mutations in the coding sequence. High levels of Myc are due to the cell inability to modulate its expression in response to normal cellular and extracellular signals. Notably, aberrant Myc expression can be promoted by defects in signal-transduction pathways, which are frequently mutated in cancer, that activate or repress myc gene family expression, such as Wnt-β-catenin, Sonic hedgehog-Gli, and Notch (Vita and Henriksson 2006; Song et al., 2015; Morris and Huang 2016). Myc activation occurs also at the post-transcriptional level by increasing both Myc mRNA (Vita and Henriksson 2006) and protein stability. In particular, it has been shown that the stability of the Myc mRNA is promoted by the overexpression of the eIF4E translation factor that exports Myc mRNA from the nucleus to the cytoplasm (Oster et al., 2002; Schmidt, 2004; Matsumoto et al., 2015) while the Myc protein is stabilized by loss of critical regulators, such as the SCFFbw7 ubiquitin ligase (Yada et al., 2004; Popov et al., 2010). In this regard, it has been demonstrated that mutations of T58 or around this residue impair Myc ubiquitination and proteasome degradation in Burkitt’s lymphoma (Hoang et al., 1995; Chang et al., 2000; Cowling et al., 2014). Alternative mechanisms for the regulation of Myc stability involve the MBI and MBII conserved sequences, characterized by lysine residues which may be potentially ubiquitinated, while Myc PEST sequence has been shown to be necessary for its rapid turnover (Salghetti et al., 1999; Sears et al., 2000; Gregory and Hann 2000). When these Myc domains are mutated, the increased Myc stability contribute to tumorigenesis. Paradoxically, deregulation of Myc also triggers intrinsic tumor suppressor mechanisms including apoptosis, cellular senescence, and DNA damage responses. These anti-cancer mechanisms can be latent in tumor cells and can be activated or reactivated by molecular intervention (Lowe et al., 2004).
16
2. Myc transcriptional activity
The precise role of Myc in transcriptional regulation is still strongly debated. The predominant function of Myc-Max heterodimer is gene activation. This is consistent with Myc’s ability to recruit multiple coactivator complexes (Adhikary and Eilers 2005; Cole and Nikiforov 2006; Rahl et al., 2010, Poole and van Riggelen 2017). However, when the Myc-Max complex interacts with a zinc finger protein named Miz-1, Myc has been associated also with transcriptional repression (Wiese et al., 2013). Notably, as distinct types of cancer have different Myc expression levels (Fig. 4), the differential increase in Myc production may explain, at least in part, why different tumors acquire a specific Myc-dependent transcriptional profile (Tansey 2014). Specifically, when Myc is at physiological levels, it weakly binds to low-affinity promoters, while high-affinity promoters may be already saturated. Therefore, Myc binds better to some promoters than others altering the activity of the corresponding gene (Zheng and Levens 2016; Lorenzin et al., 2016; Allevato et al., 2017).
17
Fig. 4 - The human protein atlas of Myc. A. RNA-seq data from The Cancer
Genome Atlas (TCGA). B. The graph depicts Myc protein expression overview in different types of cancer. Protein expression level is shown for each cancer by color-coded bars. The y-axis indicates the percentage of patients. Cancer types are color-coded according to the organ of origin (https://www.proteinatlas.org/ENSG00000136997-MYC/pathology#top). Neverthless, the frequency of the E-boxes throughout the genome and the ability of Myc to bind also to sequences lacking these consensus regions makes difficult to predict specific sets of Myc-regulated genes. Indeed, genome-wide approaches have revealed that Myc has a preference for certain chromatin states, which may not contain E-boxes. Generally, Myc binds to E-boxes located proximal to CpG islands, in chromatin regions carrying active histone marks, such as histone H3 methylation at lysine residues 4 and 79 or H3 acetylation at lysine residue 27. Therefore, Myc transcriptional response may depend on the epigenetic state and on the type and history of each cell within a specific tumor (Eilers and Eisenman 2008; Zeller et al., 2006; Lin et al., 2012; Walz et al., 2014). Most of Myc-induced genes are transcribed by RNAPII. Some studies show that Myc additionally stimulates transcription of genes by RNAPIII (Gomez-Roman et al., 2003; Arabi et al., 2005; Grandori et al., 2005). Myc facilitates transcriptional elongation by stimulating the recruitment of
18
TEFb and Mediator complex and increases the levels of transcripts per cell. The Mediator complex is an essential co-activator of RNAPII involved in chromatin “looping”, which brings distant chromosomal regions closer to each other. Specifically, MBI and MBII Myc box also mediate the association of Myc with Bromodomain Containing Protein 4 (BRD4) that in turn promotes P-TEFb recruitment (Rahl et al., 2010; Rahl et., 2014; Poole and van Riggelen 2017). It has to be considered that other factors prepare the chromatin to be easily recognized by Myc-Max (the so-called chromatin “open state”) and the interactions among chromatin-modifying proteins and the basal transcriptional machinery determine the localization of Myc-Max dimers at active loci. This is allowed by a sequence of a specific hierarchy of binding events. WDR5, BPTF, and TIP60, for example, are some of these helper factors that guide Myc to the promoters of active genes (Thomas et al., 2015; Kress et al., 2015). Hence, the increase of Myc molecules amount, in tumors, may cause not only the saturation of high- and low-affinity binding promoters but also an abnormal increase of Myc co-factors recruitment in protein complexes. This may contribute to altered transcription processes with consequent aberrant gene expression typical in cancer.
2.1 Global versus selective: two conflicting models? Two
models have been proposed for Myc function: Myc is a universal
amplifier, which binds virtually to all active promoters in the
genome, stimulating gene transcription, whereas the other model suggests Myc as a gene-specific regulator (specifier).
Several studies support the idea that Myc is an amplifier because of its presence on promoters with an open chromatin structure, as well as on thousands of enhancers and intergenic sites in multiple cell types, globally enhancing transcription (Lin et al., 2012; Nie et al., 2012). As a consequence, Myc overexpression modulates the expression of genes involved in a broad range of biological functions, such as cell growth, ribosome biogenesis, protein synthesis, and metabolism (Eilers and Eisenman, 2008). In tumor cells, overexpressed Myc accumulates in the promoter regions of
19
active genes, causing transcriptional amplification in particular of proliferation-associated genes (Lin et al., 2012). Thus, while in normal cells Myc is induced by mitogenic growth factors (Dang et al., 2012; Eilers and Eisenman 2008; Meyer and Penn 2008), in tumor cells, its high expression uncouples growth-factor stimulation and cellular proliferation. Furthermore, elevated expression of Myc allows global changes in chromatin architecture (Guccione et al., 2006; Knoepler et al., 2006; Van Riggelen et al., 2010), influencing transcription. Thus, Myc amplifies the output of existing gene expression programs by directly binding all actively transcribed genes at the E-box- containing core promoter sequences. Notably, the magnitude of Myc-driven transcriptional amplification depends on the levels of Myc within the cell. In tumor cells expressing low Myc, the transcription factor is bound almost exclusively to E-boxes of most actively transcribed genes. Conversely, elevated Myc binds also to the enhancers of these active genes and at low-affinity E-box-like sequences, the so-called non-canonical E-boxes. In particular, differences in Myc occupancy determine the degree of expression of each active gene: high-affinity promoters are Myc-saturated in proliferating cells and a further growth in Myc levels only increase its occupancy at low-affinity promoters (Walz et al., 2014; Wolf et al., 2015) (Fig. 5).It has to be considered that the dose-dependent binding of Myc to chromatin may change even within a single cell population. This means that all Myc-bound sites in one cell may not necessarly correlate with those in another one (Tansey 2014). In summary, Myc is a universal amplifier because increased levels of Myc result in increased Myc binding to active genes. This behavior of Myc is consistent with the evidence that openchromatin at active promoters is important for Myc binding (Guccione et al., 2006) and that enhancer loops, in the proximity of core promoters at active genes, may facilitate binding of Myc to close enhancer elements, once Myc binding sites in core promoters are saturated.
20
Fig. 5 – Myc affinity at genome. The picture shows progressively increasing
genomic Myc binding at (A) low, (B) medium and (C) high Myc concentrations (Wolf et al., 2015).
To summarize, at high concentrations, Myc is not sequence-independent, but it is simply less selective.
This view of Myc transcriptional activity as an amplifier does not discriminate between direct and indirect Myc effects on gene expression. Myc activity modifies cell behavior in response to extracellular stimuli (either in normal or in pathological contexts), changing cell size, energy metabolism, translation, and nucleotide biosynthesis. These processes have a potential feedback on global RNA synthesis, processing, and turnover and are controlled by different Myc-regulated genes. Consistent with this evidence, RNA amplification is observed in different physiological transition states, such as quiescent versus activated, but also normal versus tumor or tumors with variable Myc levels (Fig. 6). Therefore, Myc may regulate specific gene sets that increase the expression of other indirect Myc target genes, through a sort of
domino effect, rather than inducing a general amplification, and
RNA amplification is independent from chromatin invasion (Perna et al., 2012; Sabò et al., 2014).
21
Fig. 6 – Schematic representation of Myc effects at different expression levels. Left: low Myc is required for selective regulation of a set of
Myc-dependent genes preceding S-phase entry and RNA amplification. Right: super-activation of Myc and chromatin invasion, but without further RNA amplification (Kress et al., 2015).
In this view, global changes in RNA and mRNA levels occur indirectly as a consequence of Myc-driven cell growth (Sabò and Amati, 2014). This is in an apparent contradiction with the general amplification model, considering also that the specifier
model proposes that most of Myc binding to chromatin is
non-productive in terms of transcriptional regulation (Kress et al., 2015). New insights about Myc ability to widely affect gene expression come from the observation that the increasing amount of Myc, from normal to tumor-specific levels, do not affect Myc binding at promoters where the transcription factor is already strongly bound in normal cells. Indeed, Myc increases only at weakly bound promoters. In this view, the transition state from a normal to a tumor cell is due to abnormal Myc levels which locate at previously empty binding sites or with a lower Myc amount. Therefore, Myc regulates distinct sets of genes in normal and
22
tumor cells according to its concentration: it is a specifier in some biological settings; in others it enhances the expression of all genes as a general amplifier. This novel hypothesis overcomes the apparent contradiction between the specifier and the amplifier
models (Lorenzin et al., 2016): a dose-dependent correlation
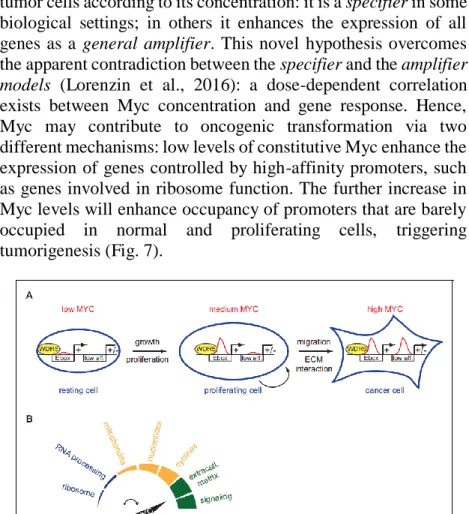
exists between Myc concentration and gene response. Hence, Myc may contribute to oncogenic transformation via two different mechanisms: low levels of constitutive Myc enhance the expression of genes controlled by high-affinity promoters, such as genes involved in ribosome function. The further increase in Myc levels will enhance occupancy of promoters that are barely occupied in normal and proliferating cells, triggering tumorigenesis (Fig. 7).
Fig. 7 – Schematic model of Myc DNA-binding ability. (A) high-affinity
binding sites, e.g. E-boxes, are already highly occupied at physiological Myc levels (medium Myc), in dividing cells. At oncogenic concentration (high Myc) also low-affinity (low aff.) binding sites may become occupied by Myc and the up-regulation of these low-affinity genes is suggestive for transformation. (B) Different Myc levels regulate distinct biological processes (Lorenzin et al., 2016).
23
A very recent study provides important insight into Myc capacity to affect the gene expression as a specifier. Only few hundred of genes show decreased messenger RNA output upon Myc loss, while the large majority of the transcriptome remains unaffected (Muhar et al., 2018) (Fig. 8). This Myc-dependent signature is composed by a group of genes involved in protein and nucleic acid biosynthetic pathways, confirming that Myc mainly contributes to the activation of specific transcriptional patterns which, in turn, promote the increase in RNA biosynthesis, generally associated with cell activation and transformation (Kress et al., 2015).
Based on these observations, the Myc expression levels are crucial to proper cellular function. Indeed, in normal cells Myc levels are finely regulated and Myc induces the expression of a specific set of genes (Sabò et al., 2014). In summary, during the transition from a quiescent to a proliferating state, Myc molecules (Fig. 6 and 7) increase, enhancing the expression of direct secondary target genes, that in turn promote the transcription of downstream genes (a domino effect). In tumors, at supraphysiological levels, Myc retains this ability but also overamplifies the transcription of genes which Myc normally does not or weakly binds (Lorenzin et al., 2016). This Myc behavior is called secondary RNA amplification (Fig. 8, late effects – indirect) in contrast to the genome-wide, direct transcriptional amplification model. In this view, the amplifier and the specifier model may be reconciled.
24
3. Omomyc
About twenty-five years later the discovery of myc gene, Sergio Nasi and Laura Soucek engineered a small peptide of 90 amino acids, named Omomyc, able to interfere with Myc function (Soucek et al. 1998). Omomyc action is different when compared to drugs or RNA interference, designed to fully inhibit Myc activity. In several genetic mouse models of cancer, Omomyc exerts extraordinary therapeutic capacity, with mild and well-tolerated side effects. Therefore, Omomyc is not only a tool to inhibit Myc activity to understand its molecular functions but represents also a hopeful and a successful agent for cancer therapy.
3.1 Structure of Omomyc and its interactors. Omomyc is a 90
amino acids Myc-bHLH mutant, with a molecular weight of 11 KD. It was designed by the accurate analysis of the crystallographic structure of DNA-bound Max homodimers (Ferrè-D’Amarè et al., 1993), to identify those amino acids crucial for heterodimerization with Myc. Four are the amino acids located in the Myc leucine zipper involved in dimerization: two glutamate residues (E57, E64) and two arginines (R70, R71); the corresponding positions in Max are occupied by two asparagines (N57 and N71), one isoleucine (I64) and one glutamine (Q70). In Omomyc, Myc E57 is substituted by a threonine (T), while the other three amino acids are the same as in Max (Fig.10). Omomyc also lacks Myc transactivation domain, it efficiently homodimerizes, can still heterodimerize with Myc, Max and Miz-1 (Soucek et al. Miz-1998; Savino et al., 20Miz-1Miz-1; Jung et al., 20Miz-17). Omomyc forms a complex with Max with high efficiency, like Myc/Max dimers, while DNA binding affinity of Myc-Omomyc heterodimer is low (Soucek et al., 1998).
25
Fig. 10 – bHLH sequence comparison of Max, Myc and Omomyc.
Amino-acidic bHLH sequence are shown. Red rectangles highlight the four mutated amino-acids.
In the presence of Omomyc, Myc-dependent gene transcription undergoes general repression. This occurs because Omomyc selectively targets Myc protein interactions, as confirmed by its binding with Miz-1, a known Myc co-repressor (Wiess et al., 2013). Specifically, Omomyc interferes with Myc binding to E-boxes and prevents the transactivation of target genes, retaining Myc transrepression properties in association with Miz-1. In parallel, broad epigenetic changes occur, such as decreased acetylation and increased methylation at lysine 9 of histone H3 (Savino et al., 2011). Further, both Myc and Omomyc functionally associate with the Methylosome 50-Protein Arginine Methyltransferase 5 (PRMT5-MEP50) complex, inducing H4R3 symmetric di-methylation (H4R3me2s), supporting Omomyc function as a transcriptional repressor of Myc target genes (Mongiardi et al., 2015). Consistently, Omomyc induces histone deacetylation while Myc promotes acetylation (Savino et al., 2011, Ullius et al., 2014; Mongiardi et al., 2015). These findings further suggest that Omomyc may be considered a sort of transcriptional repressor. A recent and accurate crystallographic analysis (Fig.11) confirms that Omomyc forms more stable homodimers compared to Myc-Max heterodimers because of ionic and hydrophobic interactions. Indeed, Omomyc dimers with Myc or Max appear to contain repulsive interactions or to lack stabilizing interactions that decrease their stability, suggesting
26
that Omomyc preferentially forms homodimers (Savino et al., 2011; Jung et al., 2017). Omomyc homodimers bind DNA with higher affinity compared to Myc-Max complexes, showing also a competition for E-boxes binding (Jung et al., 2017).
Fig.11 – Structure and DNA binding of Omomyc. Crystal structure of the
Omomyc homodimer bound to a consensus E-box. The CACGTC sequence is highlighted in blue (Jung et al., 2017). Omomyc forms a homodimer with an overall structure that is very similar to those other b/HLH/Zip structure, in particular to that of Myc-Max.
3.2 Overview of Omomyc action in cancer. The outstanding
capacity of Omomyc to inhibit Myc oncogenic action is supported by several in vitro and in vivo studies. Omomyc can potentiate Myc-induced apoptosis and, inhibiting Myc DNA-binding to the E-boxes, antagonizes Myc-induced papillomatosis (Soucek et al., 2002). While Myc-induced apoptosis requires ARF and p53, Omomyc-dependent apoptosis does not require ARF, although p53 remains necessary. Its proapoptotic action is most likely related to Myc transrepression function and it is intriguingly limited only to cells harboring activated Myc (Soucek et al., 2004;
27
2010). Surprisingly, Omomyc prevents the development of lung tumors and trigger their rapid regression, with well-tolerated and reversible systemic side effects, upon restoration of Myc function (Soucek et al., 2008, 2013). Moreover, Omomyc suppresses cell growth by inducing apoptosis or cell cycle arrest in G1, targeting Myc in several types of Myc-addicted lung tumor cells (Fiorentino et al., 2016). The ability of Omomyc to be a potent tumor-suppressor, is further demonstrated by studies on glioma in
vitro and in vivo. Here, the small peptide suppresses glioma
formation, inhibits glioma cell proliferation and survival, and triggers regression of established disease in mice (Annibali et al., 2014). Additionally, Omomyc induces differentiation in specific stimuli conditions (Grayson et al., 2014). The little toxicity in Omomyc expressing normal tissues may be due to the capacity of Omomyc in discriminating between physiological and oncogenic functions of Myc (Fig. 12). Indeed, Omomyc causes a significant decrease in Myc promoter occupancy preferentially at binding sites invaded by oncogenic Myc levels, attenuating both Myc-dependent activation and repression of the gene expression (Jung et al. 2017).
Fig. 12 – Omomyc occupancy increases at low affinity promoters that are
28
4. Experimental models
4.1 Glioblastoma multiforme (GBM). Glioblastoma multiforme
is one of the most malignant tumors of the brain, that remains largely incurable and with a poor prognosis. Patients usually have a median survival of 14 to 18 months from the diagnosis. With a global incidence of 10 per 100,000 people, it can occur at any age, but the peak is between 55 to 60 years (Jansen et al., 2010; Hanif et al., 2017). Glioblastoma stem cells (GSCs) are responsible for GBM development, progression, maintenance and tumor recurrence. They are multipotent, resistant to therapies and they are located in specific niches, characterized by different stromal cells such as mesenchymal and immune cells, with abnormal extracellular matrix components and an atypical vascular network. Furthermore, they are characterized by developmental and repair programs, typical of normal stem and progenitor cells, to support the expansion of the tumor (Lee et al., 2006; Bao et al., 2006; Cloughesy et al., 2014; Lathia et al., 2015) (Fig. 13). Glioma stem cells express high Myc levels (Wang et al., 2008), which are required to sustain GSCs phenotypic features such as growth, proliferation, self-renewal and survival. Indeed, it correlates with the grade of malignancy (Herms et al., 1999).
29
Fig. 13 - Schematic representation of the cancer stem cell in glioma. Current therapies target highly proliferating cells, leaving a small population of quiescent cells that are thought to be responsible for tumor recurrence (Seymour et al., 2015).
4.2 Burkitt’s lymphoma (BL). Burkitt’s lymphoma is the fastest
growing human tumor and is a highly aggressive B-cells, non-Hodgkin lymphoma. Infection by the Epstein Barr Virus (EBV) precedes tumorigenesis. The incidence is frequent in childhood and increases in immuno-depressed patients such as in HIV infection (Molyneux et al., 2012). Burkitt’s lymphoma is characterized by a significant deregulation of myc gene. Here,
myc is involved in reciprocal Burkitt translocations [t (8;14), t
(8;22), and t (2;8)] (Fig. 14). In t (8;14) human Burkitt cell lines,
myc is directly translocated into the heavy chain locus of
immunoglobulin (IGH) (Dalla Favera et al., 1982; Taub et al., 1982; Molyneux et al., 2012) and it is under the control of the IGH promoter, a phenomenon crucial for tumorigenesis. However, Burkitt’s lymphoma cases without myc gene rearrangement but with high Myc expression levels and DNA methyltransferases (DNMT family member) deregulation have been identified (De Falco et al., 2015). Furthermore, in a certain number of Burkitt’s lymphoma cell lines, Myc protein is also significantly stabilized, suggesting that aberrant Myc proteolysis
30
may play a crucial role in the pathogenesis of Burkitt’s lymphoma (Mark et al., 2000).
Fig. 14 – Burkitt’s lymphoma mutation. The figure depicts a typical
31
AIM OF THE RESEARCH
Deregulation of Myc, common in several human cancer, makes the Myc protein an attractive therapeutic target. Omomyc is a mutant of Myc at the bHLH domain that affects Myc function at the level of protein interactions and DNA binding and strongly reduces Myc tumorigenic properties in vitro (Soucek et al., 1998; Savino et al., 2011). Omomyc displayed therapeutic efficacy in a variety of mouse transgenic models, such as Myc-induced papillomatosis, lung carcinoma, pancreatic islet tumor, glioma and others, with very well tolerated side effects in vivo (Soucek et al., 2002; Annibali et al., 2014). Thus, it is important to elucidate how Omomyc works at the cellular and mechanistic level in tumor cells besides its use as a tool to dissect the Myc molecular function in cancer. Glioblastoma multiforme (GBM) and Burkitt’s lymphoma (BL) are two very aggressive tumors in which Myc contribute to maintain oncogenic programs (De Bacco et al., 2014; Dalla Favera et al., 1982; Cesarman et al., 1987). The aim of this research was to interfere with Myc action using Omomyc in Brain Tumor 168 (BT168) and Ramos cells, derived respectively from human GBM and BL specimens. Specifically, our first interest was to evaluate the impact of Omomyc expression at the transcriptional level to identify the genes most significantly and differentially modulated by Myc inhibition in BT168 cells. This may lead to a better understanding of the gene networks critical for the GBM phenotype and pivotal to the anti-tumorigenic properties of Omomyc. In the second part of the project, considering that Myc regulates many aspects of transcription, from initiation to elongation and that Myc and PRMT5 functionally interact (Rahl et al., 2010; Mongiardi et al., 2014), we investigated a potential role of Myc in the PRMT5-dependent symmetrical di-methylation of R1810 residue at the carbossi-terminal domain (CTD) of RNA polymerase II
32
(RNAPII), required for termination process and splicing of the transcripts (Zhao et al., 2016).
33
5. Results
5.1 Omomyc suppresses tumorigenic features of glioblastoma stem-like cells and Burkitt’s lymphoma cells. Omomyc is a
potent tumor suppressor able to induce apoptosis and inhibit oncogenesis (Soucek et al., 2002 and 2008; Annibali et al., 2014). To better investigate the impact of Myc inhibition we employed the doxycycline-inducible pSLIK-Flag-Omomyc (FO) lentivirus (Fig. 1 A). We stably transduced the lentivirus in BT168 GSCs (De Bacco et al. 2012) and BL cells Ramos (Dalla Favera et al., 1982). Omomyc was detectable at 4–12 h post-doxycycline (DOX) treatment, reaching maximal levels at 36h-48 h (Fig. 1 B).
Fig. 1 - (A) Scheme of the inducible lentiviral expression vector
pSLIK-Flag-Omomyc. I. In the absence of DOX, transactivator protein is not bound to the TRE (Tetracycline Responsive Element) promoter and Flag-Omomyc is not
A
34
expressed. II. DOX treatment induces conformational changes of transactivator protein which binds to TRE and promotes the Flag-Omomyc expression. (B) Representative immunoblots of Flag-Omomyc and -Actin or Tubulin loading controls upon DOX treatment in BT168FO cells for 0–48h and Ramos FO cells for 0-36h.
DOX treatment caused a reduction of proliferation in BT168FO cells but not in control cells expressing a DOX-inducible green fluorescent protein (BT168GFP) (Fig. 2 A). Further, Omomyc expression induced a strong decrease of GSCs self-renewal capacity and neurosphere size (Fig. 2 B). In support to this observation, Omomyc decreased also the expression of genes involved in neural stem cell self-renewal and proliferation,such as SOX2, NOTCH1, CCND1 (cyclin D1), MYC and NESTIN (Gangemi et al., 2009; Piccin et al., 2013; Matsuda et al., 2015), while PTEN, a tumor suppressor, able to enhance differentiation and inhibit cell renewal (Zheng et al., 2008), increased (Fig. 2 C). Also, the migratory ability of GSCs, which accounts for their capacity to infiltrate the tumor (Chen et al., 2014), was strongly restrained by Omomyc (Fig. 2 D).
B A
D C
35
Fig. 2 - Omomyc inhibits GSC cell proliferation, self-renewal, and migration. (A) Proliferation curves of BT168FO and BT168GFP cells upon
DOX treatment for 0–96h (n=3; mean ± SD). Viable cells were counted using a hemocytometer. (B) Self-renewal assay upon DOX treatment. Left. Histograms show the percentage of BT168FO cells capable of re-forming neurospheres 7 days after dissociation and treatment (n=3; mean ± SD). Right. Representative image of neurospheres. (C) Evaluation, by qRT–PCR, of GSC markers’ mRNA, CCND1, MYC, SOX2, NOTCH1, NESTIN and differentiation markers PTEN in BT168FO cells after 48h of DOX treatment, compared to uninduced cells (n=3; mean ± SD). (D) Transwell migration assay of BT168FO cells after 3 days with or without DOX treatment (n = 3; mean ± SD). Ten fields per assay were counted.
In RamosFO cells, Omomyc expression strongly reduced G1 phase progression (Fig. 3 A), increased the apoptotic rate (Fig. 3 B) (Soucek et al., 2002; Fiorentino et al., 2016), and upregulated the expression of the cell cycle inhibitor p21 (Fig. 3 C). This suggests that the cell cycle inhibition and apoptosis induction by Omomyc in Ramos cells may be related to an increase in p21 protein expression (Abbas et al., 2009).
Fig. 3 - Omomyc inhibits cell cycle progression and increases apoptosis rate in RamosFO cells. (A) Cell cycle analysis following 12-36h DOX
treatment. Cells were analyzed for cell cycle distribution by PI staining and flow cytometry. Histograms show the percentage of cells distributed respectively in G1, S and G2 phases (n=3, mean ± SD. Statistical analysis was performed by one-way ANOVA, p-value ≤ 0,05). (B) Apoptotic cell death analysis after 12-36h DOX treatment. Apoptosis was determined using the
B A C V V C
36
Annexin V-FITC/PI double marked method by flow cytometry (n=2, mean ±SD). (C) Representative immunoblot showing p21 and β-actin loading control upon 48h DOX treatment of Ramos FO.
5.2 Impact of Omomyc expression on Myc genome occupancy. Myc binds to E-boxes of thousands of genomic loci
with Max (Conacci-Sorrell et al., 2014), Omomyc inhibits Myc/Max heterodimers formation (Soucek et al., 1998). To assess the impact of Omomyc expression on Myc DNA binding, we performed chromatin immunoprecipitations with antibodies against Myc and Flag, followed by DNA sequencing (ChIP-seqs) in BT168FO cells treated or not with DOX for 24h. In untreated cells, we detected over 12,000 Myc peaks: 36% were localized at promoters, corresponding to 21% of all RefSeq promoters defined as -1,000 to + 100 bp regions surrounding the transcription start site (TSS), 37% were intragenic and 27% intergenic (Galardi et al., 2016). Omomyc expression led to a strong and genome-wide attenuation of Myc signals at promoters (Fig. 4). This was paralleled by the appearance of Omomyc signals in the same regions, as shown by theheat maps (Fig. 4 – left) and signal profiles of gene clusters (Fig. 4 – right). Further, in BT168FO cells, Omomyc distribution at the genomic loci of each gene clusters of Fig. 4 seems to overlap with Myc occupancy in uninduced cells. Indeed, Omomyc binds sequence motifs also bound by Myc in the minus DOX condition, as indicated by the motif enrichment analysis (Table 1, Galardi et al., 2016).
37
Fig. 4 – Genome wide attenuation of Myc binding around TSSs upon Omomyc expression. Left. Seq-miner heatmaps of Myc and Omomyc
occupancy at TSS of all Myc promoter-target genes in BT168FO, in the presence or absence DOX for 24h. TSSs regions are ranked by decreasing Myc occupancy in untreated cells. Colour scaled intensities are in units of tags per 50bp. The plots on the right depict Myc and Omomyc binding at cluster genes indicated by arrows, in cells, in the presence or absence DOX.
38 Table 1
39
Patterns of Myc and Omomyc ChIP-seq signals on three known Myc target genes - NCL (nucleolin), ODC (Ornithine decarboxylase) and MIR17HG (miR-17-92 microRNA cluster host gene) were thoroughly analyzed. Omomyc was enriched at target promoter regions upon the decrease of Myc signals, except for MIR17HG (Fig. 5 A).
We observed that Omomyc caused a significant increase in Max protein expression in parallel with a decrease of Myc protein expression in both DOX induced BT168FO and Ramos FO cells (Fig. 5 B). Therefore, we asked whether Omomyc replaces Myc on the genome in partnership with Max. For this purpose, we performed qChIP assays with Max antibody. Surprisingly, we found that Max binding was strongly impaired in the presence of Omomyc suggesting that Omomyc does not bind to DNA in a complex with Max (Fig. 5 C). Omomyc likely binds chromatin as homodimers, which is the most abundant form within cells (Savino et al., 2011; Jung et al., 2017).
A C V V
40
Fig. 5 - Omomyc attenuates Myc and Max binding at DNA. (A) Myc (blue)
and Flag-Omomyc (red) ChIP-seq signals at Myc target genes in treated and untreated BT168FO cells: NCL, MIR17HG and ODC. (B) Representative immunoblots of BT168FO and Ramos FO cells induced for 24h and relative quantification of Myc and Max proteins expression, value** 0,01; p-value*** 0,0009 (mean ± SEM. Statistical analysis was performed by paired t-test). (C) qChIP assays from BT168FO cells, in the presence or absence DOX, and immunoprecipitated by Flag, Myc and Max antibodies (Galardi et al., 2016).
B
41
To investigate the global impact of Omomyc on the transcriptome and to analyze its relationship with Myc binding, we performed RNA-seq and compared the results with ChIP-seq. We defined the significantly modulated transcripts through CuffDiff2, as well as by applying a fold change cut-off (log2FC ≥ 0.25 or ≤ −0.25)
and a P‐value threshold. We also assessed significantly modulated Myc targets by Gene Set Enrichment Analysis (GSEA, www.broadinstitute.org/gsea/). The outcomes of these approaches were coherent (Galardi et al., 2016).
The analysis showed that 94% of Myc promoter-targets were transcribed (FPKM>0; FPKM: Fragments Per Kilobase of gene Million mapped reads). Myc promoter occupancy, defined in methods, grew together with transcript levels, confirming the correlation between increased transcription and increased Myc binding (Lin et al., 2012; Wolf et al., 2015). Myc promoter occupancy in the presence of Omomyc was reduced by 40-50% (Fig. 6 A, B) and the expression of Myc target genes was no longer Myc-dependent. Further, we found that Myc occupancy of downregulated genes (log2FC ≤ −0.25) was increased by 18%
compared to upregulated genes (log2FC ≥ 0.25) in uninduced cells
(Fig. 6 C). Although Myc occupancy was halved in both groups of genes in the presence of Omomyc, the difference in Myc occupancy between downregulated and upregulated genes was maintained, but in opposite manner: upregulated genes showed 10% increase of Myc occupancy compared to downregulated genes (Fig. 6 C).
42
Fig. 6 - Myc and Omomyc occupancy on the genome. (A) Myc and Omomyc
promoter occupancy correlate with transcript levels. Binned scatter plot displays Myc and Omomyc ChIP-seq reads at promoters (-1,000, +100 regions with respect to TSS) versus transcript levels (FPKM from RNA-seq data) in BT168FO cells untreated or upon 24h of DOX. (B) Scatter plot depicting the correlation between Myc occupancy in untreated versus treated BT168FO cells. (C) Bar graph shows the average of Myc occupancy, in the absence or presence of DOX, of Myc promoter-targets both downregulated and upregulated by Omomyc in BT168FO cells (cut off absolute value log2 FC
0,25).
A B
C
43 5.3 Impact of Omomyc on GSCs transcriptome. Albeit we
found that in untreated cells 94% of Myc promoter-targets were transcribed (Galardi et al., 2016), Omomyc expression does not modulate the gene expression of the majority of Myc targets, that we classified as unchanged (Fig. 7 A). Nevertheless, by comparing the average value of the expression level of Omomyc downregulated and upregulated Myc target genes in untreated vs treated BT168FO cells, we observed that, in the absence of Omomyc, downregulated genes were more highly expressed than the upregulated. This difference was maintained upon Omomyc expression (Fig. 7 A, B). Moreover, the degree of Omomyc influence on gene expression is described by a strong linear correlation between the expression level of genes at 0h versus 24h of Omomyc induction (Fig. 7 C). Indeed, we observed that as the expression of genes increases, the probability that these genes will be repressed by Omomyc increases (Fig. 7 D); conversely, Myc target genes expressed at a lower level in the absence of Omomyc are both 20% upregulated or downregulated (Fig. 7 E). Extending the analysis to all the genes, we found that Omomyc affected also the expression of those not directly bound by Myc, albeit most of the them were unchanged (Fig. 8 A). Nevertheless, also, in this case, the most highly expressed genes were preferentially downregulated by Omomyc (Fig. 8 B).
44 A B Downregulated 87,60 68,37 12% 159 Unchanged 76,55 73,36 74% 1008 Upregulated 17,57 22,46 15% 204 Myc promoter-targets (average FPKM) n°genes
All Myc promoter-targets
C
All Myc promoter-targets
(24h) (24h)
45 Myc promoter-targets (1≤FPKM≤100 in -DOX)
y=0.8x-0.22
y=1.25x+0.43
D Myc promoter-targets (FPKM≥100 in -DOX)
46
Fig. 7- Omomyc effect on the expression of Myc promoter-targets. (A) The
table shows the average of FPKM of Myc targets (FPKM≥1) subdivided in downregulated, upregulated and unchanged genes upon 24h of Omomyc induction in BT168FO cells. (B) Box plot depicts the FPKM average values of downregulated or upregulated Myc targets in the presence or absence of Omomyc. n=3. The horizontal lines indicate median, whiskers extend to 1.5x interquartile range, while outliers are not shown. P-values (p) were calculated using two-sided, paired Wilcoxon signed-rank test. (C) Transcript level distribution (cut off absolute value log2 FC 0,25) of all Myc targets
significantly downregulated (red dots) or up regulated (green dots) in cells treated with Dox for 24h versus untreated cells. Transcript levels, expressed as FPKM, represent the mean of three independent experiments. (D-E) Transcript level distribution of highly expressed Myc targets (FPKM≥100) or moderately expressed (1≤FPKM≤100).
Downregulated 39,52 29,27 9% 833 Unchanged 41,61 42,06 69% 6221 Upregulated 12,33 16,02 22% 2013
n°genes
All the rest of genes (average FPKM) A B y=1.26x+0.42 y=0,80x-1.7 -DOX +DOX non-Myc targets
47
Fig. 8 – Impact of Myc inhibition on non-Myc targets. (A) The table shows
the mean FPKM of non-Myc targets (FPKM>1) subdivided in downregulated, upregulated and unchanged genes upon 24h of Omomyc expression in BT168FO. (B) Dispersion graph shows the strong correlation (R=0,98 and R=0,99) between transcript level distribution of genes (cut off absolute value log2 FC 0,25) significantly downregulated (red dots) or upregulated (green
dots) in cells treated with DOX for 24h versus untreated cells (0h). Transcript levels, expressed as FPKM, represent the mean of three independent experiments.
To clarify the function of Omomyc modulated genes, we investigated the overlap of genes regulated by Omomyc at 4, 8, 16, 24 and 48 h in BT168FO cells with the hallmark gene sets of the Molecular Signature Database (MsigDB). For Myc targets, we found highly significant overlaps with gene sets related to epithelial-mesenchymal transition, TNFA signaling via NF-κB, hypoxia, angiogenesis, inflammatory response, p53 signaling, glycolysis, WNT beta-catenin signaling, mitotic spindle, UV response, E2F targets at 4h – 8h of Omomyc induction. At 16h - 48h, instead, we observed a significant modulation of MTORC1 signaling, DNA repair, KRAS signaling, NOTCH signaling, G2M checkpoint, oxidative phosphorylation (Fig. 9 A). Hence, we observed an early and delayed specific action of Omomyc in modulating pathways in which Myc may have a role (Fig. 9 A). The same analysis was performed on non-Myc targets and showed a significant modulation of pathways overlapping those associated to Myc targets, such as hypoxia, oxidative phosphorylation, G2M checkpoint, DNA repair, UV response (Fig. 9 B). The appearance of different pathways in MsigDB analysis at early and longer times of Omomyc induction was coherent with the growing number of genes – both Myc and non- targets - modulated by Omomyc throughout the time course (Fig. 9 C). This suggests that Omomyc may affect the expression of specific gene sets, that, in turn, cause a sort of domino effect, resetting the transcription of key gene networks for GSC phenotype.
48
Galardi et al., 2016
49 B
50
Fig. 9 - Gene Set Enrichment Analysis (GSEA) - MSigDB of all genes significantly modulated by Omomyc in BT168FO cells. (A) Enrichment of
MsigDB hallmark gene sets among genes with a Myc peak, at promoter, intragenic, and intergenic regions in BT168FO cells and whose mRNAs are modulated by Omomyc (estimated by CuffDiff2 and GSEA; q-value ≤0,05). (B) Enrichment of MsigDB hallmark gene sets among all non-Myc target genes significantly modulated by Omomyc (estimated by CuffDiff2 and GSEA; q-value ≤ 0,05). FDR q-values were computed through GSEA (FDR q-values ≤ 0,05). Bar colours indicate the different time points of DOX treatment (0-48h), while their height represents the log0,05 of the FDR q-value
of each gene set. (C) Each bar shows the increasing number of genes significantly (q-value ≤0,05) modulated by Omomyc along the time course 0-48h of DOX treatment.
These data show that Omomyc inhibits Myc activity at DNA-binding level and affects the expression of Myc-dependent gene regulatory networks.
5.4 Omomyc minimally – or not at all - influences the global RNAPII binding at promoters and affects transcription in a subset of target genes only. Myc is found at promoters of all
active genes, triggering transcriptional amplification by pausing release, with consequent increase of transcripts level (Rahl et al.,
51
2010; Lin et al 2012; Nie et al., 2012). We asked whether Myc replacement by Omomyc would influence RNA polymerase II (RNAPII) loading at promoters and transcriptional elongation. To this aim, we performed ChIP-seq experiments in BT168FO cells using aRNAPII antibody in the presence or absence of Omomyc and compared the results with RNA-seq. We did not observe relevant global changes of RNAPII loading around TSSs (Fig. 10 A). Further, we analyzed RNAPII traveling ratio (TR), an index for evaluating the pause release (Rhal et al. 2010), from the RNAPII ChIP-seq experiments in minus versus plus Dox. We found that Omomyc minimally changes the TR, suggesting that it does not significantly impact onpause release (Fig. 10 B). These data suggest that Omomyc only marginally affects RNAPII loading at promoters and pause release.
However, we asked whether loss of Myc binding, Omomyc presence at Myc genomic loci and RNAPII distribution were correlated to a specific set of genes. To this aim, we analyzed OLIG2 and miR-17-92, together with NCL, HDAC1 and DUSP10. They all were expressed at good levels (FPKM> 4) in BT168FO cells and showed a decrease of Myc binding at their respective promoters (blue; Fig. 10 C) upon Omomyc induction. Indeed, NCL, miR-17-92 and OLIG2 clearly displayed decreased transcript levels (Fig. 10 D). Omomyc binding (green; Fig. 10 C) was associated with minimal changes of RNAPII signals at TSSs, except for OLIG2. No correlation was observed between decreased Myc binding and transcript levels of HDAC1 and DUSP10, whose mRNA levels were barely affected by Omomyc (Fig. 10 C and D). To note, a reduction of RNAPII signals at transcription termination sites (TTSs) was found for OLIG2 and miR-17-92 (Fig. 10 C). NCL and miR-17-92 are well-known Myc upregulated targets in different cell contexts; on the contrary, Myc-dependent regulation of OLIG2, one of the master controllers of neural stem cell behavior, was unknown.
52 A B D C *FPKM * Galardi et al., 2016
53
Fig. 10 – Correlation between RNAPII, Myc and Omomyc occupancy. (A)
Heatmap of RNAPII signals around TSSs of Myc promoter-target genes in BT168FO cells, in the presence or absence of DOX for 24h. The data are ranked by decreasing Myc occupancy in uninduced BT168FO cells. Each row shows the ± 5 kb region centred on TSSs. Colour scaled intensities are in tags/50 bp. (B) Traveling ratio of RNAPII from ChIP-seqs in the presence or absence of Omomyc. (C) RNAPII tracking by ChIP-seq at NCL, OLIG2, miR-17-92, HDAC1 and DUSP10 genes in BT168FO cells (-/+DOX). The y-axis displays RNAPII binding signals as tags/500 bp per million reads, whereas x-axis shows genomic positions. Arrowheads indicate the direction of transcription. In blue Myc peaks and in green Omomyc peaks, grey boxes are TSS regions. (D) Gene expression levels of genes shown in B (n=3).
5.5 Myc strengthens the regulatory nodes of glioblastoma gene expression networks. The direct regulatory functions of
Myc remain debated. Two models have been proposed to explain its function: one proposes that Myc acts as a universal amplifier of all active genes (Lin et al., 2012; Nie et al., 2012), while the other model defines Myc as a specifier, that is a gene-specific regulator (Walz et al., 2014; Sabò et al., 2014). Altogether, our previous observations do not clarify whether Omomyc affects GSCs transcriptome directly or indirectly and how the changes of the expression of many genes may have a tumor suppression-specific effect. A possible explanation may be that Omomyc affects the control points of gene expression networks that sustain cancer stem cell behavior.
To test this hypothesis, we investigated the expression level of a set of genes selected for being related to such control points, according to literature data. We considered some universal Myc targets, by which Myc exerts its tumorigenic properties, transcription factors and other effectors involved in tumorigenesis and tumor suppression in several tumors, including GBM, and cell-specific factors that maintain GSCs phenotype (Suvà et al., 2014). We analyzed Myc targets CCND1, CDK6 and NCL and the miR-17-92 cluster, which have a role in cell proliferation, cell growth control and glioblastomagenesis (Daniel et al., 2014; Bellail et al., 2014; Goldsmith et al., 2014). Moreover, miR-17-92 inhibits, in turn, the expression of chromatin regulatory genes
54
like Sin3b (cellular senescence regulator), Hbp1 (neurogenesis regulator) and Btg1 (neuronal precursor regulator), maintaining a neoplastic state (Li et al., 2014). They were all strongly downregulated by Omomyc (Fig. 11 A). Furthermore, Omomyc expression repressed FOS, JUN and ID4 transcripts, encoding transcription factors that have a role in GBM onset and progression. On the contrary, Omomyc upregulated the tumor-suppressive phosphatases PTEN and PPP2R5A (protein phosphatase A regulatory subunit), a regulator of mitotic progression, and the long non-coding RNA (lncRNA) MIAT/GOMAFU, involved in neurogenic commitment and differentiation (Aprea et al., 2013). We also examined the dual specificity protein kinase phosphatases (DUSPs) which control MAP kinase signaling. Omomyc can affect components of this family genes in either direction. Notably, Omomyc strongly affected the expression of DUSP 4, 5, 6 (Fig. 11 A) which have been implicated in glioblastomagenesis (Prabhakar et al., 2014). GSCs phenotype in vitro and in vivo is maintained by a set of 19 TFs. A core subset of four of these TFs are enough for maintaining of GSC phenotypes. The four core TFs target a set of 325 genes (Suvà et al., 2014). By GSEA, we found that the set of 19 GSC-specific TFs was significantly associated with repression in response to Omomyc (Fig. 11 A). Omomyc downregulated the expression of three of the four core TFs, specifically POU3F2, OLIG2, and SOX2. Also, KDM1A (LSD1) lysine-specific histone demethylase/RCOR2 complex, which is a key effector of OLIG2 in GSCs, is repressed by Omomyc (Suvà et al., 2014; Yang et al., 2011). All these genes are Myc targets and their respective target genes were repressed by Omomyc (Fig. 11 A). Interestingly, Myc-dependent signatures, typical of other cell types, were significantly modulated by Omomyc in GSCs (from MSigDB Database v6.2). By GSEA-MSigDB software, we found that several Myc-upregulated gene signatures were downregulated by Omomyc in GSCs, while the opposite happened for Myc-downregulated gene signatures (Fig. 11 B and C). In conclusion, Myc inhibition by Omomyc not only strongly
55
influenced the transcript levels of key TFs responsible of GSC identity, of their targets and chromatin modifiers but also affected genes commonly modulated by Myc in other cellular contexts.