Contents lists available atScienceDirect
Health Policy
j o u r n a l h o m e p a g e :w w w . e l s e v i e r . c o m / l o c a t e / h e a l t h p o l
Disinvestment for re-allocation: A process to identify priorities in
healthcare
Sabina Nuti
∗, Milena Vainieri, Anna Bonini
Laboratorio Management e Sanità, Scuola Superiore Sant’Anna, piazza Martiri delle Libertà 33, 56127 Pisa, Italy
a r t i c l e i n f o
Keywords: Health priorities Benchmarking Efficiency Health resourcesa b s t r a c t
Resource scarcity and increasing service demand lead health systems to cope with choices within constrained budgets. The aim of the paper is to describe the study carried out in the Tuscan Health System in Italy on how to set priorities in the disinvestment process for re-allocation.
The analysis was based on 2007 data benchmarking of the Tuscan Health System with an impact on the level of resources used. For each indicator, the first step was to estimate the gap between the performance of each Health Authority (HA) and the best performance or the regional average. The second step was to measure this gap in terms of financial value.
The results of the analysis demonstrated that, at the regional level, 2–7% of the healthcare budget can be re-allocated if all the institutions achieve the regional average or the best practice.
The implications of this study can be useful for policy makers and the HA top management. In the context of resource scarcity, it allows managers to identify the areas where the institutions can achieve a higher level of efficiency without negative effects on quality of care and instead re-allocate resources toward services with more value for patients.
© 2009 Elsevier Ireland Ltd. All rights reserved.
1. Introduction
Resource scarcity and increasing demand for services require health systems to cope with difficult choices within constrained budgets. A range of concerns, ranging from ethical principles such as “accountability for reasonable-ness” through to economic goals of increasing productivity argue for a thoughtful approach that targets reductions as opposed to across-the-board cuts.
The typical health system approach of deriving bud-gets based on historical spending or political pressures can lead to sub-optimal use of limited resources[1]. Economic approaches can help decision makers by providing a sys-tematic and explicit way to set evidence-based priorities [2,3]even if they are not the sole consideration[4,5].
∗ Corresponding author. Tel.: +39 050883871; fax: +39 050883890. E-mail address:[email protected](S. Nuti).
In the process of resource re-allocation, different countries have followed varying approaches for setting pri-orities at national level[6]. Since 1970s many countries have adopted the Program budgeting and marginal analysis (PBMA) in the health sector[4,7]. PBMA has been developed as an attempt to rationalize the incremental budgeting approach, based on applications of opportunity cost and marginal analysis[8]. PBMA can be deployed at the micro-level (i.e. specific service areas or treatments) but also at the meso-level (Health Authorities) and the macro-level (Regional Health Systems or National Health Systems)[9]. Other budgeting and re-allocation techniques have used Health Technology Assessment techniques to guide disin-vestment decisions in ineffective treatments (e.g. guidance on disinvestment from NICE)[10,11].
This paper describes a study carried out in the Regional Health System of Tuscany, Italy. Using 2007 performance data, the study measures the impact that performance improvement could have on the amount of resources that
0168-8510/$ – see front matter © 2009 Elsevier Ireland Ltd. All rights reserved. doi:10.1016/j.healthpol.2009.11.011
Health Authorities (HAs) and the Regional Health Sys-tem could save and re-allocate to other services. This exercise highlights the role that benchmarking best prac-tices can play in disinvestment decisions. For this study, “disinvestment” in healthcare describes the processes of withdrawing health resources from existing healthcare practices, procedures, technologies or pharmaceuticals that are deemed to deliver little or no health gain rela-tive to their cost, and thus, no efficient allocation or health resources [10]. This means that disinvestment includes service reductions due to inappropriateness and sav-ings achieved through better efficiency identified through benchmarking (e.g. lower cost for the same output).
Performance benchmarking is a common improvement method in hospitals in Anglo-American countries. Despite the debate that has developed in UK National Health Ser-vice on how best practices were disseminated and used as models for emulation, benchmarking is still considered a highly desirable policy instrument[12]. Johnston[13]in an OECD report suggests that benchmarking is useful for improving performance, particularly improvements in effi-ciency and that it may provide a valuable way of reconciling rising demands for healthcare with limits on public financ-ing. In this sense benchmarking could be useful as a guide to disinvestment because it identifies where to free resources by improving performance indicators with an impact on resource utilization.
2. Background
The use of benchmarking as a managerial tool may be very useful in the Italian health sector where there is the widespread belief that costs cannot be reduced [14]. This is especially true within the Health Authorities (HAs) that have typically not competed with each other or used inter-regional benchmarking to guide improvement efforts. During the evaluation of annual Regional bud-gets, Health Authorities typically argue that they cannot reduce their spending due to already constrained budgets and existing deficits. In fact, most of HAs Chief Executive Officers (CEOs) argue that the current capitation crite-rion is not linked to true population needs and that DRG rates are out-of-date, particularly for highly complexity cases. They typically argue that it is self-evident that they have achieved maximum efficiency. Without a systematic approach to evaluating the performance of each HA, there is no ability to respond to these claims from an evidence basis.
This situation has changed in the Tuscany Region, where the Region has introduced a multidimensional Perfor-mance Evaluation System (PES) to assess and monitor its 12 Local Health Authorities (LHAs) and 4 Teaching Hospi-tals (THs)[15,16]. The PES is based on 50 measures, made up of 130 indicators, organized into six dimensions: popu-lation health, regional policy targets, quality of care, patient satisfaction, staff satisfaction, and efficiency and financial performance. Each measure is benchmarked and published to provide management, providers, and consumers the opportunity to compare the results across all organizations. The majority part of indicators receives an evaluation on the basis of the international, national or regional
stan-dards available. When there is no standard the evaluation is given on the basis of the regional mean or median. The performance assessment is divided into five classes: 1. very good performance;
2. good performance; 3. average performance; 4. poor performance; 5. very poor performance.
Classes are identified on the basis of the standard, the mean or the median and the regional standard deviation for each indicator.
During the pilot phase of PES, regional and HA top man-agers proposed a list of indicators, some of them already used in other countries[17–19]. Clinical indicators were submitted and approved by the Region. All indicators were also reviewed a variety of consensus exercises including an annual consensus conferences involving HA and regional managers, professionals and consumers. The same process guides the inclusion of new indicators each year[15]. The PES is now a central part of governance at the regional and HA levels and is linked to CEOs’ compensation.
In order to support regional and HAs management in quantifying the achievable level of efficiency if perfor-mance was at the highest observed (benchmark) level across all HAs, a research team presented the results reported here, that translate the performance improve-ments that the system could achieve if efficiency levels were the same as benchmark performers.
In 2007 and 2008 the overall performance (calculated as the percentage of PES indicators with good and very good performance minus the number of indicators with poor and very poor performance) is significantly and inversely corre-lated with the adjusted per-capita cost (r =−0.70, p < 0.05 in 2007 and r =−0.58, p < 0.05 in 2008). This finding, that quality and cost are inversely related, is consistent with the literature for some indicators. For example, reductions in length of stay have not led to increases in 30-day read-mission rates or the volume of physician visits for patients [20]. Likewise, shorter hospital stays have been associated with lower post-discharge death rates[21].
3. Methodology
In line with other European healthcare performance reports[13], the Tuscan PES shows substantial variability of performance across HAs[22]. Based on these differ-ences, the research team created an exploratory simulation based on 2007 performance data to quantify the amount of resources that could be saved.
Construction of the simulation followed four steps: (1) the identification of indicators to be analyzed, (2) the iden-tification of the minimum and maximum improvement that can be required to achieve benchmark performance, (3) the calculation of gaps between the performance of each HA and the mean or best performance, and (4) the translation of gaps into financial terms. An advisory panel composed of top managers from the Regional Department of Health and HAs provided advice throughout the con-struction and analysis of the simulation.
Table 1
List of selected indicators.
No. Indicators Intervention
regarding 1 General practitioners expenses Primary care 2 Paediatrics expenses
3 Other services expenses
4 Pharmaceutical expenses Pharmaceuticals 5 Inappropriate hospitalization rate Hospital 6 Average length of stay for medical
DRGs
7 Pre-surgical length of stay 8 Readmission within 30 days 9 % Hospitalization with LOS > 30
days
Continuity
10 Potential retirees Human resources management 11 Absenteeism rate
The first step was to select indicators. The advisory board validated the criteria of selection put forward by the research team and selected 11 indicators from the 130 PES indicator set.
Indicator selection was based on the following criteria: • Expected improvement in the indicator had to be linked to concrete and feasible actions through evidence in the literature or the consensus process or advisory board rec-ommendations.
• Indicators had to be expressed in Euros or easily trans-latable into Euros.
The 11 indicators described performance in hospitals, primary care, pharmaceuticals, or on continuity and human resources management (seeTable 1). Among the 11 indi-cators, six are efficiency indicators: average length of stay (ALOS) for each medical DRGs, pre-surgical LOS for planned interventions, three primary care indicators and pharma-ceutical expenses (mostly linked to off-label use). They all focus on the way resources have been used. Improvements on these indicators directly translate into potential savings. For human resources management, the indicator on potential retirees1 shows the opportunities (in terms of
number of employees) to re-allocate resources among units/wards/services by reducing the number of personnel. Once this indicator has been translated in financial terms, it provides forward-looking statements of potential savings or re-allocations.
The absenteeism rate is an indirect indicator of the organizational climate. High rate of absence means that employees are not satisfied with their working conditions (i.e. the perception of equitable treatment) [23]. When there is a high rate of absence, HAs are obliged to re-organize services with resulting extraordinary expenses.
The hospitalization rate over the regional median, pro-vides an estimate of potential inappropriate care. This work
1The indicator counts the number of employees with an age of more
than 60 and 65. According to the Italian labour law clinicians could retiree when they are 60, usually they end of working when they are 65. To this extent the indicator highlights the number of potential retirees.
builds off of work on both the use of small area varia-tions in utilization management[24,25]and ambulatory care sensitive conditions[26]. Reductions in inappropriate or avoidable hospitalizations should reduce costs and pro-vide opportunities for disinvestment. Hospital stays longer than 30 days provide an indicator of continuity of care: a high value is a signal that primary and hospital care is not organized around patients. These long lengths of stay were considered partially avoidable.
The readmission rate within 30 days for similar condi-tions is an indicator of preventable hospitalizacondi-tions[27]: HA that provided appropriate treatment and discharge planning should have a lower rate of readmission.
The second step was to point out, for each indicator, the minimum and the maximum level of improvement that can be expected from HAs. The two hypotheses were: • Hypothesis 1 (minimum improvement): changes to be
obtained if all HAs with a poor and very poor performance reached the mean or minimum standard.
• Hypothesis 2 (maximum improvement): changes to be obtained if all HAs could reach the regional target or regional benchmark.
Table 2shows the two exceptions to above hypothe-ses: the minimum and maximum improvement are equal for the hospitalization rate and the ALOS indicators. The median hospitalization rate, was chosen as the bench-mark during the consensus indicator selection exercise because an hospitalization rate below the median could be seen as an indicator of poor access. Likewise, for the ALOS indicator the consensus exercise suggested that a conser-vative approach keeping the benchmark and the minimum effort equivalent because of limits on case mix adjustment around ALOS. This is a conservative approach given that different authors have used more aggressive approaches [21,28,29].
The third step was to estimate the gap between each HA’s real performance and the performance required by the two hypotheses. This was done by taking the difference between the identified target for improvement and each HAs adjusted observed performance from 2007.
The final step was to determine the potential finan-cial difference under each hypothesis. The appropriate method for translating measures into costs has been widely and critically discussed [30–34]. One-third of indicators selected were already valued in financial terms but where the indicators were not valued in financial terms, three different methods to attribute costs were applied (see Table 3):
• The average wage that would be eliminated (potential retirees).
• The total personnel costs that would be avoided (the absenteeism rate).
• The total excess volume of DRGs (inappropriate hospital-ization rates).
• The total direct costs linked to the excess use of beds (ALOS and readmission rates).
Table 2
The criteria applied for each indicators in the two hypotheses.
No. Interventions Hypothesis 1 Hypothesis 2
1 General practitioners expenses Regional mean Regional best performance
2 Paediatrics expenses 3 Other services expenses 4 Pharmaceutical expenses
5 Inappropriate hospitalization rate Regional median Regional median
6 Average length of stay for medical DRGs Regional mean per DRGs Regional mean per DRGs
7 Pre-surgical length of stay Regional mean Regional target
8 Readmission within 30 days Regional mean Regional best performance
9 % Hospitalization with LOS > 30 days Regional mean Regional target
10 Potential retirees Over 65 years Over 60 years
11 Absenteeism rate Regional Mean Regional best performance
Table 3
Method of valuation applied to each indicators.
No. Interventions Method of valorization 1 General practitioners expenses Already expressed in
costs 2 Paediatrics expenses
3 Other services expenses 4 Pharmaceutical expenses
5 Inappropriate hospitalization rate DRGs fares 6 Average length of stay for medical
DRGs
Use of direct costs linked to the number of beds that can be re-allocated 7 Pre-surgical length of stay
8 Readmission within 30 days 9 % Hospitalization with LOS > 30
days
10 Potential retirees No. of potential retirees× average wage
11 Absenteeism rate Absenteeism rate× total personnel costs
In each case, direct avoidable costs related to the number of hospital beds derives from the number of avoid-able inpatient bed days. The amount of resources saved depends on the number of beds and on the basis of the type of intervention that can be planned based on three scenarios:
1. If the number of beds is lower than 12,2 only some
variable costs (laundry, food, pharmaceuticals, etc.) are avoidable. In this case, the financial value associated with each inpatient bed day is a fixed amount ofD40 for all HAs.
2. If the number of beds is some multiple of 12 (a typ-ical ward), reorganization of personnel is possible, with a consequent additional reduction in costs. In a short period of time the opportunity to move person-nel to other services, including community-based care, appears to be feasible especially for nurses, while over
2This cut off was identified by the top managers of HAs involved in the
discussion on the basis of their health information system. They pointed out that personnel can be moved across the units/wards when the activity cut corresponds to a number of beds equal to 12, while other resources (instruments, space, etc. and other fixed costs) could drop reaching 30 beds.
longer periods of time it may be possible to move physi-cians.
3. If the number of beds is some multiple of 30 (a typical floor), structural interventions such as reduction in bed numbers are also possible with a reduction of both costs related to care and fixed or overhead costs such as main-tenance and amortization costs. All of these calculations were based on 2007 costs.
The results from this exploratory study were reported to all top HA and regional managers and then reviewed as part of management training courses for this management group. Notably, this review did not identify any exceptional circumstances or problems that would argue against the potential savings.
4. Results
Table 4shows that at the regional level, from 2 to 7% of the 2007D6.1 million healthcare budget could be re-allocated if all the institutions achieve the regional average or the best practice. These estimates are derived from the sum of all the inefficiencies in the 11 indicators analyzed, considering the two hypotheses.
It is important to emphasize that not all of these savings would be monetized immediately. Some would need to realized over a longer period of time and some would be re-allocated to other services in order to realize the improved performance. In fact, some actions such as those regarding the continuity of care require cooperation of physicians, hospital staff, and institutions in different places.
At local level, large variation in the amount of poten-tial savings in 2007, suggest that some HAs were already efficient but others had large room for improvement. For example,Fig. 1shows that under Hypothesis 2 (maximum improvement), HAs could re-allocate between 1% and more than 9% of spending.
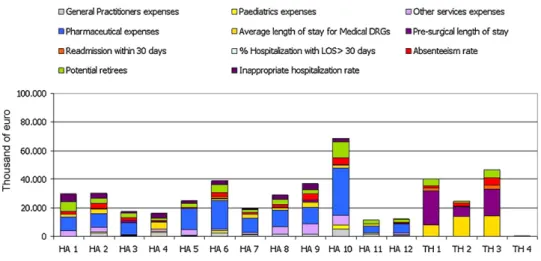
An interesting finding from this simulation is that it could provide a way of setting priorities among inter-ventions. Each HA can now distinguish areas where interventions are possible and there is room for improve-ment. The mix of potential savings coming from inter-ventions is different from one HA to another, depending on local strengths.Fig. 2 shows the resources to be re-allocated by HAs for each type of intervention, if all HAs reached Hypothesis 2 (benchmark) standard. For instance, it appears that TH 1 should concentrate its effort on the
Table 4
Regional amount of resources to be re-allocated in the two hypotheses.
No. Interventions Area of interventions Hypothesis 1 Hypothesis 2
1 General practitioners expenses Primary care D 4,415,057 D 19,882,497
2 Paediatrics expenses D 2,695,250 D 9,045,799
3 Other services expenses D 9,852,081 D 35,685,081
4 Pharmaceutical expenses Pharmaceuticals D 19,506,522 D 137,932,174
5 Inappropriate hospitalization rate Hospital D 7,185,468 D 11,294,459
6 Average length of stay for Medical DRGs D 59,844,704 D 59,844,704
7 Pre-surgical length of stay D 11,658,164 D 53,369,217
8 Readmission within 30 days Continuity D 340,477 D 6,714,571
9 % Hospitalization with LOS > 30 days D 486,397 D 536,404
10 Potential retirees Human resources
management
D 6,036,021 D 60,113,119
11 Absenteeism rate D 6,442,001 D 34,162,281
Total D 128,462,142 D 428,580,305
% on the regional annual budget 6.100 million of Euro
2.11% 7.03%
Fig. 1. Percentage of resources that could be re-allocated on the 2007 budget by each HA – Hypothesis 2.
average pre-surgical length of stay; its major inefficiency with a potential pay-off of more than 38,000 bed days, equal to 105 hospital beds orD21 million.
5. Limitations and further developments
There are a number of limits on the results, most notably, limits resulting from the use of means and bench-marks as guides to achievable benchbench-marks and problems with overlap and attribution of savings to specific inter-ventions. This means that the results presented here may be optimistic estimates of possible savings. In some cases, best performance (Hypothesis 2) is defined on the basis of the best performer instead of a national or regional target. This could lead to some problems such as the under-spending (that could occur, for instance, to the pharmaceutical expenses indicator without maintaining or improving quality) or data manipulation. These sorts of problems are likely only amenable to more detailed study or audit.
There is also a problem of overlap across indicators: for example, the reducing 30 day readmissions also reduces the overall hospitalization rate. In this case the total amount of resources that could be disinvested is less than the sum of those savings attributable to readmission and overall hospitalization rate reductions. Despite the risk of counting the same savings multiple times, the total amount was used because of its power to support identification of priorities across actions. In addition, the actions monitored in the study concern only 11 indicators; so even if there is an overestimation, it may be offset by the small num-ber of indicators involved in this exploratory study. This means that an extension of the same methodology may produce new opportunities for savings. Thus, the amount of resources available for re-allocation is likely higher than the totals reported under either hypothesis. Further research could focus on the collection of more diverse and detailed financial information to extend the analysis also to other performance indicators.
Other limitations could be addressed to the method used to apply financial value: for instance there could be an over/under estimation linked to the methods applied to human resources management indicators: in these cases the real effect depends upon the type of personnel that is absent or retired; for physicians there would be an under-estimation, for administrative personnel there would be an overestimation.
Another limit of the study could be the impact of the heterogeneity on performance variability. Some indicators are already adjusted for age and sex but other elements could impact on variability. It is authors’ opinion that the large variability showed in the results is much more due to organizational factors than to other socio-geographical aspects.
Further research should work to explore ways of reduc-ing the limitations on the study and on improvreduc-ing the practical guidance that can be given to managers pursu-ing the savpursu-ings targets. Once managers of the public health system are aware of the resources they can re-allocate and what actions they can pursue, the next step will be to identify the targets for re-allocation, that is, the
ser-vices that represent a much higher return in benefits to the population’s health. Experience in a number of juris-dictions suggests that re-investment decisions should be made in as transparent and evidence-based fashion as pos-sible and with the involvement of a wide set of stakeholders [10,34,35].
6. Conclusions
This benchmarking process changed the traditional pat-tern of complaints around the budgeting and resource allocation processes in Tuscany. The results of this study were shown to all CEOs in a meeting with the Regional lead-ership. It worked as a warning to all CEOs who argued that their HA had reached the maximum level of efficiency and that they needed more money to achieve required perfor-mance improvements. This study has also had a significant impact on the use of the performance evaluation system itself. Managers are now more aware of the value of bench-marking, not only to comprehend how their organization performs, but also to support the identification of priority intervention areas to improve efficiency. Some HAs even used the results as a starting point for planning organiza-tional changes in their institutions. In this context it has become difficult for HAs that show large room for improve-ment to argue that they do not have enough resources to achieve financial balance and that they needed a budgetary increase. This evidence has enabled the Tuscany Region to demolish pretexts, eliminating the word “impossible” and building a new culture around the “possible.”
However, the types of disinvestments suggested in this paper are not necessarily easy. They may force managers to deal with professional behaviour change in order to achieve the savings. Publication and distribution of data benchmarking, within and outside the organizations, rep-resents a means for managers[36]to make the case for resource re-allocation to improve performance. Likewise, the implications of this study may be extremely useful for both policy makers and the top management of HAs in a public system that bases its action on cooperation more than competition. Benchmarking helps to identify best practices and subsequently allows measurement of the resources that can be disinvested and re-allocated in the medium and long term. It will be important though to develop capacity for sharing and learning from best practices. Although there are some differences with the methods previously described, the NHS Institute for Inno-vation and Improvement has adopted a similar approach to measure in financial terms the possible improvements of some indicators using benchmarking available online (http://www.productivity.nhs.uk/).
In some cases, a single intervention could free millions of Euros that can be re-allocated for other services maxi-mizing value for citizens through Cost Benefit Analysis or Cost Effectiveness Analysis largely used for enhancing effi-ciency in a variety of settings[37]. Even if this analysis is only the first step in the process of resource re-allocation, it has enabled HAs and Tuscany Region to identify those resources that could be moved without reducing the qual-ity of services.
Acknowledgments
The authors wish to thank the researchers from Man-agement and Health Laboratory for their help in the development of this study and the top managers of Tuscan Health System. The authors also want to thank the col-leagues of the European Health Policy Group for the useful discussion and the reviewers of the paper, especially Prof. Adalsteinn Brown for his excellent advice during the review process of the paper.
References
[1] Mitton CR, Donaldson C. Health care priority setting: principles, practice and challenges. Cost Effectiveness and Resource Allocation 2004;2:3.
[2] Mitton CR, Donaldson C. Resource allocation in health care: health economics and beyond. Health Care Analysis 2003;11(3):245–57. [3] Mitton CR, Donaldson C, Waldner H, Eagle C. The evolution of PBMA:
toward a macro-level priority setting framework for health regions. Health Care Management Science 2003;6:263–9.
[4] Hauck K, Smith PC, Goddard M. The economics of priority setting for health care: a literature review. H N P Discussion Paper; 2004. [5] Baltussen R, Niessen L. Priority setting of health interventions: the
need for multi-criteria decision analysis. Cost Effectiveness and Resource Allocation 2006;4(14).
[6] Ham C. Priority setting in health care: learning from international experience. Health Policy 1997;42:49–66.
[7] Viney R, Haas M, Mooney G. Program Budgeting and Marginal Anal-ysis: a guide to resource allocation. New South Wales Public Health Bulletin 1995;6(4).
[8] Mitton CR, Patten S, Waldner H, Donaldson C. Priority setting in health authorities: a novel approach to a historical activity. Social Science & Medicine 2003;57:1653–63.
[9] Wilson H, Scott S. PBMA – its role in the future purchasing arrange-ments for health care services. Health Policy 1995;33:157–60. [10] Elshaug AG, Hiller JE, Moss JR. Exploring policy-makers’ perspectives
on disinvestment from ineffective healthcare practices. International Journal of Technology Assessment in Health Care 2008;24(1):1–9. [11] Pearson S, Littlejhons P. Reallocating resources: how should the
National Institute for Health and Clinical Excellence guide disinvest-ment efforts in the National Health Service? Journal of Health Service Research Policy 2007;12:160–5.
[12] Northcott D, Llewellyn S. Benchmarking in UK health: a gap between policy and practice? Benchmarking: An International Jour-nal 2005;12(5):419–35.
[13] Johnston DJ. Increasing value for money in health systems. European Journal of Health Economics 2004;5:91–4.
[14] Di Frischia F, Foschi P. I manager: “Più di così non si può tagliare”. Il Corriere della Sera, Roma; 01/10/2007. p. 3.
[15] Nuti S. La valutazione della performance in sanità. Bologna, Il Mulino; 2008.
[16] Nuti S, Bonini A, Murante AM, Vainieri M. Performance assessment in the maternity pathway in Tuscany Region. Health Service Man-agement Research 2009;22(3):115–21.
[17] Pink GH, McKillop I, Schraa EG, Preyra C, Montgomery C, Baker R. Cre-ating a balanced scorecard for hospital system. Health Care Finance 2001;27:1–20.
[18] Canadian Institute for Health Information, Government Hospital. Association and the University of Toronto. Hospital Report ‘99: a bal-anced scorecard for Ontario Acute Care Hospitals. Toronto: Ontario Hospital Association; 1999.
[19] Sutter Women’s & Children’s Services. First pregnancy and delivery. Clinical Initiative Resources. California: Sutter Health; 2001. [20] Harrison ML, Graff LA, Roos NP, Brownell MD. Discharging patients
earlier from Winnipeg hospitals: does it adversely affect quality of care? Canadian Medical Association Journal 1995;153:745–51. [21] Brownell MD, Roos NP. Variation in length of stay as a measure of
effi-ciency in Manitoba hospitals. Canadian Medical Association Journal 1995;152(5).
[22] Nuti S. Report 2007 – Il sistema di valutazione della performance della sanità Toscana. Pisa: Edizioni ETS; 2008.
[23] Dittrich JE, Carrel MR. Organizational equity perceptions, employee job satisfaction, and departmental absence and turnover rates. Organisational Behavior and Human Performance 1979;24(1):29–40.
[24] Fisher ES, Wennberg DE, Stukel TA, Gottlieb DJ, Lucas FL, Pinder EL. The implications of regional variations in Medicare spending. Part 1: the content, quality, and accessibility of care. Annals of Internal Medicine 2003;138:273–87.
[25] Fisher ES, Wennberg DE, Stukel TA, Gottlieb DJ, Lucas FL, Pinder EL. The implications of regional variations in Medicare spending. Part 2: health outcomes and satisfaction with care. Annals of Internal Medicine 2003;138:288–98.
[26] Magan P, Otero A, Alberquilla A, Ribera JM. Geographic variations in avoidable hospitalizations in the elderly, in a health system with universal coverage. BMC Health Services Research 2008;8: 42.
[27] Sibbritt DW. Validation of a 28 day interval between discharge and readmission for emergency readmission rates. Journal of Quality Clinical Practices 1995;15:211–20.
[28] Borghans I, Heijink R, Kool T, Lagoe RJ, Westert GP. Benchmarking and reducing length of stay in Dutch hospitals. BMC Health Services Research 2008:8.
[29] Hanning BW. Length of stay benchmarking in the Australian private hospital sector. Australian Health Reviews 2007;31:150–8. [30] Horngren CT, Foster G, Datar SM. Cost accounting: a managerial
emphasis. Canada: Prentice Hall; 1997.
[31] Negri-Clementi A. I costi rilevanti nelle decisioni di gestione opera-tiva: alcune situazioni tipiche in Amigoni F. Misurazioni d’azienda. Programmazione e controllo. Milano: Giuffrè Editore; 1988. [32] Cinquini L. La gestione dei costi in ambienti produttivi “snelli” in
Miolo Vitali P. Strumenti per l’analisi dei costi. Percorsi di cost man-agement Vol III. Torino: Giappichelli Editore; 2003.
[33] Coda V. I costi di produzione. Milano: Giuffrè Editore; 1968. [34] Wiseman V, Mooney G, Berry G, Tang KC. Involving the general
pub-lic in priority setting: experiences from Australia. Social Science & Medicine 2003;56:1001–12.
[35] Levin L, Goeree R, Sikich N, Jorgensen B, Brouwers MC, Easty T, et al. Establishing a comprehensive continuum from an evidentiary base to policy development for health technologies: the Ontario experi-ence. International Journal of Technology Assessment in Health Care 2007;23(3):299–309.
[36] Hibbard JH, Stockard J, Tusler M. Does publicizing hospital per-formance stimulate quality improvement efforts? Health Affairs 2003:22.
[37] Murray CJL, Evans DB, Acharya A, Baltussen RMPM. Development of WHO guidelines on generalized cost-effectiveness analysis. Health Economics 2000;9:235–51.