2019
Publication Year
2020-12-30T14:41:16Z
Acceptance in OA@INAF
Antenna Phase Center Analysis for the LOFAR Radio Telescope
Title
DI NINNI, PAOLA; BOLLI, Pietro; NESTI, Renzo; Virone, G.; PUPILLO, Giuseppe;
et al.
Authors
10.1109/APUSNCURSINRSM.2019.8888745
DOI
http://hdl.handle.net/20.500.12386/29383
Handle
DIGEST - IEEE ANTENNAS AND PROPAGATION SOCIETY. INTERNATIONAL
SYMPOSIUM
Antenna Phase Center Analysis for the
LOFAR Radio Telescope
P. Di Ninni, P. Bolli, R. Nesti
Osservatorio Astrofisico di Arcetri, INAF Largo Enrico Fermi 5, 50125, Firenze, Italy [email protected], [email protected],G. Pupillo
Istituto di Radioastronomia, INAF Via Gobetti 101, 40129 Bologna, Italy
G. Virone
Istituto di Elettronica ed Ingegneria dell’Informazione e delle Telecomunicazioni, CNR
C.so Duca degli Abruzzi 24, 10129, Torino, Italy [email protected]
S. J. Wijnholds
R&D Department, ASTRONOude Hoogeveensedijk 4, 7991 PD, Dwingeloo, The Netherlands
[email protected] Abstract—Knowledge of the phase centers of the constituting
antennas is important to obtain an accurate array response. This contribution shows an analysis of the antenna phase centers for a station of the Low Frequency Array (LOFAR) radio telescope. Based on simulated patterns, the positions of the phase centers for 46 antennas have been computed at 32 MHz showing considerable deviations from their physical positions due to mutual coupling. The flatness of the phase patterns significantly improves when the phase center is considered.
Keywords—Low-frequency aperture array; antenna phase center; embedded element pattern; radio astronomy
I. INTRODUCTION
Low Frequency Aperture Array (LFAA) systems allow the observation of the Universe with unprecedented sensitivity at frequencies up to several hundreds of MHz. One of the most renowned LFAA systems is the Low Frequency Array (LOFAR, http://www.lofar.org/), which is both a pathfinder of the low frequency instrument of the first phase of the Square Kilometre Array (SKA1-LOW, https://www.skatelescope.org/) and a stand-alone scientific instrument available to the astronomical community. In the last years, antenna, microwave and digital engineers have used the LOFAR experience for improving the design of the LOW instrument. Stations of both SKA1-LOW and LOFAR are based on a random distribution of the antennas to avoid grating lobes in the array response. On the other hand, this kind of distribution causes diversity in the response of the individual embedded antenna patterns due to different mutual coupling effects between antennas. This makes instrumental calibration a complicated task. For each antenna, besides the amplitude of the antenna response, mutual coupling also affects the location of antenna phase center, which is the position at which the phase pattern approaches a sphere. Accurate knowledge of the phase center is important because it represents the ‘radio-frequency’ position of the antenna and it minimizes the angular direction dependence of the phase pattern. In this contribution, we apply a minimization method in order to compute the coordinates of the phase center of each antenna composing the Low Band Antenna (LBA) inner array of LOFAR
operating in the frequency range 30-90 MHz. The LBA-inner array is composed of 46 dual-polarized antennas consisting of two perpendicular inverted-V shaped dipole antennas located on a 3x3 m ground plane.
II. METHOD DESCRIPTION
Given an electric field irradiated by an antenna, the phase pattern has to be referred to a generic point in the space usually corresponding to the reference system origin (O). Relative to a different origin (O´), the phase pattern can be obtained easily by the following equation:
Φ(𝜃, 𝜑) = Φ(𝜃, 𝜑) − 𝒌 ⋅ ∆ (1) where 𝜃, 𝜑 are the angular directions, ∆ is the vector distance between 𝑂 and 𝑂, and
𝒌 ⋅ ∆= [sin 𝜃 (cos 𝜑 ∆𝑥 + sin 𝜑 ∆𝑦) + cos 𝜃 ∆𝑧] (2) It is clear that a shift along the z-axis ( ∆𝑧 ) produces a symmetrical curvature of the phase pattern, while a displacement on the plane z=0 (∆𝑥 or ∆y) produces an asymmetry with respect to the z-axis.
Several methods for computing the phase center optimized on the basis of the problem size are proposed in the literature, see for instance [1]. As the aim of this contribution is to search for the phase centers along the principal planes separately, the evaluation of two independent real variables for each plane is
required. The phase center coordinates are estimated through the following condition:
𝑚𝑖𝑛{𝑠𝑡𝑑[Φ(𝜃, 𝜑) ]} (3)
where the term to be minimized is the standard deviation (std) of the phase patterns evaluated for different O’. Eq. (3) is solved in two independent steps: first for ∆𝑧 and then for ∆𝑥 or ∆𝑦. A suitable range and discretization of the O’ coordinates are selected to accurately estimate the phase center.
III. NUMERICAL RESULTS
In this section, results on the phase center analysis at 32 MHz for the LBA-inner array antennas (directed along North-East) are reported along the two principal planes over the zenith angular range between -45° and +45°. The analysis is conducted at the lower operative frequency, where antennas are electrically closer. A commercial full-wave EM software, FEKO, is employed to simulate the antenna phase patterns. The EM model of the LBA array has been validated using intensive hexacopter measurements [2]. The embedded phase patterns have been computed using the physical position of the base of each antenna as reference point. The estimated phase center displacements are indicated as (∆𝑥 , ∆z ) for E- and (∆𝑦 , ∆z ) for H-plane, the z-axis being orthogonal to the ground.
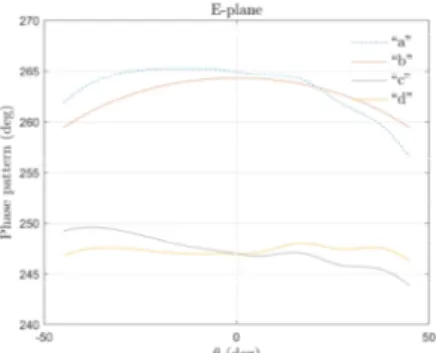
Figure 2 shows the embedded phase pattern (along E-plane) for a single antenna located at the edge of the LBA-inner array (“a”). As a reference, the phase pattern for the isolated antenna is also plotted (“b”). The latter pattern is characterized by a strong symmetry with no ripples due to the mutual coupling-free conditions, while the embedded pattern presents a pronounced and asymmetric curvature. Applying the first step of the minimization procedure (along z-axis) to the curve “a”, the phase pattern flattens (see “c”), although a distortion for negative 𝜃 and a ripple are still present. The asymmetrical gradient is removed by applying the second step of the procedure (along x-axis). This results in the phase center referenced phase pattern (see “d”), where the residual direction dependent effect (ripple) is due to mutual coupling. The minimization process is then applied to all antennas composing the LBA-inner array. The result is summarized in Fig. 3, showing the distribution of the standard deviations of phase patterns (in E- and H-plane) before and after the minimization procedure. The effectiveness of the process is nicely illustrated by the reduction in the phase pattern deformations.
Finally, Figure 4 shows a scatter plot of ∆𝑥 vs. ∆𝑧 and ∆𝑦 vs. ∆𝑧 for the phase centers of all antennas of the array. First of all, a significant difference in the positions of the phase center between E- and H-plane is noted. The ∆𝑥 and ∆𝑦 are distributed within ±0.15 m. As regards the heights from the ground, they are distributed between -0.1 and 0.5 m, with averages of 0.28 and 0.14 m respectively in the E- and H-plane. This is quite below the antenna excitation point, which is approximately 1.7 m from the ground. The black markers in Fig. 4 indicate the phase centers of the isolated antenna, which are located in the z-axis. Similar deviations from the physical positions were found applying RF position estimation using the method proposed in [3].
IV. CONCLUSIONS
The phase centers in the two principal planes have been computed at 32 MHz for every antenna of the LBA-inner array of a LOFAR station. The deviation of the phase center from physical positions varies significantly across the array. Phase referencing reduces the phase pattern standard deviation from the ideal spherical response across the antennas field-of-view considerably (approximately a factor 5).
REFERENCES
[1] W. Kunysz, “Antenna phase center effects and measurements in GNSS ranging applications,” 14th ANTEM/AMEREM, Ottawa, ON, 2010.
[2] P. Bolli, et al., “Near-field Experimental Verification of the EM Models for the LOFAR Radio Telescope,” IEEE Antennas and Wireless Propagation Letters, vol. 17, 4, pp. 613-616, April 2018.
[3] S.J. Wijnholds, P. Bolli, G. Pupillo, G. Virone, “UAV-Aided Calibration for Commissioning of Phased Array Radio Telescopes,” 2016 URSI Asia-Pacific Radio Science Conference (URSI AP-RASC), (Seoul, Korea), pp. 228-231, August 21-25, 2016.
Fig. 3. Standard deviations for the phase patterns at the base of the antenna and in the phase center along E- (top) and H-plane (bottom).
Fig. 4. Scatter plot of the phase center displacements along E- and H-plane. The black markers identify the phase center for the isolated antenna. Fig. 2. Phase patterns at 32 MHz for an embedded LBA (“a”) and for the
isolated LBA (“b”) relative to the antenna base. Embedded patterns at the first-step phase center (“c”) and at the final phase center (“d”).