IDENTIFICATION AND FUNCTIONAL ANALYSIS OF
CODING GENES AND LONG NON-CODING RNAS
INVOLVED IN NEURONAL DEVELOPMENT
U
NIVERSITY
O
F
N
APLES
F
EDERICO
II
P
H
D
I
N
B
IOLOGY
XXXI
C
YCLE
PhD Student Tutor
Dr. Vincenza Aliperti Prof. Aldo Donizetti
Coordinator
Prof. Salvatore Cozzolino
2
INDEX
ABSTRACT (English)... 4 ABSTRACT (Italian) ... 5 ABBREVIATIONS ... 6 1. INTRODUCTION ... 11 1.1 Human Neurodevelopment ... 111.2 Programmed cell death in neurodevelopment ... 13
1.3 Regulatory landscape of human neurodevelopment... 14
1.4 Role of neurotrophins in neuronal development ... 17
1.5 Immediate Early genes in brain ... 19
2. AIM OF THE STUDY ... 21
3. MATERIALS & METHODS ... 23
3.1 Cell cultures... 23
3.2 Cellular treatments ... 23
3.3 RNA isolation, retrotranscription and quantitative PCR (qPCR) analysis ... 24
3.4 Microarray analysis ... 24
3.5 lncRNAs classification and functional analysis ... 25
3.6 Generation of EGR1 and LINC00473 KO cell lines ... 25
3.7 iPSCs ... 26
3.8 Western Blotting ... 26
3.9 EGR1 iper-expression: cloning, transfection and subcellular fractionation protocol ... 27
3.10 Immunofluorescence analysis ... 27
3.11 Statistical analysis ... 28
TABLES ... 29
4. RESULTS ... 31
PART I ... 31
Identification and preliminary characterization of genes involved in Early Response to BDNF Stimulation ... 31
4.I.1 Identification on new players in early response to BDNF stimulation ... 31
PART II ... 40
EGR1 in neuronal differentiation ... 40
4.II.1 EGR1 ... 40
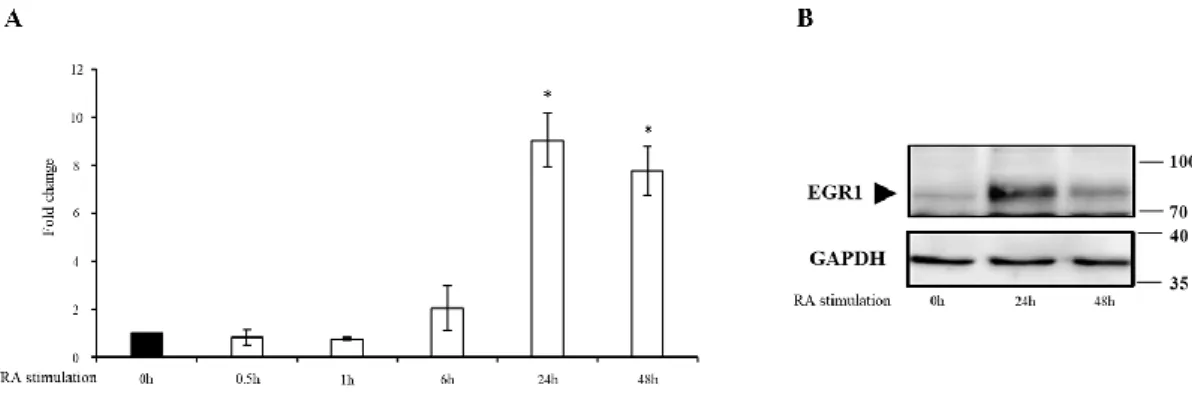
4.II.2 EGR1 expression level during RA-dependent differentiation ... 41
4.II.3 EGR1 knockout cell line generation and validation ... 41
4.II.4 KO cells are unable to properly differentiate under RA stimulation ... 43
4.II.5 Effects of EGR1-KO on the RA pathway ... 44
3
4.II.7 Effect of TPA stimulation on EGR1-KO differentiation ... 46
4.II.8 EGR1 knockout in iPSCs ... 47
4.II.9 Identification of a new alternative splicing isoform for EGR1 ... 48
PART III ... 52
Preliminary characterization of LINC00473 (C6orf176) ... 52
4.III.1 LINC00473 overview ... 52
4.III.2 LINC00473 expression levels under RA and BDNF stimulation ... 53
4.III.3 LINC00473 expression levels under FBS stimulation ... 54
4.III.4 LINC00473 KO ... 55
5. DISCUSSION ... 58
4
ABSTRACT (English)
Neuronal differentiation is a complex process characterized by different cellular events. It is finely regulated by numerous transcription factors, many of which have been identified while others remain unknown. Recently, long non-coding RNAs (lncRNAs) have emerged as key regulators of gene expression, with an essential role in cell differentiation. Therefore, the identification and characterization of these transcripts and the functional relationships between mRNA and lncRNA are fundamental to the understanding the complex transcriptional processes underlying gene regulation. In this regard, an essential molecule for neuronal development, the neurotrophin BDNF (Brain-Derived Neurotrophic Factor), is known for its action in post-transcriptional regulation, while little is known about the transcriptional programs it triggers and through which it influences the development and survival of neurons. The results presented in this thesis concerns the identification of several Immediate Early Genes (IEGs), belonging to both coding and non-coding that, engaged by BDNF, can play a fundamental role in the biology of this neurotrophin. Among coding genes, the involvement of the transcription factor EGR1 (Early growth response protein 1) in neuronal differentiation was investigated. Taking advantage of genome editing techniques (CRISPR-Cas9) and the SH-SY5Y cell line as a human neuronal model, I showed that the knockout cells for EGR1 are unable to differentiate, underlining an essential role of the transcriptional programs regulated by EGR1 in the survival of neurons. Furthermore, I identified a new alternative splicing isoform for EGR1 likely involved in neuronal differentiation. The preliminary results suggested that this isoform may act as a dominant negative of the canonical isoform, contributing to a fine regulation of its effect on transcriptional regulation. In the final part of my thesis, I focused my efforts on a primary characterization of the most differentially expressed lncRNA under BFNF stimulation, the LINC00473 gene. I provided evidence that this gene may encode for a little protein highly conserved in primate species. Functional analysis by the use of a KO cell line generated by CRISPR/Cas9 showed that the putative protein affected the transcript level of the IEGs with a relevant impact on the regulation of gene expression.
5
ABSTRACT (Italian)
Il differenziamento neuronale è un processo complesso caratterizzato da diversi eventi cellulari. È finemente regolato da numerosi fattori trascrizionali, molti dei quali sono stati identificati, mentre altri restano ancora sconosciuti. Recentemente, i long non-coding RNAs (lncRNAs) sono emersi come regolatori chiave dell’espressione genica, con un ruolo essenziale nel differenziamento cellulare. Pertanto, l’identificazione e la caratterizzazione di tali trascritti e delle relazioni funzionali tra mRNA e lncRNA, risultano fondamentali per la comprensione dei complessi processi trascrizionali alla base della regolazione genica. A tal proposito, una molecola essenziale per lo sviluppo neuronale, la neurotrofina BDNF (Brain-Derived Neurotrophic Factor) è nota per la sua azione mediante la regolazione post-trascrizionale, mentre poco si conosce sui programmi trascrizionali che innesca e tramite i quali influenza lo sviluppo e la sopravvivenza dei neuroni. Il presente lavoro di tesi ha permesso di individuare una serie di Immediate Early Genes (IEGs), sia codificanti che non codificanti, che, ingaggiati da BDNF, possono avere un ruolo fondamentale nella biologia di tale neurotrofina. Tra i codificanti, l’attenzione si è focalizzata sul fattore di trascrizione EGR1 (Early growth response protein 1), il cui ruolo è particolarmente documentato nell’adulto. Grazie alle tecniche di genome editing basate sul CRISPR-Cas9 ed alla linea cellulare SH-SY5Y, è stato possibile dimostrare una funzione chiave di EGR1 nello sviluppo dei neuroni. Le cellule knockout per tale fattore di trascrizione sono infatti risultate incapaci di differenziare, sottolineando un’importante influenza dei programmi trascrizionali regolati da EGR1 nella sopravvivenza dei neuroni. Inoltre, gli studi riportati nel presente lavoro di tesi hanno permesso di identificare un’isoforma di splicing alternativo inedita per EGR1. I risultati preliminari ottenuti fanno ipotizzare che tale isoforma possa agire come dominante negativo dell’isoforma canonica concorrendo ad una fine regolazione della funzione di EGR1. Un altro gene su cui il presente lavoro di tesi si è concentrato è invece appartenente a quelli codificanti per i lncRNA, noto come LINC00473. Le analisi hanno permesso di ipotizzare che tale gene possa avere una rilevante funzione nello sviluppo e funzionamento dei neuroni. In particolare, è stato interessante osservare che probabilmente tale gene codifica per una piccola proteina primate-specifica il cui ruolo può influenzare l’espressione di altri IEGs con un impatto rilevante sulla regolazione dell’espressione genica.
6
ABBREVIATIONS
AD Alzheimer disease
AKT Serine-Threonine Protein Kinase
APAF-1 Apoptotic Peptidase Activating Factor 1
ARC Activity Regulated Cytoskeleton Associated Protein
ATF3 Activating Transcription Factor 3
BACE1 Beta-secretase 1
BACE1-AS Beta-secretase 1 Antisense
BAX BCL2 Associated X, Apoptosis Regulator
BCL-2 B-cell lymphoma 2
BDNF Brain-derived neurotrophic factor
BID BH3 Interacting Domain Death Agonist
BSA bovine serum albumin
cAMP cyclic adenosine monophosphate ceRNA Competitive endogenous RNA
C-FOS Fos Proto-Oncogene C
CLIP cross-linking immunoprecipitation CNS Central Nervous System
CPAT Coding Potential Assessment Tool
CRISPR/Cas9 Clustered Regularly Interspaced Short Palindromic Repeats
CYP26a1 Cytochrome P450 Family 26 Subfamily A Member 1
DAPI 4′, 6-diamidino-2-phenylindole
DAVID Functional Annotation Bioinformatics Microarray Analysis DIABLO Diablo IAP-Binding Mitochondrial Protein
DMEM Dulbecco’s modified Eagle’s medium DMSO Dimethyl sulfoxide
DTT Dithiothreitol
DUSP5 Dual Specificity Phosphatase 5
ECL Enhanced ChemiLuminescence
7 EGR1 Early Growth Response 1
EGR2 Early Growth Response 2
EGR3 Early Growth Response 3
EGR4 Early Growth Response 4
EGTA Ethylene Glycol Tetraacetic Acid EMT Epithelial-mesenchymal transition EP2 E-type prostanoid receptor 2 EP4 E-type prostanoid receptor 4
ERK Extracellular signal–regulated kinase
F3 Coagulation Factor III, Tissue Factor
FAM46A Terminal Nucleotidyltransferase 5A FBS Fetal Bovine Serum
GAPDH Glyceraldehyde-3-Phosphate Dehydrogenase
GDNF Glial Cell Derived Neurotrophic Factor
GREAT Genomic Regions Enrichment of Annotations Tool GO Gene ontology
gDNA genomic DNA
gRNA RNA guide
HAND2-AS Heart And Neural Crest Derivatives Expressed 2 Antisense HD Huntington disease
H1FX H1 Histone Family Member X
HOMER1a Homer Scaffold Protein 1a
HOXD Homeobox D
HPRT1 Hypoxanthine Phosphoribosyl Transferase 1
IAPs Apoptosis inhibitors
IEG Immediate-early gene
IGF2BP1 Insulin Like Growth Factor 2 MRNA Binding Protein 1
IGF2BP2 Insulin Like Growth Factor 2 MRNA Binding Protein 2 IGF2BP3 Insulin Like Growth Factor 2 MRNA Binding Protein 3 IGFBP7 Insulin Like Growth Factor Binding Protein 7
8 iPSCs Induced pluripotent stem cells
KCl potassium chloride KLF10 Kruppel Like Factor 10
KO knockout
lncRNA long non-coding RNA
lncRNome long noncoding RNA knowledgebase
LTD long-term depression LTP Long term potentiation
MALAT1 Metastasis Associated Lung Adenocarcinoma Transcript 1 MAPK Mitogen-activated protein kinase
MAP3K14 Mitogen-Activated Protein Kinase Kinase Kinase 14 MgCl2 magnesium chloride
MIAT Myocardial infarction associated transcript
miRNA microRNA
NaCl sodium chloride ncRNA non-coding RNA
NEUROD1 Neuronal Differentiation 1
NGF Nerve growth factor
NGFR Nerve growth factor receptor
NPAS4 Neuronal PAS Domain Protein 4
NR4A1 Nuclear Receptor Subfamily 4 Group A Member 1 NR4A3 Nuclear Receptor Subfamily 4 Group A Member 3 NRAGE Neurotrophin receptor-interacting MAGE homologue
NRIF Neurotrophin receptor interacting factor
NT-3 Neurotrophin-3
NT-4 Neurotrophin-4
NTRK Neurotrophic tropomyosin receptor kinase
PCD Programmed cell death
PBS Phosphate-buffered saline
PCR Polymerase Chain Reaction
9 PFA paraformaldehyde
PI3K Phosphatidylinositol-3- kinase
PKA Protein kinase A PKC Protein kinase C
PLC Phospholipase C
PTB Polypyrimidine tract-binding protein PUM2 Pumilio RNA Binding Family Member 2 QKI KH Domain Containing RNA Binding RA Retinoic acid
RAD51 RAD51 Recombinase
RARα Retinoic Acid Receptor Alpha RARβ Retinoic Acid Receptor Beta RARγ Retinoic Acid Receptor Gamma RBP Retinol-binding protein
RHOA Ras Homolog Family Member A
RHOB Ras Homolog Family Member B
RHOF Ras Homolog Family Member F, Filopodia Associated RIPA Radioimmunoprecipitation assay buffer
RPL19 Ribosomal Protein L19 RT Room temperature
SB StemMACS basal medium
SC-1 SPARC-like protein 1
SDS Sodium Dodecyl Sulphate
SEM mean standard error SH-2 Src-Homology-2
SIK1 Salt Inducible Kinase 1 siRNA small interfering RNA
SOX2 SRY-Box 2
SOX9 SRY-Box 9 SYBU Syntabulin
10 TNRC6A Trinucleotide Repeat Containing 6A
TNRC6C Trinucleotide Repeat Containing 6C TPA 12-O-tetradecanoyl-phorbol-13-acetate
TRAF6 TNF Receptor Associated Factor 6
Tris-HCl TRIS hydrochloride WDR1 WD Repeat Domain 1 WT wild type
11
1. INTRODUCTION
1.1 Human Neurodevelopment
The CNS is probably the most complex of all the biological systems. The mature brain is made up of over 100 billion neurons that represent the information processing cells that can vary in their size, shape and function (Pakkenberg and Gundersen, 1997). Basically, neurons have a cell body (called the soma) and various processes that include dendrites, branching processes that extend only for a short distance away from the neuron cell body, and an axon, a separate process that is typically longer than the dendrites (Figure 1). To support the general function of the nervous system, neurons have evolved special abilities for sending electrical signals along axons. These are wrapped in a fatty substance called myelin that makes the transmission of electrochemical signals between regions efficient (Figure 1; Stiles and Jernigan, 2010). The communication between neurons is achieved at synapses by the process of neurotransmission.
Fig 1. Schematic drawing of a neuron (Stiles and Jernigan, 2010).
During embryogenesis and adulthood, the development of nervous system is a complex and dynamic process that involves a precisely orchestrated sequence of genetic, epigenetic, environmental, biochemical and physical events. The differentiation of neural progenitor cells that will form nervous system requires complex cascades of molecular signals and the fine regulation of gene expression networks. Neural progenitors are self-renewing cells able to divide and increase their number. During embryogenesis, after several replication cycles, the number of cells increases until the cell division switches from symmetric to asymmetric. In this new phase, two different types of cells are produced: a neural progenitor cell, which continues to proliferate (self-renewal), and a neuron, which no longer proliferates. In the early stages of development, neurons undergo to a migration process referred to as somal translocation (Figure 2 A) (Nadarajah and Parnavelas, 2002; Stiles and Jernigan, 2010). As development proceeds, the brain becomes
12 larger and the primary mode of neuronal migration changes. Because of the greater distances, neurons require a special population of cells called “radial glial guides” to support their migration (Figure 2 B) (Rakic, 1972; Stiles and Jernigan, 2010). Although the radial glial guides were originally thought to be a special, transient population of cells, it has recently been discovered that they are neural progenitor cells (Noctor et al. 2001; Noctor et al. 2002; Parnavelas et al. 2002; Weissman et al. 2003; Stiles and Jernigan, 2010). Very recent studies have identified a second proliferative zone that will later develop into the basal ganglia. These neurons traverse long distances using a mode of migration that has been termed “tangential migration” (Figure 2 C). Tangential migration involves a variety of signalling pathways not seen in radial migration (Marin and Rubenstein 2001; Huang, 2009; Stiles and Jernigan, 2010; Valiente and Marin 2010).
Fig 2. Different modes of neuronal migration. (A) Neuron migration by somal translocation: neuron
extends a long basal process, which is an extension of the cell body and attaches itself to the pial surface, the outer surface of the developing brain. The nuclei of cells then move through the cytoplasm of the basal process. (B) Neuron migration radial glial guide: guides extend a basal process that attaches to the pial surface of the brain which forms a kind of scaffold along which neurons can migrate. Each glial scaffold can support the migration of many neurons. (C) Neuron migration from the second proliferative zone in ganglionic eminences by tangential migration (arrows indicate the direction of migration for different neuron populations). Neurons use several guidance molecules produced in local regions along their migratory route to direct their movement into the cortex. (Stiles and Jernigan, 2010).
The migration of neurons into the developing neocortex leads to the formation of an ordered 6-layer structure (Cooper, 2008; Stiles and Jernigan, 2010). At this point, young neurons must become part of information processing networks. They must, therefore, develop neuronal processes (axons and dendrites) that allow them to communicate with other neurons. Each cell has many dendrites and a single axon that can extend to a certain distance from the cell. Once the axon has reached its target, the connections called synapses are formed with the target cell. Synaptogenesis consists of three phases: the immature synapses are formed between the axons and the dendrites; therefore, the synapses undergo maturation and convert from to silent into an active state; finally, the synaptic number is reduced to the neuronal connections within the circuit (Craige et al., 2006; Budday et al., 2015).
Although the production and migration of neurons are largely prenatal events, proliferation and migration of glial progenitors continue for a long time after birth, and differentiation and
13 maturation of these cells continue during childhood. Neuron-glia interactions are not yet fully defined, but these interactions play an important role in the functional organization of neural circuits during postnatal life. In the postnatal period, neurogenesis continues to a very limited degree; however, new neurons continue to emerge and migrate into the subventricular zone and the dentate gyrus of the hippocampus (Stiles and Jernigan, 2010). These exceptional forms of neurogenesis seem to continue throughout adult life but produce only a small percentage of the neuronal population (Ming and Song, 2011; Kempermann et al., 2018).
1.2 Programmed cell death in neurodevelopment
Programmed cell death (PCD) contributes to the development of the nervous system in an evolutionarily conserved manner. PCD is the basis of the neurotrophic theory, whereby cell death derives from a surplus of neurons (Yamaguchi and Miura, 2015). Much of the PCD occurs through apoptosis, a well-characterized genetic program that exhibits specific morphological characteristics such as membrane blebbing, nuclear and cytoplasmic withdrawal, condensation of chromatin and DNA fragmentation (Kerr et al., 1972; Yeo and Gautier, 2004; Yamaguchi and Miura, 2015). The components of the cellular apoptotic machinery can be classified into pro-apoptotic regulators, such as BAX, BID, APAF-1, DIABLO and anti-pro-apoptotic regulators, such as BCL-2, BCL-XL, apoptosis inhibitors (IAPs) and caspases, which belong to a family of cysteine proteases that are the key effectors of the process (Yamaguchi and Miura, 2015). The regulation of caspase activities is complex and derives from the interplay between the anti- and pro-apoptotic regulators (Yeo and Gautier, 2004). Executioner caspases, including CASPASE-3/7, are physiologically activated by extrinsic death ligands or intrinsic signals such as DNA damage, survival factor deprivation, ER stress, abnormal ion flow or reactive oxygen overproduction (Figure 3) (Green et al., 2014; Yamaguchi and Miura, 2015).
14
Fig 3. Schematic representation of molecular pathways leading to apoptosis by effector caspase activation (Yamaguchi and Miura, 2015).
Two important processes involve substantial loss of neural elements: naturally occurring cell death, which involves the normal loss of 50% or more of the neurons within a brain region; synaptic exuberance and pruning in which there is a massive excess production of connections followed by the systematic elimination of up to 50% of those connections. Both processes reflect non-pathological events that play an essential role in establishing the complex networks of the developing brain (Stiles and Jernigan, 2010)
. The uptake of neurotrophic substances protects
against the apoptosis cascade (Levi-Montalcini, 1964; Oppenheim, 1989). Neurotrophic factors are produced by target neurons at synaptic sites and are taken up by the afferent neurons that make effective connections with the targets (Huang and Reichardt, 2001). During development, it is thought that neurons compete for neurotrophic resources. According to the neurotrophic hypothesis (Oppenheim, 1989), neurons that establish effective connections are able to obtain more neurotrophic factor and are more likely to survive
.
1.3 Regulatory landscape of human neurodevelopment
Recent genome-wide profiling studies of the developmental transcriptome of the human brain by several groups (Johnson et al., 2009; Somel et al., 2009; Ip et al., 2010; Colantuoni et al., 2011; Kang et al., 2011; Lambert et al., 2011; Mazin et al., 2013; Miller et al., 2014; Pletikos et al., 2014; Jaffe et al., 2015) revealed that the great majority of protein-coding genes (at least 86% according to Kang et al., 2011) and an ever-expanding number of non-coding genes are used at some point in the building of the human CNS. In particular, they evidenced remarkable
15 dynamicity of gene expression during prenatal and early postnatal development, accounting for approximately 2/3 of the variance in global expression. Transcriptional studies also demonstrated correlations between gene expression dynamics and the morphological and functional development of brain regions and, consequently, shed light on the timing of developmental processes and the onset of specific biological functions (Johnson et al., 2009; Kang et al., 2011; Parikshak et al., 2013; Willsey et al., 2013; Miller et al., 2014). For example, gene co-expression network analyses have revealed that the developmental brain transcriptome can be segregated into distinct modules or clusters of genes with highly correlated expression. Many transcriptional processes are shared and coordinated across different regions as the brain develops. In particular, the module enriched for genes associated with the neuronal specification is most highly expressed during the embryonic and early fetal periods, while the module enriched for genes associated with synaptic function and ion channels begins to rise in late fetal period and plateaus in early childhood. Recent approaches have successfully integrated the spatiotemporal dimensions of the human brain transcriptome with gene mutation discoveries to generate testable hypotheses about when and in which regions and/or cell types in the developing human CNS the expression of disease-associated genes converge. It is intriguing to speculate that selective dysfunction of spatially and temporally regulated gene expression may in part explain differences in the age of onset and affected neural circuits in neurological and psychiatric disorders (Silbereis et al., 2016).
As an important layer of gene expression, the epigenetic mechanisms act in concert with trans and cis components of the regulatory circuitry and play a critical role in regulating spatiotemporal gene expression patterns (Maze et al., 2014; Nord et al., 2015; Shibata et al., 2015; Silbereis et al., 2016). These mechanisms, including DNA methylation, histone modifications, and non-coding RNAs, can also be affected by various extrinsic factors, thus providing a molecular link between external cues and gene expression (Silbereis et al., 2016). DNA methylation of cytosine, primarily at CpG nucleotides, plays a key role in neural development and function. DNA methylation levels change rapidly during fetal development but slow down after birth and with aging (Numata et al., 2012; Silbereis et al., 2016). The accumulation of methylation in the non-CpG context (mCH) happens during early postnatal development (first 2 years postpartum) and through adolescence, with a small decrease thereafter. Lister et al. (2013) noted that the accumulation of mCH and gene expression were negatively correlated; genes highly expressed in adult neurons lost both CpG and non-CpG methylation progressively during development (Lister et al., 2013). In addition to DNA methylation, histone modification is an essential mechanism for establishing cellular diversity and regulating the timing of developmental processes (Silbereis et al., 2016). Methylation (mono-, di-, and tri-) and acetylation are the most extensively studied modifications (Tessarz and Kouzarides, 2014). For example, Cheung and colleagues (2010) profiled histone 3 lysine 4 trimethylation (H3K4me3) across development in neuronal and non-neuronal cells of the human prefrontal cortex. They highlighted significant remodelling during
16 postnatal development and the aging of prefrontal neurons. In particular, they observed higher levels of H3K4me3 methylation of NEUROD1 and several members of the cadherin and semaphorin families in newborns compared to older samples. Dysregulation of epigenetic modifications are associated with various human diseases, including neurodevelopmental disorders (Bale et al., 2010; Millan, 2013). In particular, an increasing number of mutations in histone lysine methylation-related genes have been identified as intellectual disability-associated genes (Ronan et al., 2013; Vissers et al., 2016).
The correct gene expression regulation during development requires the intricate interplay between transcription factors, epigenetic modifications, and non-coding RNAs (ncRNAs). The latter represents a large, but poorly characterized component of the human transcriptome. ncRNAs play a critical role in transcriptional and post-transcriptional regulation of gene expression and affect the overall transcriptional landscape and proteomic diversity of a cell (O’Carroll and Schaefer, 2013; Morris and Mattick, 2014; Silbereis et al., 2016). ncRNAs can be classified as short or long RNAs, on the basis on their length. Short microRNAs (miRNAs) are a relatively well-known class of RNA whose mechanism of action has been unravelling. miRNAs bind their mRNA target based on sequence complementary and trigger the degradation or the translation of inhibition of the mRNA (O’Carroll and Schaefer, 2013; Silbereis et al., 2016). Long non-coding RNAs (lncRNAs) represents a relatively newly identified class of RNA. The lncRNAs can act as regulators at different levels: at the transcriptional level by means of chromatin remodeling mechanisms and histone modifications; at the post-transcriptional level through interaction with mRNAs, with consequent modulation of splicing, inhibition of protein synthesis, degradation of mRNAs and formation of endogenous siRNAs; they can interact with other biological molecules, modulating the activity of proteins, their localization and the formation of RNA-protein complexes; finally they can interact with miRNAs (Wilusz et al., 2009; Wu et al., 2013). Recent studies have shown that many miRNAs and lncRNAs are expressed in the human and non-human primate brain and are spatially and temporally regulated (Somel et al., 2011; O’Carroll and Schaefer, 2013; Silbereis et al., 2016). A growing body of evidences emphasizes the role of lncRNAs in neurodevelopment and brain function, and a functional correlation with several neurodevelopmental, neurodegenerative and psychiatric diseases (for instance, see St Laurent and Wahlestedt, 2007; van de Vondervoort et al., 2013; Wu et al., 2013; Barry, 2014; Roberts et al., 2014; Tushir and Akbarian, 2014). For example, MIAT, also termed as Gomafu, exhibits deregulation in multiple diseases, including up-regulation in ischemic stroke and down-regulation in schizophrenia (Sun et al., 2018); BACE1-AS stabilizes the BACE1 transcript, protecting it from RNA degradation through RNA–RNA pairing, and thus contributing to the progression of Alzheimer's (Clark and Blackshaw, 2014).
17
1.4
Role of neurotrophins in neuronal development
Four neurotrophins have been characterized in mammals: nerve growth factor (NGF), brain-derived neurotrophic factor (BDNF), neurotrophin-3 (NT-3) and neurotrophin-4 (NT-4) (Hallbook, 1999). They share sequence homology and structure similarity and evolved from a common ancestral gene (Hallbook, 1999).
Neurotrophins act by binding their cognate NTRK receptors (Trk, tropomyosin-related kinase). NGF is specific for NTRK1; BDNF and NT-4 are specific for NTRK2; NT-3 activates NTRK3 and it is also able to activate less efficiently each of the other NTRK receptors (Figure 4).
Fig 4. Neurotrophins receptors and specific ligands (https://www.sinobiological.com/neurotrophin-receptor-sinobio.html).
Ligand engagement of NTRK receptors has been shown to result in phosphorylation of cytoplasmic tyrosine residues on the cytoplasmic domains of these receptors. Phosphorylation of other tyrosine residues promotes signalling by creating docking sites for adaptive proteins containing phosphotyrosine (PTB) or src-homology-2 (SH-2) binding patterns (Huang and Reichardt, 2001; Pawson and Nash, 2000). These adapter proteins couple NTRK receptors to intracellular signaling cascades, which include the Ras/ERK metabolic pathway (signal extracellular signal-regulated kinase), the phosphatidylinositol-3- kinase (PI-3 kinase) / AKT-kinase and the phospholipase C (PLC) -γ1 (Figure 5) (Reichardt and Fariñas, 1997; Kaplan and Miller, 2000; Huang and Reichardt, 2001).
18
Fig 5. Schematic diagram of NTRK receptor-mediated signal transduction pathways. In this diagram,
adaptor proteins are red, kinase green, small G proteins blue, and transcription factors brown. (Huang and Reichardt, 2001).
Each neurotrophin also binds to the low-affinity p75NTR (NGFR) receptor, which is a member of the tumor necrosis factor receptor superfamily (Frade and Barde, 1999; Huang and Reichardt, 2001). NGFR interacts with proteins, including TRAF6, RhoA, NRAGE (neurotrophin receptor-interacting MAGE homologue), SC-1, and NRIF, and regulates gene expression, cell cycle, and growth cone motility. Binding of neurotrophins to NGFR has also been shown to activate the Jun kinase pathway, which can be inhibited by activation of the NTRK receptors-dependent Ras-phosphatidylinositol-3-kinase (PI3K) pathway by NTRK receptors. Most intriguing, both in vitro and in vivo evidences indicates that ligand engagement of NGFR can directly induce neuronal death via apoptosis (Frade and Barde 1999; Friedman, 2000; Huang and Reichardt, 2001) (Figure 6).
Fig 6. Schematic diagram of p75NTR-mediated signal transduction pathways. In this diagram, adaptor
proteins are red, kinase green, small G proteins blue, and transcription factors brown. (Huang and Reichardt, 2001).
19 Neurotrophins regulate development, maintenance, and function of vertebrate nervous systems (Huang and Reichardt, 2001). They are initially synthesized as precursor proteins (pro-neurotrophins), which are processed intracellularly to be secreted mostly in a mature, biologically active form (Mowla et al., 1999; Mowla et al., 2001; Lu et al., 2005; Matsumoto et al., 2008). During development, neurotrophins stimulate the formation of appropriate synaptic connections, controlling the direction and rate of axon growth (Wang and Poo, 2005; Li et al., 2005), as well as the shape of dendritic arbores and spines (Ji et al., 2005; Melo et al., 2013).
The neurotrophin BDNF plays a central role both in neuronal development and in the adult nervous system, and dysfunction in its signalling may contribute to several neurodegenerative disorders (Pruunsild et al., 2007). BDNF interaction with NTRK2 receptor activates three signaling pathways: PI3K-Akt (PI3K, phosphatidyl inositol-3 kinase), Ras-MAPK (MAPK, mitogen-activated protein kinase), and PLCγ-Ca+ (PLC, phospholipase C) (Duman and Voleti,
2012). It is also known to regulate a large spectrum of processes of the nervous system, including cell survival, growth and differentiation (Casaccia-Bonnefil et al., 1999; Bibel and Barde, 2000; Huang and Reichardt, 2003; Park and Poo, 2013; Suliman et al., 2013; Zagrebelsky and Korte, 2014), synaptic plasticity of neurons and LTP (Xu et al., 2000; Bramham and Messaoudi, 2005; Gottmann et al., 2009; Minichiello, 2009; Mizui et al., 2014; Zagrebelsky and Korte, 2014; Leal et al., 2015). The essential role of BDNF in neuronal processes during development and adulthood, support its potential therapeutic use in the treatment of both neurological and psychiatric disorders (Pruunsild et al., 2007; Nagahara and Tuszynski, 2011; Weissmiller and Wu, 2012). In fact, BDNF exerts potent pro-survival effects in models of neurological diseases such as Parkinson’s (PD) (Howells et al., 2000; van der Kolk et al., 2015), Huntington’s (HD) (Zuccato et al., 2008; Jiang et al., 2013), and Alzheimer’s (AD) diseases (Holsinger et al., 2000; Michalski and Fahnestock, 2003; Peng et al., 2005; Faria et al., 2014), as well as depression and other psychiatric disorders (Karege et al., 2002; Aydemir et al., 2005; Gonul et al., 2005; Cunha et al., 2006).
1.5 Immediate Early genes in brain
Immediate-early genes (IEGs) are genes that are induced rapidly and transiently in response to a wide range of cellular stimuli. They act in many biological processes: regulation growth, differentiation and cell cycle. Because of the wide variety of extrinsic stimuli to which they respond, their mechanism of action can vary depending on the stimulus received, its duration and the type of cell (Bahrami and Drabløs, 2016).
IEGs play a key role in brain development; in particular their expression is selectively and rapidly increased in certain neurons of specific brain regions, associated to the formation of memory and
20 learning (Minatohara et al., 2015). They are also involved in important processes such as neuronal plasticity, which persists even in adulthood and therefore is not limited only to the early stages of development (Pérez-Cadahìa et al., 2011).
Approximately 30-40 neuronal IEGs have been identified; 10-15 are regulators, whose protein products are classified as inducible transcription factors, such as C-FOS and EGR1 (Davis et al., 2003). C-FOS is involved in cell proliferation and differentiation after extracellular stimuli, and its deregulation has been often associated to oncogenic progression (Velazquez et al., 2015). Only 40% of knockout c-Fos mouse embryos survive until birth showing the importance of this gene for development (Velazquez et al., 2015). EGR1 is a transcription factor widely studied in adults, where it plays a clear role in synaptic plasticity (Adams et al., 2017). Several evidences in different cell lines led to hypothesize that EGR1 can play a role in the development of neurons (Milbrandt, 1987; Aliperti and Donizetti 2016). ARC (also knowns as Arg3.1), NPAS4 and HOMER1a (a shorter variant of Homer1) are all induced by neuronal activity and they are therefore considered IEGs (Xiao et al., 1998; Korb and Finkbeiner, 2011; Kim et al., 2018). ARC is not a transcription factor but acts as an effector involved in various neuronal signaling pathways. ARC mRNA is rapidly transcribed in response to neuronal activity, and precisely targeted to activated synapses in neuronal dendrites (Farris et al., 2014; Kim et al., 2018). NPAS4 is a brain-specific transcription factor, which plays a role in the development of inhibitory synapses by regulating the activity-dependent gene programs in cultured neurons (Kim et al., 2018). HOMER1a is primarily located at the postsynaptic density where it competes with other constitutively expressed Homer proteins for the interaction with Homer-binding proteins. As such, HOMER1a negatively regulates excitatory synapse structure and function (Sala et al., 2003; Kim et al., 2018).
Alterations in the expression of IEGs have been associated with various cognitive disorders, such as autism, schizophrenia and dementia (Thiel and Cibelli, 2002).
21
2. AIM OF THE STUDY
The central nervous system (CNS) is a large network of interconnecting and intercommunicating cells that form functional circuits and is responsible for intellectual and cognitive functions. Generation of the CNS occurs during embryonic development from a pool of immature progenitors that will give rise to all the neurons in the brain and spinal cord. During neuronal development transcriptional regulation plays fundamental role in each step of the process from neural fate determination to complete neuronal maturation. At a molecular level, this process is coordinated by transcription factors involved in all the cellular processes, including cell cycle exit, migration, survival, and acquisition of neuronal features, such as dendrites and axon maturation, and functional synapses. Dysfunction of gene expression regulation during critical developing periods lead to neurodevelopmental abnormalities and mental disorders. Despite the progress on the molecular mechanisms controlling neuronal development, a lot remains to be clarified about regulation of gene expression and regulation of transcriptional activity underlying this phenomenon. This is especially true considering that beyond classical transcription factors and miRNA, it is now emerging another recently identified class of molecules, the long non-coding RNA (lncRNA), as a fundamental element of gene expression regulation underlying neuronal development.
Each stage of neuronal maturation requires an integration of cell-intrinsic genetic programs and the extrinsic influences such as the effects of neurotrophic factors. Among neurotrophins, BDNF has been shown to be essential for the correct development of the brain, playing an important role in numerous cellular processes, such as axon migration, regulation of the size and number of dendritic spines, synaptogenesis and cellular survival.
In an effort to identify long non-coding RNA involved in the BDNF function during neuronal development, we carried out high-throughput experiments reported in the part I of the present thesis. In particular, we focused on those transcriptional events occurring immediately after BDNF stimulus, considering that they play critical roles in long-lasting neuronal changes by regulating a plethora of target genes. We took advantages from the use of a popular human neuroblastoma cell line (SH-SY5Y) as an experimental model of neuronal development.
The results of the part I provided the identification of coding and long non-coding RNA involved in the BDNF biology and thus likely important in the transcriptional programs occurring during neuronal development. In the second part of this thesis, we focused our attention on EGR1, one the coding genes engaged by BDNF. This gene encodes for a transcription factor whose role in the embryogenesis remains elusive. By using the recent and powerful molecular approach for genome editing, the CRISPR/Cas9, we provided preliminary investigation on the role of EGR1 in the human neuronal development.
22 The high-throughput analysis reported in the part I allowed us to identify a lncRNA never associated to neuronal development, the LINC00473. With the aim to provide a characterization of this gene, in the part III of this thesis, we analyzed the evolutionary conservation of the sequence and the expression pattern regulation. In addition, to gain preliminary insights on the molecular mechanism of action, we generated a KO model for the LINC00473 gene.
23
3. MATERIALS & METHODS
3.1 Cell cultures
The human neuroblastoma cell line SH-SY5Y was used as a neuronal cell model. In particular, the N-enriched population of SH-SY5Y was obtained from the parental cell line by a procedure reported elsewhere (Piacentini et al., 1996; Bell et al., 2013; Aliperti and Donizetti 2016). The cells were grown and propagated in Dulbecco’s modified Eagle’s medium (DMEM, Euroclone®),
supplemented with 2mM L-glutamine (Euroclone®), and a solution of 1% penicillin/streptomycin
(Euroclone®) and 15% Fetal Bovine Serum (FBS, Euroclone®).
The HEK293T cell line was grown and propagated in Dulbecco’s modified Eagle’s medium (DMEM, Euroclone®), supplemented with 2mM L-glutamine (Euroclone®), and a solution of 1%
penicillin/streptomycin (Euroclone®) and 10% Fetal Bovine Serum (FBS, Euroclone®).
3.2 Cellular treatments
The N-enriched SH-SY5Y cells were differentiated by incubation in a low serum (1.5%) medium containing RA (retinoic acid, SIGMA–Aldrich®) 10µM. In particular, 8x10⁵ cells were seeded in
35mm plates and starved for 24h by reducing FBS. Then RA was added, and the medium was refreshed every 2 days. Untreated cells were grown in the presence of only dimethyl sulfoxide (DMSO) as vehicle control. After 6 days of differentiation, the medium containing RA was removed and substituted with a medium without FBS and with BDNF 10ng mL-1 (PeproTech®)
for a specific time.
In order to evaluate the effect of RA concentration, WT and EGR1-KO cells were treated with increasing doses of morphogen (3μM, 6μM and 10μM). 5x10⁴ cells were seeded in 24-well plates
and starved for 24h by reducing FBS from 15% to 1.5%. RA was then added to the different concentrations, and the cells were followed up to 6 days with observations under an optical microscope.
For TPA differentiation, 8x10⁵ N-enriched SH-SY5Y WT and EGR1-KO cells were seeded in
35mm plates. The day after, the cells were treated with TPA (16nM) in a medium where the percentage of FBS was reduced from 15% to 1.5%. Untreated cells were grown in the presence of only dimethyl sulfoxide (DMSO). The medium was refreshed every 2 days.
For FBS stimulation, 6x10⁵ HEK293T cells were seeded in 35mm plates and starved for 24h by
reducing FBS from 10% to 1.5%. After 24h of starvation, cells were stimulated with 15% FBS and collected after different time intervals as reported in the Results section.
24
3.3 RNA isolation, retrotranscription and quantitative PCR (qPCR) analysis
For microarray analysis, total cellular RNA was isolated using an RNeasy® Mini Kit (QIAGEN)according to the RNeasy® Mini Handbook (QIAGEN). DNA contamination was efficiently
removed by on-column DNAse digestion (QIAGEN).
For the analysis of transcript levels, total cellular RNA was isolated using TRI-Reagent (SIGMA– Aldrich®) according to the manufacturer’s instructions.
The concentration and purity of the RNA sample were assessed using NanoDrop® 1000 (Thermo
Scientific). cDNA was synthesized from 1μg of total RNA using an Invitrogen SuperScriptIII®
reverse transcriptase kit (Invitrogen). qPCR validation was performed on independent biological replicates in triplicate. Real-time PCR was performed using the SYBR green method and an Applied Biosystems 7500 System. The reaction mixture contained 50ng of cDNA template and 400nM of each forward and reverse primer in a final volume of 15μL. PCR conditions included a denaturation step (95°C for 10min) followed by 40 cycles of amplification and quantification (95°C for 35s, 60°C for 1min). Relative gene expression levels were normalized to the reference gene Hypoxanthine Phosphoribosyl Transferase 1 (HPRT1) for microarray validation, and to the gene Glyceraldehyde-3-Phosphate Dehydrogenase (GAPDH) for the other analyses. It was calculated by the 2 – ΔΔCt method. The sequences of the primers used are reported in Table 1.
3.4 Microarray analysis
Microarray experiments were performed on biological triplicate samples. Total RNA quality was assessed by an Agilent 2100 Bioanalyzer (Agilent Technologies). Microarray hybridizations were performed by the Transcriptomics and Genomics core facility of the Department of Emergency and Organ Transplants (DETO) in the Nephrology Unit at the University of Bari Aldo Moro in Italy. The labeled cRNA was produced using a Low Input Quick Amp Labeling (LIQA) kit (Agilent Technologies) and hybridized for 17 hours at 65°C on an Agilent SurePrint G3 8x60K custom lncRNA expression array (Agilent Technologies). This array contains two probes for 22,001 lncRNAs targeting the Gencode v15 human lncRNA annotation, together with one probe for 17,535 randomly chosen protein-coding transcripts. After hybridization, the slide was washed according to Agilent protocols and scanned using a High-Resolution Microarray C Scanner (Agilent Technologies). The image file was processed using Agilent Feature Extraction software (v10.7.3). The microarray grid was correctly placed, and outlier pixels (which were rejected) and inlier pixels were identified. Normalization was performed according to the Quantile method. The differentially expressed probes were selected using a moderated t-test with a p-value cut-off of 0.05.
25
3.5 lncRNAs classification and functional analysis
The LNCipedia database (http://www.lncipedia.org/) (Volders et al., 2015) was used for retrieving the transcript ID, gene ID, and alternative gene name of the differentially expressed lncRNAs. Differentially expressed lncRNAs were classified by considering their position relative to adjacent protein-coding genes as reported by Mattick and Rinn (2015). The differentially expressed lncRNAs were analysed by CPAT software (http://lilab.research.bcm.edu/cpat/) (Wang et al., 2013) to assess their protein-coding potential. For the functional analysis of the lncRNAs, a list of nearby potentially regulated genes was retrieved using the computational tool GREAT (Genomic Regions Enrichment of Annotations Tool; http://bejerano.stanford.edu/great/public/html/) (McLean et al., 2010). Functional enrichment analysis for the predicted target genes and differentially expressed coding genes was performed using the DAVID system (Database for Annotation, Visualization and Integrated Discovery; http://david.abcc.ncifcrf.gov/) (Dennis et al., 2003), which uses Gene Ontology (GO) to identify the molecular function represented in the gene profile (Dennis et al., 2003). For all DAVID analyses, the significance of enrichment of each GO term was assessed by a p-value of <0.05 and ranked by the number of differentially expressed genes (count). The lncRNAs were analyzed with the lncRNome software (http://genome.igib.res.in/lncRNome) (Bhartiya et al., 2013) to identify possible interactions with proteins. The database contains information about 6,800 binding sites for proteins obtained from PAR-CLIP and CLIP-seq analyses. I obtained a list of potentially regulated miRNAs from lnCeDB (http://gyanxet-beta.com/lncedb/) (Das et al., 2014), a database that provides human lncRNA that can potentially act as competitive endogenous RNAs (ceRNAs) and interfere with the pathway of miRNAs. These miRNAs were analyzed by miR2Disease (http://www.mir2disease.org/) (Jiang et al., 2009) to find miRNAs deregulated in human diseases. The potentially regulated miRNAs were also analyzed by miRTarBase (http://mirtarbase.mbc.nctu.edu.tw/) (Chou et al., 2018) to find their experimentally validated mRNA targets.
3.6 Generation of EGR1 and LINC00473 KO cell lines
The knockouts for the EGR1 gene in an N-enriched SH-SY5Y cell line and the LINC00473 gene in the HEK293T cell line were obtained using the CRISPR/Cas9 procedure as reported by Ran et al. (2013). Briefly, forward and reverse oligonucleotides (Table 2) for the gRNA were designed from the online CRISPR design tool (http://crispr.mit.edu/) and inserted in the all-in-one vector pSpCas9(BB)-2A-Puro (PX459) V2.0 (Addgene plasmid #62988) for EGR1 knockout and in the all-in-one vector AIO-PURO (Addgene plasmid #74630) for the LINC00473 gene. The first strategy was designed to obtain an INDEL mutation in the ORF; the second strategy was based on the use of an all-in-one vector with the Cas9 Nickase and two gRNAs in order to remove a
26 wider region, avoiding off-targets. Subsequently, the vectors were transfected into the cells using Lipofectamine 2000 (Thermo Fisher Scientific) according to the manufacturer’s instructions. After 24h of transfection, the cells were cultured under a puromycin selection (1µg mL-1) for 48h.
The surviving cells were left to propagate in the plate and then transferred into a 96-well plate for single clone selection by serial dilution. The monoclonal population carrying EGR1 and
LINC00473 mutated sequences was selected by sequence analysis of genomic region of interest.
The genomic DNA was isolated by Quick-gDNATM Miniprep kit (ZYMO RESEARCH) and the
region of interest was amplified using specific primers pair (Table 2). The PCR products were then subcloned in the pGEM®-T Easy Vector (Promega) and several independent clones were subjected to Sanger sequencing.
3.7 iPSCs
iPSCs were grown and propagated under feeder-free conditions in StemMACSTM IPS-Brew XF
Basal medium (SB, MACS® Media), supplemented with StemMACSTM IPS-Brew XF 50X supplement (MACS® Media). The medium was changed every day.
Cells were transfected with all-in-one vector pSpCas9(BB)-2A-Puro (PX459) V2.0 (Addgene plasmid #62988) containing the validated EGR1 gRNA. AmaxaTM Human Stem Cell
NucleofectorTM Kit 1 (LONZA) was used for transfection according to the manufacturer’s
instructions. After 48h of transfection, the cells were cultured under a puromycin selection (0.5µg mL-1) for 48h. Finally, single clones were picked and transferred in a 48-well plate. The genomic
DNA was isolated using QIAamp DNA Blood Mini kit (QIAGEN) and the region of interest was amplified by using specific primers pairs (Table 2). The PCR products were sequenced to check the generation of mutation.
3.8 Western Blotting
N-enriched SH-SY5Y WT and EGR1-KO cell pellets were lysed in RIPA buffer (50mM Tris-HCl pH 8.8, 150mM NaCl, 1mM EDTA, 0.1% SDS, 1% Triton X-100) containing protease inhibitors (Roche), incubated on ice for 30min and centrifuged at 14000rpm for 10min at 4°C. The supernatant was collected and used for protein quantification by Bradford assay (BIO-RAD). 30μg of protein lysate for each sample was electrophoresed in SDS gel (10% acrylamide) and blotted on to a nitrocellulose membrane. The transferred membranes were blocked with 3% non-fat milk (BIO-RAD) in TBST buffer (100mM Tris-HCl pH 8, 1.5M NaCl, 1% Tween) for 1h at room temperature (RT) and incubated with specific primary antibodies in TBST with 3% non-fat milk (BIO-RAD) overnight at 4°C. After several washes with TBST, the membranes were incubated with the corresponding secondary antibodies in the same buffer. After several washes,
27 immunoreactive bands were visualized using ECL detection kit (Euroclone®) according to the
manufacturer’s instructions. Primary and secondary antibodies are listed in Table 3.
3.9 EGR1 iper-expression experiments: cloning, transfection and subcellular
fractionation protocol
The CDS of the EGR1alternative isoform (EGR1 Δ141-278) was amplified by PCR using cDNA samples obtained by RNA extracted from N-type SH-SY5Y cells treated with RA for 6 days as a template. The reaction mixture contained 50ng of cDNA template and 400nM of each forward and reverse primer spanning from the start codon to the stop codon, in a final volume of 20μL. The PCR conditions included a denaturation step (95°C for 2min) followed by 38 cycles of denaturation, annealing and elongation (95°C for 30s, 60°C for 40s and 68°C for 1min). The PCR product was isolated and cloned into pCMV3 expression vector by using restriction enzymes KpnI and XbaI.
The pCMV6-EGR1 vector (SC128132, ORIGENE) and the pCMV3 with CDS of the alternative isoform of EGR1 were used for iper-expression experiments. Both expression vectors were transfected in HEK293T cells using Lipofectamine 3000 (Thermo Fisher Scientific) according to the manufacturer’s instructions. After 24h of transfection, cell pellets were lysed in a fractionation buffer (20mM HEPES pH 7.4, 10mM KCl, 2mM MgCl2, 1mM EDTA, 1mM EGTA, 1mM DTT)
containing protease inhibitors (Roche), incubated on ice for 20min, and centrifuged at 3000rpm for 5min at 4°C. The pellet contained nuclei and the supernatant contained cytoplasm proteins. Supernatant containing cytoplasmic proteins was transferred into a fresh tube, while the pellet of nuclei was washed with fractionation buffer and centrifuged at 3000rpm for 10min at 4°C. Finally, the pellet of nuclei was suspended in TBS buffer (100mM Tris-HCl pH 8, 1.5M NaCl) with 0.1% SDS and sonicated.
3.10 Immunofluorescence analysis
HEK293T cells were grown on coverslips, fixed in 4% paraformaldehyde (PFA), permeabilized in 0.3% PBS-Triton X-100 for 20min at RT, and then blocked in 3% PBS-BSA for 30min at RT. Cells were subsequently incubated with primary antibodies for 1.5h at RT in 3% PBS-BSA and then rinsed with PBS 1X. Specific secondary antibodies conjugated with fluorophores were used for 1h at RT in 3% PBS-BSA. Finally, the cells were washed in PBS 1X. Nuclei were stained with DAPI and coverslips were mounted using glycerol 50% in PBS 1X. Primary and secondary antibodies are listed in Table 4.
28
3.11 Statistical analysis
The results from independent biological replicates in triplicate are expressed as mean ± SEM. Statistical analysis of the qPCR data was carried out using a two-tailed t test (Prism 6 software) with a p-value cut-off of 0.05.
29
TABLES
Table 1. Sequences of primers used for qPCR analysis.
Gene symbol
Ensemble code
Primer sequence
HPRT1 ENSG00000165704 F_5’- CGGGGACTTTGGGATGTC -3’R_5’- CGCTTTCCGTCGTGAATTTC -3’ GAPDH ENSG00000111640 F_5’- CGGGGACTTTGGGATGTC -3’
R_5’- CGCTTTCCGTCGTGAATTTC -3’ NTRK2 ENSG00000148053 F_5’- CGGGGACTTTGGGATGTC -3’
R_5’- CGCTTTCCGTCGTGAATTTC -3’ ARC ENSG00000198576 F_5’- GAGTCCTCAAATCCGGCTGA -3’
R_5’- GCACAGCAGCAAAGACTTT -3’ SIK1 ENSG00000142178 F_5’- AAGACCGAGAACCTCCTGCT -3’
R_5’- GTGGACAGAGGCTCTCCTGA -3’ NR4A1 ENSG00000123358 F_5’- CACAGCTTGCTTGTCGATGT -3’
R_5’- GGTTCTGCAGCTCCTCCAC -3’ ATF3 ENSG00000162772 F_5’- ATCACAAAAGCCGAGGTAGC -3’
R_5’- TCCTTCTTCTTGTTTCGGCAC -3’ EGR1 ENSG00000120738 F_5’- GAGCAGCCCTACGAGCAC -3’
R_5’- GGCCACAAGGTGTTGCCA -3’ NR4A3 ENSG00000119508 F_5’- TTTGGAGCTGTTTGTCCTCA -3’
R_5’- CACTCCCCAAATCCACGAAG -3’ RHOB ENSG00000143878 F_5’- TTCGAGAACTATGTGGCCGA -3’
R_5’- GCACATGAGAATGACGTCGG -3’ SYBU ENSG00000147642 F_5’- AGAGCAGAGAGTTCAACCCC -3’ R_5’- AGCATCTGAGGGTGTCTTCA -3’ LINC00473-202 ENST00000455853 F_5’- GTCAGCATACTTTGGCGGAC -3’
R_5’- GTTGGTGCACGTGGGAGT -3’ RP11-182L21.2 ENST00000431300 F_5’- CACTTTGAGGTTCCCACTGC -3’
R_5’- TTGATGGCAGGGAGACGC -3’ LINC01089 ENST00000545885 F_5’- AGCAGAACGTGAGGGTGTAA -3’
R_5’- AGAGTCAAACTAGGCCTGCC -3’ HAND2-AS ENST00000505032 F_5’- TACGAAGACCTTGGGCGATT -3’
R_5’- GCGTTTAATGGTTCCCCTCC -3’ lnc-NPAS4 ENST00000526186 F_5’- TAGACCACCTGAGGATGACC -3’
R_5’- AGAGGGCTGTCAAAGTGTGA -3’ MIAT ENST00000423278 F_5’- CATGTGGTTCCAGACACGTT -3’
R_5’- CCTTCTGTCTCCTCTGTCCC -3’ CYP26a1 ENSG00000095596 F_5’- GCAGCCACATCTCTGATCACT -3’
R_5’- TGTTGTCTTGATTGCTCTTGC -3’ RARα ENSG00000131759 F_5’- CGTGTCTCTCTGGACATTGA -3’
R_5’- CCGAAGCCAGCGTTGTGCAT -3’ RARβ ENSG00000077092 F_5’- ATCCGAAAAGCTCACCAGGA -3’ R_5’- CTGAATTTGTCCCAGAGGCC -3’ RARγ ENSG00000172819 F_5’- AGGAATCGCTGCCAGTACTG -3’ R_5’- GCTTTGCTGACCTTGGTGAT -3’ BDNF ENSG00000176697 F_5’- ACACAAAAGAAGGCTGCAGG -3’
R_5’- TGCTATCCATGGTAAGGGCC -3’ NGFR ENSG00000064300 F_5’- GAGCCTGCATGACCAGCA -3’
R_5’- GCAGAGCCGTTGAGAAGC -3’ EGR1 Δ141-278 ENSG00000120738 F_5’- GAGCAGCCCTACGAGCAC -3’ R_5’- GTGCGGCTCTCCAGGGAA -3’
30
Table 2. Sequences of gRNAs and genotyping primers.
Name
Sequence
EGR1 gRNA TOP_5’- CACCGCTGCAGATCTCTGACCCGTT -3’ BOTTOM_5’- AAACAACGGGTCAGAGATCTGCAGC -3’ EGR1 sequencing primers F_5’- CCGACACCAGCTCTCCAG -3’ R_5’- CTGCGGTCAGGTGCTCGTAG -3’ LINC00473-202 gRNA_A TOP_5’- ACCGTGGGGGTGCTTCCTCGTTCC -3’ BOTTOM_5’- AAACGGAACGAGGAAGCACCCCCA -3’ LINC00473-202 gRNA_B TOP_5’- ACCGTGAGTCTACGTGCTATAGCC -3’ BOTTOM_5’- AAACGGCTATAGCACGTAGACTCA -3’ LINC00473-202 sequencing primers F_5’- GAACTGTCGGCTGCGGC -3’ R_5’- TTCTCCAGTTACCACCCACC -3’
Table 3. Primary and secondary antibodies for Western Blot.
Antibody
Dilution
Anti-EGR1 Polyclonal Antibody (Immunobiological Sciences),rabbit (AB-83620)
1:1000
Anti-GAPDH Monoclonal Antibody (Immunological Sciences), mouse (MAB-91903)
1:5000
Donkey Anti-rabbit IgG Secondary Antibody, HRP Conjugate (A120-108P)
1:2000
Goat Anti-mouse IgM Secondary Antibody, HRP Conjugate (BA1075)
1:5000
Table 4. Primary and secondary antibodies for Immunofluorescence.
Antibody
Dilution
Anti-EGR1 Polyclonal Antibody (Boster Bio),rabbit (PA2177)
1:100
Anti-Tubulin beta-III Monoclonal Antibody (Elabscience®),
mouse (E-AB-20095)
1:200
Goat Anti-Rabbit IgG Secondary Antibody, CY5 Conjugate (Bethyl, A120-201C5)
1:500
Sheep Anti-Mouse IgG Secondary Antibody, FITC Conjugate (Bethyl, A90-146F)
31
4. RESULTS
PART I
Identification and preliminary characterization of genes involved in Early
Response to BDNF Stimulation
4.I.1 Identification on new players in early response to BDNF stimulation
The original SH-SY5Y cell line comprises at least two morphologically and biochemically distinct phenotypes: neuroblastic (N-type) and a low proportion of epithelial-like (S-type; Encinas et al., 2000) phenotypes. Taking into account that the expression level of long non-coding RNA is much lower compared to coding RNA, and that even little variation in their amount could have a great functional impact, we decided to work on a more homogenous population by performing an enrichment procedure to isolate the N-subtype cells (see Materials and Methods). To check the efficacy of the enrichment procedure, we analysed the N-type enriched population before and after RA treatment. In fact, during RA treatment, N-type cells undergo morphological changes, while S-type cells do not change their shape and progressively increase their percentage in the population. As shown in Figure 7 (left panel), in their undifferentiated state, N-type cells have small, rounded cell bodies with short neuritic processes, while S-type cells are larger and flatter with a large cytoplasmic/nuclear ratio (Figure 7, left panel). After the enrichment procedure, the N-type cells appeared clearly isolated in the cell plate by microscopy observation of the cell shape (Figure 7, middle panel). The enrichment was better evaluated and confirmed after RA-induced differentiation, when the N-type cells became morphologically more like primary neurons (Figure 7, right panel).Fig 7. N-enrichment procedure for SH-SY5Y cells. Left panel: photomicrograph showing the original
SH-SY5Y population including both N-type and S-type cells; middle panel: photomicrograph showing the N-type-enriched SH-SY5Y population; right panel: photomicrograph showing the morphological changes of the N-type cells after 6 days of RA-induced differentiation.
We sought to unravel the gene expression changes occurring immediately after BDNF stimulation, considering that the genes involved in this initial phase play critical roles in
long-32 lasting neuronal changes during development by regulating many downstream target genes. In particular, we used microarray technology to survey long non-coding RNAs and coding RNAs involved in the BDNF function. With this scope, we preliminary validated our experimental model by assessing the BDNF high-affinity receptor NTRK2 expression level. In fact, it is reported that RA induces the expression of the NTRK2 in SH-SY5Y cells, making them responsive to BDNF (Kaplan et al., 1993; Encinas et al., 2000). The results of the qPCR analysis reported in the Figure 8, showed that the N-enriched population responded to RA stimulation increasing NTRK2 expression with the highest level after 6 days of treatment.
Fig 8. Analysis of NTRK2 mRNA level after RA treatment by qPCR analysis. NTRK2 expression level
in N-enriched SH-SY5Y cells differentiated with RA for 5 and 6 days; time (0d) represented the undifferentiated cells. NTRK2 gene expression level was normalized to the reference transcript (GAPDH) and calculated by the 2 – ΔΔCt method. The sample at time 0d was used as a calibrator. The results from independent biological replicates are expressed as mean of fold change ± SEM. Statistical analysis of the qPCR data was carried out using a two‐tailed t test. Significance of difference from time 0d (*p < 0.05) is shown. (d): days of RA treatment.
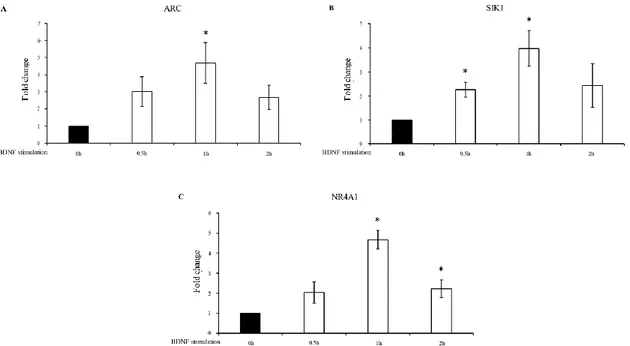
Based on the qPCR results, we decided to perform the BDNF stimulation after 6 days of RA treatment. In order to identify the most appropriate time point for the immediate early response to BDNF treatment, we carried out a preliminary investigation of the expression pattern of three immediate early genes downstream of BDNF signalling ARC (Activity-Regulated Cytoskeleton-Associated Protein), SIK1 (Salt-Inducible Kinase 1) and NR4A1 (Nuclear Receptor Subfamily 4). The expression of all three analyzed genes was induced by BDNF, with the transcript level change showing a peak after 1h of the neurotrophin treatment (Figure 9).
33
Fig 9. Expression analysis for 3 immediate early genes after BDNF stimulation. Expression level
change in N-enriched SH-SY5Y cells after BDNF stimulation at the indicated time points for ARC (A),
SIK1 (B), and NR4A1 (C). Time (0h) represented cells after 6 days of RA-induced differentiation. Gene
expression level was normalized to the reference gene (GAPDH) and calculated by the 2 – ΔΔCt method. The sample at time 0h was used as a calibrator. The results from independent biological replicates are expressed as mean of fold change ± SEM. Statistical analysis of the qPCR data was carried out using a two‐tailed t test. Significance of difference from time 0h (*p < 0.05) is shown.
In light of these results, we carried out a microarray analysis on RNAs extracted after 1h of BDNF treatment. The array used for the analysis is characterized by probes designed on GENCODE v15 lncRNA annotation. This platform enables the analysis of gene expression changes for a total of 22,001 lncRNAs and 17,535 genes encoding proteins. I found that many lncRNAs and coding genes significantly (p-value < 0.05) changed their transcript level after 1h of BDNF treatment. A fold change of > 1.5 was found in 41 lncRNAs (25 up and 17 down regulated) and 40 mRNAs (31 up and 9 down regulated) (Table 5).
Transcript
number
differentially expressed
FC ≥ 1.5
lncRNA 22,001 155 41 mRNA 17,535 238 40
Table 5. Summary of microarray analysis.
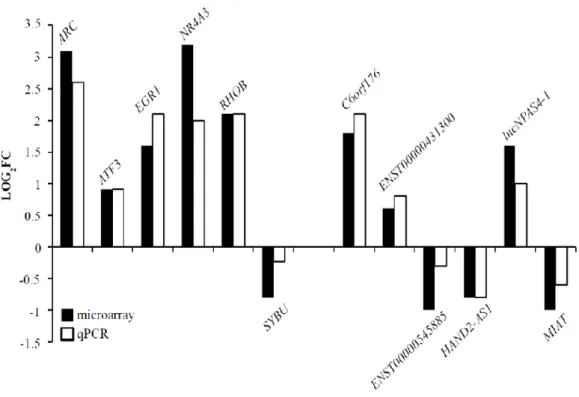
A panel of both differentially expressed lncRNAs and mRNAs with fold change above 1.5 was validated by qPCR (Figure 10).
34
Fig 10. qPCR validation of some differentially expressed mRNA and lncRNAs (Aliperti and Donizetti, 2016).
The differentially expressed lncRNAs were classified in accordance with the definition reported in the Materials and Methods section. Most differentially expressed lncRNAs were included in the intergenic and antisense classes (Table 6).
Class
Number
Intergenic 19
Antisense 13
Overlapping 9
Bidirectional 1
Table 6. Summary of lncRNAs classification.
It is interesting to note that the vast majority of top regulated coding transcripts with fold changes above 2 are classical immediate early genes (IEGs); many of these genes are involved in different biological processes in response to various neural stimuli, such as NR4A3, ARC, EGR1 and DUSP5 (Table 7). Notably, two of the top regulated lncRNAs (C6orf176 and MIAT) have also been shown to have an expression pattern that resembles the kinetics of immediate early response genes (Reitmair et al., 2012; Barry et al. 2014).
35
coding
regulation
FC
lncRNA
regulation FC
NR4A3 up 9.2 C6orf176 up 3.8
ARC up 8.3 lnc-NPAS4-1 up 3.1
RHOB up 4.3 lnc-WDR1-1 up 2.8
FAM46A up 3.6 IGFBP7-AS1 up 2.1
EGR1 up 3.0 lnc-ZSCAN10-4 up 2.1
DUSP5 up 3.0 MIAT-003 down 2.1
KLF10 up 2.3 MIAT-001 down 2.0
MAP3K14 up 2.0 lnc-RHOF-1 down 2.0
F3 up 2.0
Table 7. Top regulated coding and long non-coding transcripts with fold change above2.
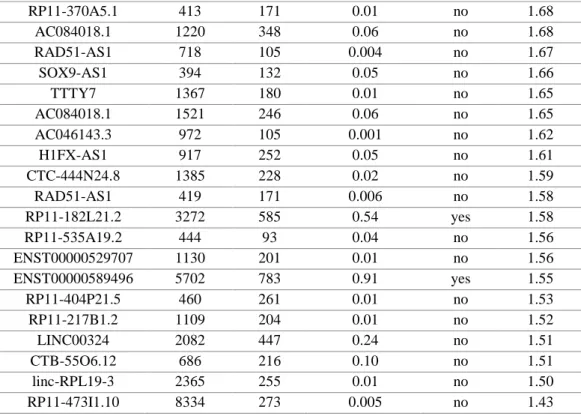
lncRNAs belong to a relatively recent class of RNA, and many important features regarding their origin and role remain largely unexplored. One of the most interesting debate is over the possibility that some lncRNAs encode for evolutionary new peptides/proteins. In this regard, we submitted the 41 differentially expressed lncRNAs to the analysis of CPAT software (http://lilab.research.bcm.edu/cpat/) (Wang et al., 2013) to assess their protein-coding potential (Table 8). We found that 38lncRNAs have a coding probability value below the cut off (0.364), while the remaining 3 lncRNAs have a coding probability value above the cut off. Among these three transcripts, C6orf176 had the highest fold change in our microarray analysis.
Alternative gene name
RNA size ORF
size Coding Probability Coding Label FC (Abs) C6ORF176 1822 561 0.47 yes 3.40 RP11-867G23.10 637 123 0.006 no 3.11 RP11-448G15.3 3510 297 0.03 no 2.76 MIAT 9942 309 0.01 no 2.09 IGFBP7-AS1 1389 168 0.0001 no 2.09 RP11-473M20.16 748 120 0.003 no 2.07 MIAT 10215 300 0.02 no 2.03 AC084018.1 559 144 0.002 no 2.00 AC093673.5 648 78 0.03 no 1.95 AC084018.1 875 270 0.04 no 1.93 RP11-471J12.1 514 186 0.02 no 1.92 RP11-466F5.8 2149 159 0.03 no 1.87 MIAT 10142 300 0.02 no 1.84 HOXD-AS1 609 171 0.01 no 1.81 MIAT 10068 309 0.01 no 1.75 RP4-564F22.5 2004 363 0.01 no 1.74 MALAT1 480 120 0.007 no 1.73 NR_026991.1 2193 294 0.16 no 1.73 AC002310.7 1488 324 0.31 no 1.72 MALAT1 1519 141 0.002 no 1.71 AC084018.1 479 171 0.08 no 1.70
36
Table 8. Results of CPAT analysis (Aliperti and Donizetti, 2016).
Five lncRNAs with a fold change above 1.5 were hypothesized to play a role in physiological and pathological processes in neuronal cells and/or as a regulators of gene expression (Table 9).
Gene
symbol
Regulation
Function
MALAT1(Neat2)
downn Control of the expression of genes involved in synapse function (Bernard et al., 2010). Down-regulation led to cell arrest in the G1/S or G2/M phase (Yang et al., 2013).
MIAT (Gomafu)
down Down-regulated in response to neuronal activation and involved in schizophrenia-associated alternative splicing (Barry et al., 2014). Decreased in the medial prefrontal complex following fear conditioning and knockdown of promoted stress reactivity and anxiety-like behavior (Spadaro et al., 2015). Neurogenic commitment and neuronal survival, sustained overexpression of Miat promoted neuronal death (Aprea et al. 2013).
HAND2-AS1 (Dein)
down Highly expressed in stage IVS neuroblastoma (Voth et al., 2007). Expression is neuroblastoma is coregulated together with HAND2 (Voth et al., 2009).
C6orf176 (LINC00473)
up A possible regulatory function in response to cAMP signalling (Reitmair et al., 2012).
HOXD-AS1 up It is induced by RA, could be regulated via PI3K/Akt pathway and controls genes involved in RA signaling, angiogenesis and inflammation (Yarmishyn et al., 2014).
Table 9. Differentially expressed lncRNAs that have been identified in literature (Aliperti and Donizetti, 2016). RP11-370A5.1 413 171 0.01 no 1.68 AC084018.1 1220 348 0.06 no 1.68 RAD51-AS1 718 105 0.004 no 1.67 SOX9-AS1 394 132 0.05 no 1.66 TTTY7 1367 180 0.01 no 1.65 AC084018.1 1521 246 0.06 no 1.65 AC046143.3 972 105 0.001 no 1.62 H1FX-AS1 917 252 0.05 no 1.61 CTC-444N24.8 1385 228 0.02 no 1.59 RAD51-AS1 419 171 0.006 no 1.58 RP11-182L21.2 3272 585 0.54 yes 1.58 RP11-535A19.2 444 93 0.04 no 1.56 ENST00000529707 1130 201 0.01 no 1.56 ENST00000589496 5702 783 0.91 yes 1.55 RP11-404P21.5 460 261 0.01 no 1.53 RP11-217B1.2 1109 204 0.01 no 1.52 LINC00324 2082 447 0.24 no 1.51 CTB-55O6.12 686 216 0.10 no 1.51 linc-RPL19-3 2365 255 0.01 no 1.50 RP11-473I1.10 8334 273 0.005 no 1.43