Administration of chitosan-tripolyphosphate-DNA nanoparticles to knockdown
1glutamate dehydrogenase expression impairs transdeamination and gluconeogenesis
2in the liver
34
Carlos Gaspara, Jonás I. Silva-Marreroa, Anna Fàbregasb, Montserrat Miñarrob, Josep R. Ticób, 5
Isabel V. Baanantea and Isidoro Metóna,* 6
7
aSecció de Bioquímica i Biologia Molecular, Departament de Bioquímica i Fisiologia, Facultat de 8
Farmàcia i Ciències de l’Alimentació, Universitat de Barcelona, Barcelona, Spain 9
10
bDepartament de Farmàcia i Tecnologia Farmacèutica, i Fisicoquímica, Facultat de Farmàcia i 11
Ciències de l’Alimentació, Universitat de Barcelona, Barcelona, Spain 12 13 14 15 16 17
*Correspondence: Isidoro Metón, Secció de Bioquímica i Biologia Molecular, Departament de 18
Bioquímica i Fisiologia, Facultat de Farmàcia i Ciències de l’Alimentació, Universitat de 19
Barcelona, Joan XXIII 27-31, 08028 Barcelona, Spain. Tel.: +34 934024521; Fax: +34 934024520; 20
E-mail: [email protected]
21 22
Abstract
23
Glutamate dehydrogenase (GDH) plays a major role in amino acid catabolism. To increase the 24
current knowledge of GDH function, we analysed the effect of GDH silencing on liver intermediary 25
metabolism from gilthead sea bream (Sparus aurata). Sequencing of GDH cDNA from S. aurata 26
revealed high homology with its vertebrate orthologues and allowed us to design short hairpin 27
RNAs (shRNAs) to knockdown GDH expression. Following validation of shRNA-dependent 28
downregulation of S. aurata GDH in vitro, chitosan-tripolyphosphate (TPP) nanoparticles 29
complexed with a plasmid encoding a selected shRNA (pCpG-sh2GDH) were produced to address 30
the effect of GDH silencing on S. aurata liver metabolism. Seventy-two hours following 31
intraperitoneal administration of chitosan-TPP-pCpG-sh2GDH, GDH mRNA levels and 32
immunodetectable protein decreased in the liver, leading to reduced GDH activity in both oxidative 33
and reductive reactions to about 53-55 % of control values. GDH silencing decreased glutamate, 34
glutamine and aspartate aminotransferase activity, while increased oxoglutarate content, 2-35
oxoglutarate dehydrogenase activity and 6-phosphofructo-1-kinase/fructose-1,6-bisphosphatase 36
activity ratio. Our findings show for the first time that GDH silencing reduces transdeamination and 37
gluconeogenesis in the liver, hindering the use of amino acids as gluconeogenic substrates and 38
enabling protein sparing and metabolisation of dietary carbohydrates, which would reduce 39
environmental impact and production costs of aquaculture. 40
41
Keywords: Glutamate dehydrogenase; Chitosan; Nanoparticles; Gene knockdown; Liver; Sparus
42 aurata 43 44 1. Introduction 45
Glutamate dehydrogenase (GDH) plays a major role in amino acid catabolism and ammonia 46
detoxification in the liver and kidneys through the catalysis of reversible oxidative deamination of 47
L-glutamate to form α-ketoglutarate and ammonia using NAD(P)+ as cofactor (Lushchak et al., 48
2008). GDH is a homohexameric enzyme located in the mitocondrial matrix that shows preferential 49
reactivity towards the intramitochondrial NADP(H) pool in both reaction directions in vitro, and a 50
near-equilibrium reaction with the NAD(H) pool. Flux direction of GDH catalysis remains a matter 51
of debate. Nevertheless, the high Km value of ammonia and NAD+/NADH ratio may direct catalysis 52
towards oxidative deamination (Karaca et al., 2011; Treberg et al., 2014). GDH activity is 53
allosterically regulated by a wide array of metabolites in a complex, still not well-understood 54
manner. GTP strongly inhibits GDH, while ADP activates the enzyme activity. GTP binding to 55
GDH is antagonised by phosphate and ADP, but is synergistic with NADH. Leucine and other 56
monocarboxylic acids also activate GDH, while palmitoyl-CoA, diethylstilbestrol and cystein-57
specific ADP-ribosylation inhibit GDH activity (Li et al., 2014; Plaitakis et al., 2017). It was 58
suggested that glucose-dependent intracellular formation of glutamate by GDH might amplify 59
glucose-stimulated insulin secretion in pancreatic β-cells (Göhring and Mulder, 2012; Karaca et al., 60
2011). Involvement of GDH in insulin secretion was emphasised by the fact that loss of allosteric 61
inhibition of GDH disturbs insulin secretion. In this regard, activating mutations of GDH cause the 62
hyperinsulinemia and hyperammonemia syndrome in humans. Indeed, overexpression of GDH in 63
mice increases insulin secretion (Carobbio et al., 2004), whereas GDH inhibition in pancreatic β-64
cells impairs insulin secretion (Carobbio et al., 2009). 65
In fish, the molecular role of GDH remains largely unexplored. Glutamate is primarily 66
deaminated by GDH in the fish liver leading to concomitant production of ammonia, while in 67
mammals most glutamate is transaminated to aspartate (Peres and Oliva-Teles, 2006). The effect of 68
nutritional status on hepatic GDH depends on both species and diet composition. Fasting increases 69
GDH activity and/or mRNA levels in Oncorhynchus mykiss, Protopterus dolloi, Dentex dentex and 70
Danio rerio (Frick et al., 2008; Pérez-Jiménez et al., 2012; Sánchez-Muros et al., 1998; Tian et al., 71
2015). However, starvation did not affect GDH activity in Salmo gairdneri (Tranulis et al., 1991) 72
and decreased GDH expression in Dicentrarchus labrax and Sparus aurata (Gaspar et al., 2018; 73
Pérez-Jiménez et al., 2007). High-protein diets stimulate growth and increase plasma free amino 74
acids, which in turn enhance GDH deamination and ammonia excretion (Bibiano Melo et al., 2006; 75
Borges et al., 2013; Caballero-Solares et al., 2015; Coutinho et al., 2016; Viegas et al., 2015). In S. 76
aurata, dietary supplementation with glutamate increases protein retention by stimulation of hepatic 77
glucose metabolism and down-regulation of GDH mRNA levels and reductive GDH activity 78
(Caballero-Solares et al., 2015), while dietary starch decreases GDH activity (Couto et al., 2008). 79
To better understand the functional role of GDH in the liver, we explored the metabolic effects 80
resulting from administration of chitosan-tripolyphosphate (TPP) nanoparticles complexed with a 81
short hairpin RNA (shRNA)-expression plasmid to knockdown GDH expression in the liver of S. 82
aurata. 83
84
2. Materials and methods
85
2.1. Rearing procedures 86
Gilthead seabream (S. aurata) juveniles obtained from Piscimar (Burriana, Castellón, Spain) 87
were maintained at 20 ºC in 260-L aquaria as described (Fernández et al., 2007). Fish were fed daily 88
40 g/kg body weight (BW) of a diet containing 58.0 % protein, 9.9 % lipids, 15.0 % carbohydrates, 89
15.4 % ash, 1.7 % moisture and 20.1 kJ/g gross energy. Chitosan-TPP nanoparticles were 90
intraperitoneally injected alone or complexed with 10 µg/g BW of sh2GDH or pCpG-91
siRNA-Scramble (control plasmid that expresses a scramble sequence with no homology with 92
known sequences; InvivoGen, San Diego, CA, USA). Seventy-two hours post-treatment, fish were 93
sacrificed by cervical section and the liver was immediately dissected out, frozen in liquid N2 and 94
kept at -80 °C until use. To prevent stress, fish were anesthetised before handling with tricaine 95
methanesulfonate (1:12,500). Experimental procedures involving fish complied with the guidelines 96
of the University of Barcelona’s Animal Welfare Committee and EU Directive 2010/63/EU for 97
animal experiments. 98
99
2.2. Molecular cloning of GDH coding domain sequence from S. aurata 100
The full-coding sequence of S. aurata GDH was isolated with the First Choice RLM-RACE 101
Kit (Thermo Fisher Scientific, Waltham, MA, USA) and primers designed from a partial S. aurata 102
primers CG1307 and CG1308 for 5’-RACE, as well as CG1306 and CG1305 for 3’-RACE (Table 104
1). RACE products were ligated into pGEM-T Easy (Promega, Madison, WI, USA) and sequenced 105
on both strands. The full-coding sequence of S. aurata GDH was amplified from the liver by RT-106
PCR using primer pair CG1333/CG1334 (Table 1), ligated into T Easy to generate pGEM-107
GDH, and fully sequenced. 108
109
2.3. Expression plasmids 110
To generate pcDNA3-GDH, the coding domain sequence of GDH was amplified by PCR 111
using primer pair CG1526/CG1527 and pGEM-GDH as template. The resulting fragment was 112
digested with BamHI and EcoRI and ligated into pcDNA3 (Life Technologies, Carlsbad, CA, USA) 113
previously digested with the same enzymes. To obtain sh1GDH, sh2GDH, pCpG-114
sh3GDH, pCpG-sh4GDH and pCpG-sh5GDH, oligonucleotide pairs CG1531/CG1532, 115
CG1533/CG1534 CG1535/CG1536, CG1537/CG1538 and CG1539/CG1540 (Table 1), 116
respectively, were mixed at a final concentration of 25 µM each, heated a 90 ºC for 5 min and 117
cooled down at room temperature. One hundred ng of double-stranded products were ligated into 118
pCpG-siRNA (InvivoGen, San Diego, CA, USA) previously digested with HindIII and Acc65I. 119
shRNA sequences were designed using siRNA Wizard software (InvivoGen, San Diego, CA, USA). 120
121
2.4. Preparation and characterisation of chitosan-TPP-DNA nanoparticles 122
Chitosan-TPP nanoparticles complexed with pCpG-siRNA-Scramble or pCpG-sh2GDH were 123
prepared following the ionic gelation method as described (González et al., 2016). Three-hundred 124
µg of pCpG-siRNA-Scramble or pCpG-sh2GDH were added to 1.2 ml of 0.84 mg/ml TPP. 125
Thereafter, TPP-DNA solutions were added dropwise to 3 ml of 2 mg/ml low molecular weight 126
chitosan-acetate buffer (1:0.4 chitosan/TPP ratio). Chitosan-TPP-DNA nanoparticles were pelleted, 127
rinsed twice with ultrapure water and resuspended in 2 ml of 2 % w/v mannitol as cryoprotector 128
during lyophilisation. After a freeze–dry cycle at −47 °C, an additional drying step was performed 129
at 25 °C to remove residual water. Chitosan-TPP-DNA nanoparticles were characterised by atomic 130
force microscopy using peak force tapping mode (Multimode 8 AFM attached to a Nanoscope III 131
Electronics, Bruker, USA). Z potential was determined using laser Doppler microelectrophoresis in 132
a Zetasizer NanoZ equipped with DTS1060 capillary cells (Malvern Instruments, Malvern, UK). 133
Chitosan-TPP-DNA nanoparticles were resuspended in 0.9 % NaCl previous administration to S. 134
aurata. 135
136
2.5. Cell culture and transfection 137
HepG2 cells (ATCC HB 8065) were cultured in DMEM supplemented with 2 mM glutamine, 138
110 mg/l sodium pyruvate, 10 % foetal bovine serum, 100 IU/ml penicillin and 100 µg/ml 139
streptomycin. Cells were grown at 37 ºC and 5 % CO2 in 6-well plates. The calcium phosphate 140
coprecipitation method (Graham and van der Eb, 1973) was used for transient transfection of 141
HepG2 cells at 45-50 % confluence with 30-300 ng pcDNA3-GDH, 600 ng of pCpG-siRNA-142
Scramble or GDH-specific shRNA expression constructs, and 300 ng pCMV-β (lacZ) to correct for 143
variations in transfection efficiency. Empty plasmids were added to each transfection to ensure 144
equal DNA amounts. Forty-eight hours post-transfection, the cells were harvested, washed in PBS 145
and lysed to isolate total RNA. β-Galactosidase activity in 20-50 µl of the clear lysate was 146
measured as described (Metón et al., 2006). 147
148
2.6. Quantitative RT-PCR 149
One µg of total RNA isolated from HepG2 cells or S. aurata liver was reverse-transcribed to 150
cDNA using random hexamer primers and Moloney murine leukaemia virus RT (Life technologies, 151
Carsbad, CA, USA) for 1 h at 37 ºC. S. aurata GDH mRNA levels were determined in a Step One 152
containing 0.4 µM of each primer, 10 µl of SYBR Green (Applied Biosystems, Foster City, CA, 154
USA), and 1.6 µl of diluted cDNA. The temperature cycle protocol for amplification was 95 °C for 155
10 min, followed by 40 cycles with 95 °C for 15 s and 62 °C for 1 min. A dissociation curve was 156
run after each experiment to confirm single product amplification. Amplification specificity was 157
confirmed by sequencing. S. aurata GDH mRNA was amplified with primer pair CG1543/CG1544 158
(Table 1). The expression of S. aurata GDH in transfected HepG2 cells was normalised with 159
ribosomal subunit 18s (primer pair MC109/MC110; Table 1) and β-galactosidase (primer pair 160
JDRTCMVBS/JDRTCMVBAS; Table 1). For in vivo experiments, mRNA levels were normalised 161
with S. aurata ribosomal subunit 18s, β-actin and elongation factor 1 α (EF1α) using primer pairs 162
JDRT18S/JDRT18AS, QBACTINF/QBACTINR and AS-EF1Fw/AS-EF1Rv, respectively (Table 163
1). Variations in gene expression were calculated by the standard ΔΔCT method (Pfaffl, 2001). 164
165
2.7. Western blotting analysis 166
Liver extracts were loaded to a 10% SDS-PAGE gel. After electrophoresis, the gel was 167
equilibrated in transfer buffer (25 mM Tris-HCl, 192 mM glycine, 20 % methanol, pH 8.3) and 168
electroeluted onto a polyvinylidene fluoride membrane for 3 hours at 60 V and 4 ºC. After 169
incubation in blocking buffer (non-fat skim milk powder 5 % w/v, 50 mM Tris-base pH 7.5, 100 170
mM NaCl, 0.1 % Tween 20), the membrane was exposed to rabbit anti-GDH (OriGene, Rockville, 171
MD, USA) and mouse anti-actin (Sigma-Aldrich, Saint Louis, MO, USA) as primary antibodies 172
(1:1000). Immunodetection was performed using an alkaline phosphatase-conjugated secondary 173
antibody (Sigma-Aldrich, Saint Louis, MO, USA; 1:3000) and the Clarity Western ECL Substrate 174
Kit (Bio-Rad, Hercules, CA, USA). 175
176
2.8. Enzyme activity assays and metabolite determinations 177
Liver crude extracts for enzyme activity assays were obtained as described (Caballero-Solares 178
et al., 2015). GDH was assayed in the direction of L-glutamate formation (reductive reaction) by 179
monitoring NADH oxidation at 340 nm in a 250-µl mixture containing 50 mM imidazole-HCl pH 180
7.4, 250 mM ammonium acetate, 5 mM 2-oxoglutarate, 0.1 mM NADH, 1 mM ADP and 4 µl crude 181
extract. To measure GDH reaction in the direction of 2-oxoglutarate synthesis (oxidative reaction), 182
NADH formation was followed at 340 nm in a 200-µl assay containing 154 mM tris-HCl pH 9.0, 20 183
mM L-glutamate, 100 mM hydrazine, 1 mM NAD+, 1 mM ADP and 4 µl crude extract. 2-184
Oxoglutarate dehydrogenase (OGDH) activity was assayed after addition of 0.12 mM coenzyme A 185
to a final volume of 200 µl containing 50 mM phosphate buffer pH 7.4, 2 mM MgCl2, 0.6 mM 186
thiamine pyrophosphate, 2 mM NAD+, 10 mM 2-oxoglutarate, 0.2 mM EGTA, 0.4 mM ADP and 4 187
µl crude extract. Alanine aminotransferase (ALT) and aspartate aminotransferase (AST) were 188
determined with commercial kits (Linear Chemicals, Montgat, Barcelona, Spain). 6-Phosphofructo-189
1-kinase (PFK), fructose-1,6-bisphosphatase (FBP1) and total protein were assayed as described 190
(Metón et al., 1999). One unit of enzyme activity was defined as the amount of enzyme necessary to 191
transform 1 µmol of substrate per min. 2-Oxoglutarate was determined by monitoring NADH 192
oxidation at 340 nm in a 200-µl assay containing 50 mM imidazole-HCl pH 7.4, 0.1 mM NADH, 193
0.37 U/mL GDH and 75 µl liver trichloroacetic acid extract. Spectrophotometric determinations 194
were performed at 30 °C in a Cobas Mira S analyser (Hoffman-La Roche, Basel, Switzerland). 195
196
2.9. Amino acid analysis 197
Amino acids and related molecules were analysed on filtered liver trifluoroacetic acid extracts 198
by cation-exchange chromatography followed by post-column derivatisation with ninhydrin and 199
UV/VIS detection (Moore et al., 1958). Chromatographic separation was performed using a 200
Biochrom 30 amino acid analyser equipped with PEEK column packed with Ultropac cation-201
exchange resin (Lithium High Performance Physiological Column) and Peltier heating/cooling 202
system (Biochrom, Cambridge, UK). Following sample injection, a gradient elution was applied by 203
combining five lithium citrate buffers of increasing pH (2.80 to 3.55) and ionic strength (0.2 M to 204
1.65 M). Column effluents reacted with ninhydrin at 135 ºC and derivatised amino acids were 205
detected at 570 nm and 440 nm wavelenghts. Amino acid peaks were identified according to the 206
retention times of amino acid standards. Addition of L-norleucine to each sample allowed 207
calculation of amino acid concentration by the internal standard method. Data analysis was 208
performed with EZChrom Elite software (Agilent Technologies, Santa Clara, CA, USA). 209
210
2.10. Statistics 211
Analyses were performed with SPSS software Version 22 (IBM, Armonk, NY, USA). 212
Statistical analysis with two levels was determined using Student’s t test. One-way ANOVA 213
statistical differences among three or more levels were determined with the Bonferroni post hoc 214 test. 215 216 3. Results 217
3.1. Molecular cloning of the full-coding sequence of S. aurata GDH 218
A 2,715 bp cDNA encoding GDH was isolated by RACE PCR performed on total RNA from 219
S. aurata liver. The S. aurata GDH nucleotide sequence was deposited to the GenBank database 220
under accession no. MF459045. The GDH cDNA contains a 1,629-bp open reading frame and a 221
consensus polyadenylation signal (AATAAA) 20 bp upstream from the poly(A+) tail. The deduced 222
amino acid sequence of S. aurata GDH predicts a polypeptide of 542 residues with a calculated 223
molecular mass of 59.67 kDa. Computer analysis with TargetP 1.1 (Emanuelsson et al., 2000; 224
Nielsen et al., 1997) indicated that GDH cDNA contains a mitochondrial targeting peptide with 225
putative cleavage site at position 20. The inferred amino acid sequence of S. aurata GDH was 226
aligned with GDH orthologues in other vertebrates to explore evolutionary relationships (Fig. 1A). 227
S. aurata GDH retains all residues considered important for glutamate and GTP binding (15 and 16 228
residues, respectively) and most residues involved in the binding to NAD+ (20 out of 25), ADP (26 229
out of 27) and thiamine pyrophosphate (5 out of 6) (Bunik et al., 2016). Pair-wise alignments 230
allowed us to generate a phylogenetic tree (Fig. 1B). Amongst fish, S. aurata GDH exhibited higher 231
similarity with sequences reported for Lates calcarifer, Nothobranchius furzeri, Paralichthys 232
olivaceus and Xiphophorus maculatus (96.3-97.1 % of identity). A lower identity was observed 233
when compared to Salmo salar (92.6 %) and Danio rerio (87.5 %). Concerning mammalian 234
orthologues, S. aurata GDH shared 81.2 to 84.3 % identity with Mus musculus, Rattus norvegicus 235
and Homo sapiens GDH. 236
237
3.2. Validation of shRNA expression constructs to silence S. aurata GDH in HepG2 cells 238
Five shRNA (named sh1 to sh5) designed to knockdown S. aurata GDH were subcloned into 239
pCpG-siRNA, a vector that allows long lasting expression of small interfering RNA (siRNA) in 240
vivo. Efficiency of GDH silencing for the resulting constructs (pCpG-sh1GDH to pCpG-sh5GDH) 241
was validated in HepG2 cells co-transfected with 30 ng or 300 ng of a construct expressing S. 242
aurata GDH (pcDNA3-GDH), 300 ng of pCMV-β and 600 ng of pCpG-sh1GDH, pCpG-sh2GDH, 243
pCpG-sh3GDH, pCpG-sh4GDH, pCpG-sh5GDH or pCpG-siRNA-Scramble (control). Forty-eight 244
hours later, the cells were lysed and RNA isolated to perform RT-qPCR assays to determine S. 245
aurata GDH mRNA levels. Three shRNAs (sh2, sh3 and sh5) significantly decreased GDH 246
expression in HepG2 cells co-transfected with 30 ng of pcDNA3-GDH, while sh2 was the only that 247
significantly down-regulated GDH mRNA in the cells co-transfected with a higher concentration of 248
pcDNA3-GDH (300 ng). In all cases, the highest GDH gene silencing effect was observed with sh2, 249
which reduced values to 21 % and 55 % of controls (Scramble) after co-tranfection with 30 ng and 250
300 ng of pcDNA3-GDH, respectively (Fig. 2A). Therefore, sh2 was selected for subsequent 251
studies. 252
253
3.3. Effect of chitosan-TPP-pCpG-sh2GDH administration on GDH expression in the liver of S. 254
aurata 255
To study the metabolic effects of GDH silencing, chitosan-TPP nanoparticles were complexed 256
with pCpG-sh2GDH to deliver and express sh2 into S. aurata liver cells. Schematic representation 257
of TPP-DNA nanoparticles is shown in Figure 2B. Atomic force microscopy on chitosan-258
TPP nanoparticles showed a rounded morphology with mean diameter size ± SD (n=6) of 224.0 nm 259
± 62.4 (Fig. 2C), and presented a mean Z potential of 32.98 mV ± 1.16. Incorporation of pCpG-260
siRNA constructs to chitosan-TPP nanoparticles did not significantly affect morphology or mean 261
diameter size, while reduced mean Z potential to 14.37 mV ± 1.29. Three groups of fish received an 262
intraperitoneal injection of pCpG-sh2GDH (10 µg of plasmid/g BW), chitosan-TPP-263
pCpG-siRNA-Scramble (10 µg of plasmid/g BW; negative control) or chitosan-TPP nanoparticles 264
(negative control of chitosan-TPP not complexed with DNA). GDH mRNA levels, 265
immunodetectable protein and enzyme activity were determined in the liver at 72 hours post-266
treatment. As expected, inclusion of pCpG-siRNA-Scramble into chitosan-TPP nanoparticles did 267
not affect GDH mRNA levels in the liver. However, administration of chitosan-TPP-pCpG-268
sh2GDH significantly decreased GDH expression to 41 % of control values (Scramble) (Fig. 2B). 269
Consistent with sh2-mediated down-regulation of GDH mRNA, treatment with pCpG-sh2GDH 270
decreased immunodetectable GDH protein in liver extracts and decreased GDH activity in both 271
oxidative and reductive reactions to about 53-55 % of control values (Fig. 3A). 272
273
3.4 Effect of GDH knockdown on the hepatic intermediary metabolism of S. aurata 274
The effect of GDH silencing was also studied on hepatic key enzyme activities involved in 275
amino acid metabolism, glycolysis-gluconeogenesis and the Krebs cycle, 2-oxoglutarate levels and 276
amino acid profile. In regard of amino acid metabolism, knockdown of GDH significantly 277
decreased AST activity to about 73 % of control levels. Albeit not significant, the same trend was 278
observed for ALT (Fig. 3B). We also addressed the effect of GDH silencing on PFK and FBP1 279
activity, which exert a major role in glucose homeostasis by controlling the flux through the 280
fructose-6-phosphate/fructose-1,6-bisphosphate substrate cycle. GDH knockdown did not affect 281
PFK activity, but significantly reduced FBP1 activity to 63 % of controls. Therefore, the PFK/FBP1 282
ratio increased to 122 % as a result of GDH silencing (Fig. 3C). The hepatic content of 2-283
oxoglutarate, a substrate of the reductive GDH reaction, significantly increased to 172 % in the liver 284
of fish treated with chitosan-TPP-pCpG-sh2GDH. Given that 2-oxoglutarate is also a substrate of 285
OGDH, a rate-limiting complex of the Krebs cycle, we analysed OGDH activity in the liver. GDH 286
silencing increased OGDH activity to 135 % (Fig. 3D). Since GDH has a major role in liver amino 287
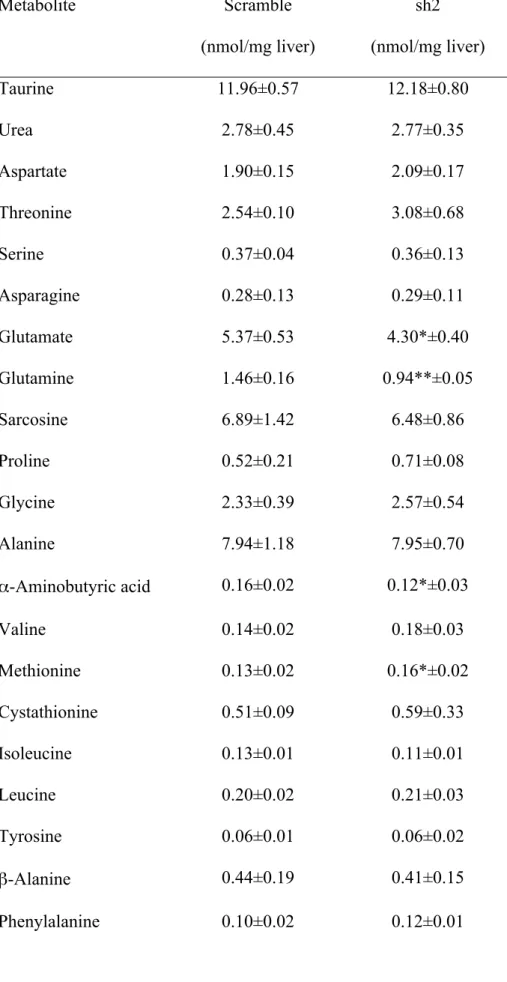
acid catabolism through oxidative deamination of L-glutamate, changes in amino acid and related 288
molecules profile resulting from GDH silencing were also determined. Administration of chitosan-289
TPP-pCpG-sh2GDH nanoparticles significantly decreased glutamate and glutamine to 80 % and 64 290
% of their respective controls. GDH silencing also decreased α-aminobutyric acid to 76 % of 291
control values, while increased 1.2-fold methionine levels (Table 2). 292
293
4. Discussion
294
Teleost fish use efficiently amino acids for growth and to obtain energy, while exhibit slower 295
dietary carbohydrate digestion and free sugar metabolisation than mammals, giving rise to 296
prolonged hyperglycemia. Therefore, optimal growth of fish requires high levels of dietary protein 297
(Moon, 2001; Polakof et al., 2012). However, a reduction in the amount of protein in aquafeeds 298
would alleviate dependence on wild fisheries and the environmental impact of aquaculture (Gormaz 299
et al., 2014; Martinez-Porchas and Martinez-Cordova, 2012; Naylor et al., 2000). The main site of 300
amino acid catabolism is the liver and primarily involves transdeamination, in which the amino 301
group of a variety of amino acids is transferred to 2-oxoglutarate to produce glutamate, which in 302
turn can be deaminated by GDH. The fact that the molecular role of GDH in fish remains largely 303
unexplored prompted us to study the effect of GDH silencing on S. aurata liver intermediary 304
metabolism. To this end, the full length GDH cDNA sequence from S. aurata was isolated. As 305
expected, alignment of the inferred peptide sequence of S. aurata GDH with those reported for 306
other fish species gave the highest identity (>96 %) with species from the Percomorphaceae 307
subdivision (Lates calcarifer, Nothobranchius furzeri, Paralichthys olivaceus and Xiphophorus 308
maculatus), the subdivision to which S. aurata belongs. A slightly lower identity was found when 309
compared to phylogenetically distant fish species, such as Salmoniformes (Salmo salar) and 310
Cypriniformes (Danio rerio). 311
S. aurata GDH retains all residues involved in glutamate binding and GTP inhibition (31 in 312
total), and most of the residues considered of importance for NAD+ and thiamine pyrophosphate 313
binding, and ADP activation (51 out of 58) (Bunik et al., 2016). Indeed, analysis of non-conserved 314
amino acids involved in catalysis and allosteric regulation of GDH reveals that 6 out of 7 are 315
conservative mutations. The only significant difference between species from the Percomorphaceae 316
subdivision (including S. aurata) and mammalian GDH resides in the substitution of a serine 317
residue involved in NAD+ binding by Gly368 in S. aurata GDH. Taken together, the overall 318
similarity with mammalian GDH suggests a high degree of conservation of the structure and 319
conceivably the reaction mechanism during vertebrate evolution. 320
Availability of S. aurata GDH cDNA sequence allowed us to design shRNAs to knockdown 321
GDH expression and analyse the metabolic effects derived from GDH silencing. Validation of five 322
selected shRNAs was performed in HepG2 cells co-transfected with shRNA and S. aurata GDH 323
expression plasmids. The most effective shRNA in vitro (sh2) was subsequently chosen to evaluate 324
metabolic effects of GDH gene silencing in vivo. As a vector to deliver pCpG-sh2GDH (sh2 325
expression plasmid) into S. aurata hepatocytes, we used chitosan, which is a cationic polymer 326
composed of glucosamine and N-acetylglucamosine, derived from chitin by deacetylation. 327
Mucoadhesion, low toxicity, biodegradability and biocompatibility of chitosan led in recent years to 328
increasing use of chitosan as a carrier to facilitate incorporation of DNA constructs into host cells in 329
vivo (Ragelle et al., 2014; Sáez et al., 2017). Recently, administration of chitosan-TPP-DNA 330
nanoparticles to knockdown S. aurata cytosolic ALT allowed us to demonstrate that cytosolic ALT 331
silencing enhanced rate-limiting activities of glycolysis, while did not affect gluconeogenesis 332
(González et al., 2016). Based on this methodology, in the present study we used the ionic gelation 333
technique, a method based on interactions between low molecular weight chitosan and polyanions 334
such as TPP (Fàbregas et al., 2013), to encapsulate pCpG-sh2GDH and analyse the effect of GDH 335
silencing on the hepatic metabolism of S. aurata. Seventy-two hours following intraperitoneal 336
administration of chitosan-TPP-pCpG-sh2GDH, the hepatic expression of GDH was significantly 337
reduced at mRNA level, immunodetectable protein and reductive and oxidative enzyme activity. No 338
sickness, death or behavioural alterations were observed as a consequence of GDH silencing. 339
Similarly as in S. aurata, previous studies showed that although GDH deletion leads to deficient 340
oxidative metabolism of glutamate in the central nervous system, brain-specific Glud1 null mice 341
were viable, fertile and without apparent behavioural problems (Frigerio et al., 2012). 342
Consistent with the liver as the main site for GDH expression, GDH silencing promoted 343
significant changes on the hepatic levels of GDH substrates and products: glutamate and 2-344
oxoglutarate. As a result of GDH silencing, 2-oxoglutarate levels increased in the liver of S. aurata. 345
Elevated 2-oxoglutarate values may determine enhancement of OGDH activity, a key enzyme 346
complex of the Krebs cycle. In agreement with increased 2-oxoglutarate levels, a decreased GDH 347
activity led to the opposite effects on the hepatic content of glutamate. Since 2-oxoglutarate can be 348
converted to glutamate by either GDH or transaminases, it is conceivable that low glutamate levels 349
were reinforced by inhibition of ALT and AST, which are considered the more relevant 350
aminotransferases in the liver. Altogether, our findings point to decreased transaminase activity and 351
reduced transdeamination resulting from GDH silencing in the S. aurata liver. Indeed, given that 352
glutamine synthetase can synthesise glutamine from glutamate, the low levels of glutamate may be 353
responsible for decreased glutamine values in the liver of fish treated with chitosan-TPP-pCpG-354
sh2GDH. 355
Bearing in mind that methionine is an essential amino acid in animals, the fact that 356
methionine levels were higher in the liver of fish treated with chitosan-TPP-pCpG-sh2GDH 357
nanoparticles suggests that GDH silencing decreased methionine metabolism, which in turn may 358
result in reduced α-aminobutyric acid levels. Considering that it was recently reported that high 359
protein diets increase α-aminobutyric acid in humans (Haschke-Becher et al., 2016), the low levels 360
of α-aminobutyric acid in the liver of treated fish can also be a consequence of decreased amino 361
acid metabolism as a result of GDH silencing. 362
In a context with reduced transdeaminating capacity, the use of amino acids as glucogenic and 363
ketogenic substrates, and to produce energy by entering catabolic pathways, could be compromised. 364
In this regard, it is remarkable that GDH knockdown increased PFK/FBP1 activity ratio, which 365
suggests that glycolysis was favoured over gluconeogenesis in the liver of treated fish. This 366
metabolic shift could enhance the use of dietary carbohydrates as fuel for energy production as a 367
compensatory mechanism resulting from impaired transdeamination and reduced entrance of the 368
carbon skeleton of amino acids into the Krebs cycle to obtain energy and as gluconeogenic 369
substrates. Our findings are consistent with increased glucose utilisation in cultured mice astrocytes 370
treated with siRNA to knockdown GDH expression (Pajęcka et al., 2015). The authors concluded 371
that glucose could replace glutamate as energy substrate in GDH-deficient cells on the basis that 372
siRNA-treated astrocytes were able to maintain physiological levels of ATP regardless of GDH 373
expression by increasing glucose oxidation. Furthermore, consistent with the rise in OGDH 374
complex activity and elevated 2-oxoglutarate levels in the liver of S. aurata treated with chitosan-375
TPP-pCpG-sh2GDH nanoparticles, GDH deficient astrocytes exhibit an increased glucose 376
metabolism linked to elevated Krebs cycle flux from 2-oxoglutarate to oxaloacetate and up-377
regulation of anaplerotic pathways such as pyruvate carboxylase to maintain the amount of Krebs 378
cycle intermediates (Nissen et al., 2015). Indeed, transgenic mice expressing human GDH2 showed 379
a general decrease in oxidative glucose metabolism (Nissen et al., 2017). 380
By hindering the use of amino acids as gluconeogenic substrates and favouring glucose 381
oxidation in the liver of S. aurata, GDH silencing may enable partial substitution of dietary protein 382
by carbohydrates in aquafeeds. Fishmeal is the main protein source in fish farming and it is 383
obtained by processing an important part of wild fish captures. Therefore, a reduction in the amount 384
of protein in aquafeeds would alleviate dependence on wild fisheries and decrease local 385
eutrophication resulting from amino acid oxidation and ammonia release of excess dietary protein. 386
In addition to reduce environmental impact of aquaculture, substitution of dietary protein by 387
cheaper nutrients such as carbohydrates, would decrease production costs. 388
In conclusion, we addressed the metabolic effects of GDH silencing in the liver of S. aurata. 389
Data presented suggest that knockdown of GDH expression reduces hepatic transdeamination and 390
compromises the use of amino acids as gluconeogenic substrates. Our findings point to GDH 391
silencing as a target to spare protein, stimulate glucose metabolism and reduce environmental 392
impact and production costs of aquaculture through partial substitution of dietary protein by 393 carbohydrates. 394 395 Acknowledgements 396
This work was supported by the Ministerio de Economía, Industria y Competitividad of Spain 397
(grant number AGL2016-78124-R; cofunded by the European Regional Development Fund, 398
European Comission). The authors thank Piscimar (Burriana, Castellón, Spain) for providing S. 399
aurata juveniles, and the Aquarium of Barcelona (Barcelona, Spain) for supplying filtered seawater. 400
401
Declarations of interest: none.
402 403
References
404
Bibiano Melo, J.F., Lundstedt, L.M., Metón, I., Baanante, I.V., Moraes, G., 2006. Effects of dietary 405
levels of protein on nitrogenous metabolism of Rhamdia quelen (Teleostei: Pimelodidae). 406
Comp. Biochem. Physiol. A Mol. Integr. Physiol. 145, 181–187. 407
Borges, P., Medale, F., Dias, J., Valente, L.M.P., 2013. Protein utilisation and intermediary 408
metabolism of Senegalese sole (Solea senegalensis) as a function of protein:lipid ratio. Br. J. 409
Nutr. 109, 1373–1381. 410
Bunik, V., Artiukhov, A., Aleshin, V., Mkrtchyan, G., 2016. Multiple Forms of Glutamate 411
Dehydrogenase in Animals: Structural Determinants and Physiological Implications. Biology 412
5, 53. 413
Caballero-Solares, A., Viegas, I., Salgado, M.C., Siles, A.M., Sáez, A., Metón, I., Baanante, I.V., 414
Fernández, F., 2015. Diets supplemented with glutamate or glutamine improve protein 415
retention and modulate gene expression of key enzymes of hepatic metabolism in gilthead 416
seabream (Sparus aurata) juveniles. Aquaculture 444, 79–87. 417
Carobbio, S., Frigerio, F., Rubi, B., Vetterli, L., Bloksgaard, M., Gjinovci, A., 418
Pournourmohammadi, S., Herrera, P.L., Reith, W., Mandrup, S., Maechler, P., 2009. Deletion 419
of glutamate dehydrogenase in beta-cells abolishes part of the insulin secretory response not 420
required for glucose homeostasis. J. Biol. Chem. 284, 921–929. 421
Carobbio, S., Ishihara, H., Fernandez-Pascual, S., Bartley, C., Martin-Del-Rio, R., Maechler, P., 422
2004. Insulin secretion profiles are modified by overexpression of glutamate dehydrogenase in 423
pancreatic islets. Diabetologia 47, 266–276. 424
Chevenet, F., Brun, C., Bañuls, A.-L., Jacq, B., Christen, R., 2006. TreeDyn: towards dynamic 425
graphics and annotations for analyses of trees. BMC Bioinformatics 7, 439. 426
Coutinho, F., Peres, H., Castro, C., Pérez-Jiménez, A., Pousão-Ferreira, P., Oliva-Teles, A., Enes, 427
P., 2016. Metabolic responses to dietary protein/carbohydrate ratios in zebra sea bream 428
(Diplodus cervinus, Lowe, 1838) juveniles. Fish Physiol. Biochem. 42, 343–352. 429
Couto, A., Enes, P., Peres, H., Oliva-Teles, A., 2008. Effect of water temperature and dietary starch 430
on growth and metabolic utilization of diets in gilthead sea bream (Sparus aurata) juveniles. 431
Comp. Biochem. Physiol. A Mol. Integr. Physiol. 151, 45–50. 432
Emanuelsson, O., Nielsen, H., Brunak, S., von Heijne, G., 2000. Predicting Subcellular Localization 433
of Proteins Based on their N-terminal Amino Acid Sequence. J. Mol. Biol. 300, 1005–1016. 434
Fàbregas, A., Miñarro, M., García-Montoya, E., Pérez-Lozano, P., Carrillo, C., Sarrate, R., 435
Sánchez, N., Ticó, J.R., Suñé-Negre, J.M., 2013. Impact of physical parameters on particle size 436
and reaction yield when using the ionic gelation method to obtain cationic polymeric chitosan-437
tripolyphosphate nanoparticles. Int. J. Pharm. 446, 199–204. 438
Fernández, F., Miquel, A.G., Cordoba, M., Varas, M., Metón, I., Caseras, A., Baanante, I.V., 2007. 439
Effects of diets with distinct protein-to-carbohydrate ratios on nutrient digestibility, growth 440
performance, body composition and liver intermediary enzyme activities in gilthead sea bream 441
(Sparus aurata, L.) fingerlings. J. Exp. Mar. Bio. Ecol. 343, 1–10. 442
Frick, N.T., Bystriansky, J.S., Ip, Y.K., Chew, S.F., Ballantyne, J.S., 2008. Carbohydrate and amino 443
acid metabolism in fasting and aestivating African lungfish (Protopterus dolloi). Comp. 444
Biochem. Physiol. A Mol. Integr. Physiol. 151, 85–92. 445
Frigerio, F., Karaca, M., De Roo, M., Mlynárik, V., Skytt, D.M., Carobbio, S., Pajęcka, K., 446
Waagepetersen, H.S., Gruetter, R., Muller, D., Maechler, P., 2012. Deletion of glutamate 447
dehydrogenase 1 (Glud1) in the central nervous system affects glutamate handling without 448
altering synaptic transmission. J Neurochem. 123, 342–348. 449
Gaspar, C., Silva-Marrero, J.I., Salgado, M.C., Baanante, I.V., Metón, I., 2018. Role of upstream 450
stimulatory factor 2 in glutamate dehydrogenase gene transcription. J. Mol. Endocrinol., in 451
press. doi:10.1530/JME-17-0142. 452
Göhring, I., Mulder, H., 2012. Glutamate dehydrogenase, insulin secretion, and type 2 diabetes: a 453
new means to protect the pancreatic β-cell? J. Endocrinol. 212, 239–242. 454
González, J.D., Silva-Marrero, J.I., Metón, I., Caballero-Solares, A., Viegas, I., Fernández, F., 455
Miñarro, M., Fàbregas, A., Ticó, J.R., Jones, J.G., Baanante, I.V., 2016. Chitosan-Mediated 456
shRNA Knockdown of Cytosolic Alanine Aminotransferase Improves Hepatic Carbohydrate 457
Metabolism. Mar. Biotechnol. 18, 85–97. 458
Gormaz, J.G., Fry, J.P., Erazo, M., Love, D.C., 2014. Public Health Perspectives on Aquaculture. 459
Curr. Environ. Heal. Reports 1, 227–238. 460
Graham, F.L., van der Eb, A.J., 1973. A new technique for the assay of infectivity of human 461
adenovirus 5 DNA. Virology 52, 456–467. 462
Guindon, S., Dufayard, J.-F., Lefort, V., Anisimova, M., Hordijk, W., Gascuel, O., 2010. New 463
Algorithms and Methods to Estimate Maximum-Likelihood Phylogenies: Assessing the 464
Performance of PhyML 3.0. Syst. Biol. 59, 307–321. 465
Haschke-Becher, E., Kainz, A., Bachmann, C., 2016. Reference values of amino acids and of 466
common clinical chemistry in plasma of healthy infants aged 1 and 4 months. J. Inherit. Metab. 467
Dis. 39, 25–37. 468
Karaca, M., Frigerio, F., Maechler, P., 2011. From pancreatic islets to central nervous system, the 469
importance of glutamate dehydrogenase for the control of energy homeostasis. Neurochem. 470
Int. 59, 510–517. 471
Li, M., Li, C., Allen, A., Stanley, C.A., Smith, T.J., 2014. Glutamate dehydrogenase: structure, 472
allosteric regulation, and role in insulin homeostasis. Neurochem. Res. 39, 433–445. 473
Lushchak, V.I., Husak, V. V, Storey, K.B., 2008. Regulation of AMP-deaminase activity from 474
white muscle of common carp Cyprinus carpio. Comp. Biochem. Physiol. B. Biochem. Mol. 475
Biol. 149, 362–369. 476
Martinez-Porchas, M., Martinez-Cordova, L.R., 2012. World aquaculture: environmental impacts 477
and troubleshooting alternatives. Sci. World J. 2012, 389623. 478
Metón, I., Egea, M., Anemaet, I.G., Fernández, F., Baanante, I.V., 2006. Sterol regulatory element 479
binding protein-1a transactivates 6-phosphofructo-2-kinase/fructose-2,6-bisphosphatase gene 480
promoter. Endocrinology 147, 3446–3456. 481
Metón, I., Mediavilla, D., Caseras, A., Cantó, E., Fernández, F., Baanante, I.V., 1999. Effect of diet 482
composition and ration size on key enzyme activities of glycolysis-gluconeogenesis, the 483
pentose phosphate pathway and amino acid metabolism in liver of gilthead sea bream (Sparus 484
aurata). Br. J. Nutr. 82, 223–232. 485
Moon, T.W., 2001. Glucose intolerance in teleost fish: fact or fiction? Comp. Biochem. Physiol. B 486
Biochem. Mol. Biol. 129, 243–249. 487
Moore, S., Spackman, D.H., Stein, W.H., 1958. Automatic recording apparatus for use in the 488
chromatography of amino acids. Fed. Proc. 17, 1107–1115. 489
Naylor, R.L., Goldburg, R.J., Primavera, J.H., Kautsky, N., Beveridge, M.C., Clay, J., Folke, C., 490
Lubchenco, J., Mooney, H., Troell, M., 2000. Effect of aquaculture on world fish supplies. 491
Nature 405, 1017–1024. 492
Nielsen, H., Engelbrecht, J., Brunak, S., von Heijne, G., 1997. Identification of prokaryotic and 493
eukaryotic signal peptides and prediction of their cleavage sites. Protein Eng. 10, 1–6. 494
Nissen, J.D., Lykke, K., Bryk, J., Stridh, M.H., Zaganas, I., Skytt, D.M., Schousboe, A., Bak, L.K., 495
Enard, W., Pääbo, S., Waagepetersen, H.S., 2017. Expression of the human isoform of 496
glutamate dehydrogenase, hGDH2, augments TCA cycle capacity and oxidative metabolism of 497
glutamate during glucose deprivation in astrocytes. Glia 65, 474–488. 498
Nissen, J.D., Pajęcka, K., Stridh, M.H., Skytt, D.M., Waagepetersen, H.S., 2015. Dysfunctional 499
TCA-Cycle Metabolism in Glutamate Dehydrogenase Deficient Astrocytes. Glia 63, 2313– 500
2326. 501
Pajęcka, K., Nissen, J.D., Stridh, M.H., Skytt, D.M., Schousboe, A., Waagepetersen, H.S., 2015. 502
Glucose replaces glutamate as energy substrate to fuel glutamate uptake in glutamate 503
dehydrogenase-deficient astrocytes. J. Neurosci. Res. 93, 1093–1100. 504
Peres, H., Oliva-Teles, A., 2006. Protein and Energy Metabolism of European Seabass 505
(Dicentrarchus labrax) Juveniles and Estimation of Maintenance Requirements. Fish Physiol. 506
Biochem. 31, 23–31. 507
Pérez-Jiménez, A., Cardenete, G., Hidalgo, M.C., García-Alcázar, A., Abellán, E., Morales, A.E., 508
2012. Metabolic adjustments of Dentex dentex to prolonged starvation and refeeding. Fish 509
Physiol. Biochem. 38, 1145–1157. 510
Pérez-Jiménez, A., Guedes, M.J., Morales, A.E., Oliva-Teles, A., 2007. Metabolic responses to 511
short starvation and refeeding in Dicentrarchus labrax. Effect of dietary composition. 512
Aquaculture 265, 325–335. 513
Pfaffl, M.W., 2001. A new mathematical model for relative quantification in real-time RT-PCR. 514
Nucleic Acids Res. 29, e45. 515
Plaitakis, A., Kalef-Ezra, E., Kotzamani, D., Zaganas, I., Spanaki, C., 2017. The Glutamate 516
Dehydrogenase Pathway and Its Roles in Cell and Tissue Biology in Health and Disease. 517
Biology 6, 11. 518
Polakof, S., Panserat, S., Soengas, J.L., Moon, T.W., 2012. Glucose metabolism in fish: a review. J. 519
Comp. Physiol. B 182, 1015–1045. 520
Ragelle, H., Riva, R., Vandermeulen, G., Naeye, B., Pourcelle, V., Le Duff, C.S., D’Haese, C., 521
Nysten, B., Braeckmans, K., De Smedt, S.C., Jérôme, C., Préat, V., 2014. Chitosan 522
nanoparticles for siRNA delivery: optimizing formulation to increase stability and efficiency. 523
J. Control. Release 176, 54–63. 524
Sáez, M., Vizcaíno, A., Alarcón, F., Martínez, T., 2017. Comparison of lacZ reporter gene 525
expression in gilthead sea bream (Sparus aurata) following oral or intramuscular 526
administration of plasmid DNA in chitosan nanoparticles. Aquaculture 474, 1–10. 527
Sánchez-Muros, M.J., García-Rejón, L., García-Salguero, L., de la Higuera, M., Lupiáñez, J.A., 528
1998. Long-term nutritional effects on the primary liver and kidney metabolism in rainbow 529
trout. Adaptive response to starvation and a high-protein, carbohydrate-free diet on glutamate 530
dehydrogenase and alanine aminotransferase kinetics. Int. J. Biochem. Cell Biol. 30, 55–63. 531
Sievers, F., Wilm, A., Dineen, D., Gibson, T.J., Karplus, K., Li, W., Lopez, R., McWilliam, H., 532
Remmert, M., Söding, J., Thompson, J.D., Higgins, D.G., 2011. Fast, scalable generation of 533
high-quality protein multiple sequence alignments using Clustal Omega. Mol. Syst. Biol. 7, 534
539. 535
Tian, J., He, G., Mai, K., Liu, C., 2015. Effects of postprandial starvation on mRNA expression of 536
endocrine-, amino acid and peptide transporter-, and metabolic enzyme-related genes in 537
zebrafish (Danio rerio). Fish Physiol. Biochem. 41, 773–787. 538
Tranulis, M.A., Christophersen, B., Blom, A.K., Borrebaek, B., 1991. Glucose dehydrogenase, 539
glucose-6-phosphate dehydrogenase and hexokinase in liver of rainbow trout (Salmo 540
gairdneri). Effects of starvation and temperature variations. Comp. Biochem. Physiol. B 99, 541
687–691. 542
Treberg, J.R., Banh, S., Pandey, U., Weihrauch, D., 2014. Intertissue differences for the role of 543
glutamate dehydrogenase in metabolism. Neurochem. Res. 39, 516–526. 544
Viegas, I., Rito, J., Jarak, I., Leston, S., Caballero-Solares, A., Metón, I., Pardal, M.A., Baanante, 545
I.V., Jones, J.G., 2015. Contribution of dietary starch to hepatic and systemic carbohydrate 546
fluxes in European seabass (Dicentrarchus labrax L.). Br. J. Nutr. 113, 1345–1354. 547
548
Figure captions
Fig. 1. Multiple alignment and phylogenetic tree of GDH. (A) Alignment of the predicted amino
550
acid sequence of S. aurata GDH with GDH orthologues in other vertebrates. Black, identical amino 551
acids; grey, conservative amino acid substitutions. Letters on the top indicate residues involved in 552
the binding to ADP (A), glutamate (E), GTP (G), NAD+ (N) and thiamine pyrophosphate (T). 553
GenBank entries shown are: Sparus aurata (MF459045); Nothobranchius furzeri (XP_015818399); 554
Xiphophorus maculatus (XP_005794695); Lates calcarifer (XP_018531054), Paralichthys 555
olivaceus (XP_019938702), Salmo salar (NP_001117108), Danio rerio (NP_997741), Mus 556
musculus GDH1 (NP_032159), Rattus norvegicus GDH1 (NP_036702), Homo sapiens GDH1 557
(NP_005262) and Homo sapiens GDH2 (NP_036216). (B) Phylogenetic tree for GDH. Multiple 558
alignment and phylogenetic tree were made with Clustal Omega (Sievers et al., 2011), PhyML 559
(Guindon et al., 2010), and TreeDyn (Chevenet et al., 2006). 560
561
Fig. 2. In vitro validation of shRNA-mediated silencing of S. aurata GDH and effect of
chitosan-562
TPP-DNA nanoparticles on hepatic GDH mRNA levels in S. aurata. (A) HepG2 cells were co-563
transfected with of pcDNA3-GDH (30 ng or 300 ng), pCMV-β (300 ng) and pCpG-sh1GDH, 564
pCpG-sh2GDH, pCpG-sh3GDH, pCpG-sh4GDH or pCpG-sh5GDH (600 ng). S. aurata GDH 565
mRNA levels at 48 hours post-transfection were analysed by RT-qPCR and normalised with human 566
ribosomal subunit 18s and β-galactosidase (internal control of transfection). (B) Molecular structure 567
and electrostatic interactions of chitosan-TPP-DNA nanoparticles. (C) The left part of the panel 568
shows representative images of TPP, TPP-pCpG-siRNA-Scramble and chitosan-569
TPP-pCpG-sh2GDH nanoparticles obtained by atomic force microscopy. White bars correspond to 570
200 nm. The right part of the panel shows the effect of nanoparticle administration on GDH mRNA 571
levels in the S. aurata liver. Three groups of fish were intraperitoneally injected with chitosan-TPP 572
(Chitosan), TPP-pCpG-siRNA-Scramble (Scramble; 10 µg of plasmid/g BW) or chitosan-573
TPP-pCpG-sh2GDH (sh2; 10 µg of plasmid/g BW). Analysis of GDH mRNA levels relative to the 574
geometric mean of ribosomal subunit 18s, β-actin and EF1α were performed by RT-qPCR in liver 575
samples of S. aurata at 72 hours post-treatment. The values are expressed as mean ± SD (n=4, in 576
vitro analysis; n=6, in vivo analysis). Statistical significance related to control (Scramble) is 577
indicated as follows: **P < 0.01; ***P < 0.001. 578
579
Fig. 3. Effect of chitosan-TPP-DNA nanoparticles on GDH protein and activity, 2-oxoglutarate
580
content and key enzyme activities in the S. aurata liver metabolism. (A) Effect of GDH silencing on 581
immunodetectable GDH protein, shown as a representative Western blot (upper part of the panel), 582
and reductive and oxidative GDH activity (lower part of the panel). (B) Effect of GDH silencing on 583
ALT and AST activity. (C) Effect of GDH silencing on PFK and FBP1 activity, and PFK/FBP1 584
activity ratio. (D) Effect of GDH silencing on 2-oxoglutarate levels and OGDH activity. GDH 585
immunodetectable protein, enzyme activities and 2-oxoglutarate content were assayed in liver crude 586
extracts 72 hours after administration of 10 µg/g BW of pCpG-siRNA-Scramble (Scramble) or 587
chitosan-TPP-pCpG-sh2GDH (sh2). 2-Oxoglutarate concentration and enzyme specific activities 588
are expressed as mean ± SD (n=6). Statistical significance related to control (Scramble) is indicated 589
as follows: *P < 0.05; **P < 0.01. 590
Table 1. Oligonucleotides used in the present study. 591 Primer Sequence (5’ to 3’) CG1305 ACTTGAATGCTGGTGGTGTGACAGTGT CG1306 CCCACCACCCCAGATGCTGACAAGAT CG1307 GTCTTGTCCTGGAAGCCTGGTGTCA CG1308 GGCTGAGATACGACCGTGGATACCTCCC CG1333 TTCCTTAAACACAATTTCAACGTCAA CG1334 GGAGCTGCTGTGTCGTTCAT CG1526 CCGGATCCACCATGGACCGGTATTTCGGGGAG CG1527 CCGAATTCGGCTGTTTAGAGGGGGGAGAATAG CG1531 GTACCTCGTTCGTTTACACGGTTAGCTATCAAGAGTAGCTAACCGTG TAAACGAACTTTTTGGAAA CG1532 AGCTTTTCCAAAAAGTTCGTTTACACGGTTAGCTACTCTTGATAGCT AACCGTGTAAACGAACGAG CG1533 GTACCTCGCGCATCATCAAGCCCTGTAATCAAGAGTTACAGGGCTTG ATGATGCGCTTTTTGGAAA CG1534 AGCTTTTCCAAAAAGCGCATCATCAAGCCCTGTAACTCTTGATTACA GGGCTTGATGATGCGCGAG CG1535 GTACCTCGAGCCAAAGCTGGAGTCAAGATCAAGAGTCTTGACTCCA GCTTTGGCTCTTTTTGGAAA CG1536 AGCTTTTCCAAAAAGAGCCAAAGCTGGAGTCAAGACTCTTGATCTTG ACTCCAGCTTTGGCTCGAG CG1537 GTACCTCGAGAACAACGTCATGGTTATTTCAAGAGAATAACCATGAC GTTGTTCTCTTTTTGGAAA
CG1538 AGCTTTTCCAAAAAGAGAACAACGTCATGGTTATTCTCTTGAAATAA CCATGACGTTGTTCTCGAG CG1539 GTACCTCGGCTGGACTTACCTTCACATATCAAGAGTATGTGAAGGTA AGTCCAGCCTTTTTGGAAA CG1540 AGCTTTTCCAAAAAGGCTGGACTTACCTTCACATACTCTTGATATGT GAAGGTAAGTCCAGCCGAG CG1543 GGTATTTCGGGGAGCTGCTGAG CG1544 CGCATCAGGGACGAGGACA AS-EF1Fw CCCGCCTCTGTTGCCTTCG AS-EF1Rv CAGCAGTGTGGTTCCGTTAGC JDRT18S TTACGCCCATGTTGTCCTGAG JDRT18AS AGGATTCTGCATGATGGTCACC JDRTCMVBS CCCATTACGGTCAATCCGC JDRTCMVBAS ACAACCCGTCGGATTCTCC QBACTINF CTGGCATCACACCTTCTACAACGAG QBACTINR GCGGGGGTGTTGAAGGTCTC 592
The following primers contain restriction sites (underlined): CG1526 (BamHI) and CG1527 593
(EcoRI). 594
Table 2. Effect of GDH silencing on the hepatic levels of amino acids and related molecules. 595 Metabolite Scramble (nmol/mg liver) sh2 (nmol/mg liver) Taurine 11.96±0.57 12.18±0.80 Urea 2.78±0.45 2.77±0.35 Aspartate 1.90±0.15 2.09±0.17 Threonine 2.54±0.10 3.08±0.68 Serine 0.37±0.04 0.36±0.13 Asparagine 0.28±0.13 0.29±0.11 Glutamate 5.37±0.53 4.30*±0.40 Glutamine 1.46±0.16 0.94**±0.05 Sarcosine 6.89±1.42 6.48±0.86 Proline 0.52±0.21 0.71±0.08 Glycine 2.33±0.39 2.57±0.54 Alanine 7.94±1.18 7.95±0.70 α-Aminobutyric acid 0.16±0.02 0.12*±0.03 Valine 0.14±0.02 0.18±0.03 Methionine 0.13±0.02 0.16*±0.02 Cystathionine 0.51±0.09 0.59±0.33 Isoleucine 0.13±0.01 0.11±0.01 Leucine 0.20±0.02 0.21±0.03 Tyrosine 0.06±0.01 0.06±0.02 β-Alanine 0.44±0.19 0.41±0.15 Phenylalanine 0.10±0.02 0.12±0.01
Ornithine 0.07±0.02 0.07±0.03
Lysine 0.40±0.07 0.57±0.15
Histidine 0.46±0.08 0.56±0.08
Arginine 0.20±0.03 0.24±0.06
596
Metabolites were assayed in liver extracts 72 hours following administration of 10 µg of pCpG-597
siRNA-Scramble (Scramble) or chitosan-TPP-pCpG-sh2GDH (sh2) per gram BW. The values are 598
expressed as mean ± SD (n=5). Statistical significance related to control fish (Scramble) is indicated 599
as follows: *P < 0.05; **P < 0.01. 600