DISA
W
or
kI
ng
P
AP
er
DISA
Dipartimento di Informatica
e Studi Aziendali
2008/3
R&D, firm size,
and product innovation dynamics
Marco Corsino, Giuseppe Espa and Rocco Micciolo
DISA
Dipartimento di Informatica
e Studi Aziendali
A bank covenants pricing model
Flavio Bazzana
DISA
W
or
kI
ng
P
AP
er
2008/3
R&D, firm size,
and product innovation dynamics
Marco Corsino, Giuseppe Espa and Rocco Micciolo
DISA Working Papers
The series of DISA Working Papers is published by the Department of Computer and Management Sciences (Dipartimento di Informatica e Studi Aziendali DISA) of the University of Trento, Italy.
Editor
Ricardo Alberto MARQUES PEREIRA [email protected]
Managing editor
Roberto GABRIELE [email protected]
Associate editors
Flavio BAZZANA [email protected] Finance
Michele BERTONI [email protected] Financial and management accounting Pier Franco CAMUSSONE [email protected] Management information systems Luigi COLAZZO [email protected] Computer Science
Michele FEDRIZZI [email protected] Mathematics Andrea FRANCESCONI [email protected] Public Management Loris GAIO [email protected] Business Economics
Umberto MARTINI [email protected] Tourism management and marketing Pier Luigi NOVI INVERARDI [email protected] Statistics
Marco ZAMARIAN [email protected] Organization theory
Technical officer
Paolo FURLANI [email protected]
Guidelines for authors
Papers may be written in English or Italian but authors should provide title, abstract, and keywords in both languages. Manuscripts should be submitted (in pdf format) by the corresponding author to the appropriate Associate Editor, who will ask a member of DISA for a short written review within two weeks. The revised version of the manuscript, together with the author's response to the reviewer, should again be sent to the Associate Editor for his consideration. Finally the Associate Editor sends all the material (original and final version, review and response, plus his own recommendation) to the Editor, who authorizes the publication and assigns it a serial number.
The Managing Editor and the Technical Officer ensure that all published papers are uploaded in the international RepEc public-action database. On the other hand, it is up to the corresponding author to make direct contact with the Departmental Secretary regarding the offprint order and the research fund which it should refer to.
Ricardo Alberto MARQUES PEREIRA
Dipartimento di Informatica e Studi Aziendali Università degli Studi di Trento
R&D, Firm Size, and Product Innovation
Dynamics
Marco Corsino
∗Giuseppe Espa
†Rocco Micciolo
‡Abstract
This paper addresses a debated issue in the economics innovation literature, namely the existence of increasing return to R&D expenditures and firm size on innovation output. It further explores how structural characteristics of the firm as well as contextual factors affect the dynamics of product innovation over a rela-tively long period of time. Taking advantage of an original and unique database comprising innovation data recorded on a monthly base we show that: (i) a negative binomial distribution model is able to predict with great accuracy the probability of having a given number of product announcement sent out in a month; (ii) constant returns to size and R&D expenditure may reasonably characterize the innovation production function of sampled firms; (iii) vertically integrated manufacturers as well as producers operating a larger product portfolio exhibit a higher propensity to introduce new products than their specialized competitors.
1
Introduction
This paper addresses some empirical issues concerning the innovative performance of busi-ness organizations operating in a high-technology context, the semiconductor industry. It specifically assesses the existence of increasing returns to R&D expenditures and firm size on the production of new components. Moreover, it explores how variables accounting for general characteristics of the firm (age and diversification) as well as contextual factors (geographical localization) affect the dynamics of product innovation.
Since their invention, semiconductor devices have been applied in an increasing number of markets ranging from computers to telecommunications, consumer electronics, auto-mobiles, aerospace and military equipments, home appliances, industrial systems (Tilton, 1971; Dosi, 1984; Langlois and Steinmueller, 1999). At the same time, relevant transfor-mations took place in the organization of economic activities along the semiconductors
∗Department of Management and Computer Science, University of Trento, via Inama, 5 (38100) Trento
Italy. e-mail: [email protected].
†Department of Economics, University of Trento, via Inama, 5 (38100) Trento Italy. e-mail:
‡Department of Sociology, Piazza Venezia, 41 (38100) Trento Italy. e-mail:
value chain (Macher et al., 1998; West, 2002; Tokumaru, 2006), the management of prod-uct standards and intellectual capital (Irwin and Klenow, 1994; Gruber, 2000; Stuart, 2000; Hall and Ziedonis, 2001), the emergence of regional clusters of semiconductor com-panies (Saxenian, 1994; Kim, 1998). All of this portrays the semiconductor industry as a peculiar context for empirically oriented research in the fields of industrial organization, strategic management, organizational behavior, etc.
Despite the extensiveness of the semiconductor economics literature, little attention has been paid to forces driving the introduction of incremental product innovations by in-cumbent firms, and how differences in the innovative behavior of competing agents evolve over time. Two rationales may help understand why so limited effort has been devoted to these issues. On one side, there is a tendency to overlook the role of incremental in-novations in the discussion of technical change. On the other side, there is a shortage of appropriate data on the output side of the innovation process, a somewhat relevant draw-back affecting the whole literature dealing with technological change. These shortcomings in the literature and the desire to foster our knowledge of what leads the sustained in-troduction of incremental innovations, represent the key motivations to undertake the present study.
The first goal of this paper is to provide original evidence on the innovative perfor-mance of a representative sample of firms operating in a setting where the introduction of new products, on a cost-effective and timely base, affects a firm’s ability to sustain its competitive position. Exploiting a unique data base comprising information on product announcements by leading semiconductor producers, for a relatively long period of time, we try to characterize the arrival of new products in accordance with any known prob-ability distribution function. Secondly, by matching this piece of information with data describing structural and strategic characteristics of the firm, we aim at verifying which factors affect the production of innovations. Thirdly, we take advantage of our innovation data being recorded on a monthly base to implement non-parametric methods for the analysis of recurrent events that allows us to properly handle the cumulativeness of the innovation activity.
The rest of this paper proceeds as follows. In section 2, we review the literature concerning determinants of innovative performance. In section 3, we provide descriptive statistics for innovation data and other characteristics of the firm. In section 4, we show results of the econometric analysis together with evidence from non-parametric methods applied to recurrent events. In section 5, we present a few concluding remarks.
2
Determinants of Innovative Performance
Schumpeter’s writings, in the first half of the twentieth century, originally appreciated the role of innovation as a key driver of economic growth, and inspired a large body of studies exploring the determinants and economic consequences of technical change. Schumpeter (1950) himself and the economic theorizing in the Schumpeterian tradition, support the idea that large corporations enjoy a relative advantage in the supply of innovations over
small business organizations1. Size emerges as a primary internal force driving
techno-logical innovation (Cohen and Levin, 1989; Cohen, 1995; Becheikh et al., 2006) and its relevance is motivated by several intertwined arguments2.
One set of justification refers to size per se. It is often claimed that large firms may exploit economies of scale in the financial market so as to secure finance for undertaking risky R&D projects more cheaply than small firms (Fisher and Temin, 1973). Under capital market imperfections large corporation may also be expected to have an advantage in securing finance for risky projects because size is associated with quickly accessible and stable flows of internally-generated funds (Cohen and Levin, 1989). Along with financial resources, large size is a prerequisite to attract the technical and managerial expertise a profitable innovation process requires. Only firms large enough to seize these resources will achieve the temporary monopoly power associated with innovation and will pursuit further technological advances so as to grasp future profits (Kamien and Schwartz, 1975). Apart from that, large organizations may attain rewards from innovation because they are able to ease the penetration of new products through comprehensive promotion and distribution facilities. Furthermore, they can establish strategic alliances and supplier relations, encourage the innovative behavior of partners involved and eventually benefit from their achievements (Rothwell and Dodgson, 1994). Another set of justifications relate to the R&D technology and its complementarities with other business functions. One claim is that there are economies of scale in the research and development function itself that only large corporations can take advantage of. This is a two-parts argument. On one side, a large R&D staff can be more efficient than a small one (Fisher and Temin, 1973). On the other side, an R&D staff of a given size may be more productive in a large firm “as a result of complementarities between R&D and other non-manufacturing activities” (Cohen, 1995, p. 184).
The literature has also discussed factors that convey a relative advantage to small firms in undertaking innovative activities. Rothwell and Dodgson (1994) argue that small business organizations enjoy behavioral advantages as opposed to material advantages accruing to larger competitors. Specifically, bureaucratic structures may hinder the un-dertaking of new projects due to resistances spreading across their organizational layers, while the entrepreneurial management of small firms may benefit from rapid decision-making to grab technological and market opportunities. In addition, the lean and focused organization of small firms, by placing innovation activity at the center of its competitive strategy, safeguards and endorses the creative impulses of technical personnel, the same stimuli that the conservatism of hierarchical structures might thwart and frustrate (Acs and Audretsch, 1990).
1This is the dominant logic according to the Schumpeterian Mark II model of innovation “characterized
by relevant barriers to entry for new innovators, the prevalence of large established firms in innovative activities and the dominance of a few firms which are continuously innovative through the accumulation over time of technological capabilities” (Malerba and Orsenigo, 1996, p. 60).
2Arguments supporting the Schumpeterian hypothesis, discussed in this paper, are primarily those
advanced in the economics literature. See Damanpour (1992) for a complementary discussion based on the organizational theory literature. Moreover, in line with Nelson and Winter (1982) interpretation of Schumpeter’s work and the little support from existing empirical evidence (Cohen, 1995), we disregard the effect of ex-ante market structure over innovative behavior and concentrate on the relationship between firm size and innovation only.
Empirically oriented works in this tradition have typically interpreted the findings that R&D rises proportionately with firm size, among R&D performers, as indicating that size offers no advantage in the production and commercialization of innovations (Cohen, 1995). However, deriving such a conclusion from the empirical evidence concerning the association between firm size and innovative effort may be meaningless, unless additional assumptions are taken into account. Indeed, Fisher and Temin (1973) and Kohn and Scott (1982) show that, to the extent that Schumpeter’s hypothesis can be given a clear formulation, it must refer to a relationship between innovative output and firm size, not to a relationship between R&D spending and firm size. This observation stimulate scholars approaching the Schumpeterian conjecture to look for appropriate measures of any output of the innovation process3.
Patent counts and patent citations come out as a first, valuable option. They are traditional indicators of technological activities whose use has increased because it has been recognized the influence of technical change in the competitiveness and growth of firms, and because improvements in the technologies of information storage and retrieval permitted a systematic access to the information contained in patent documents (Pavitt, 1985; Griliches, 1990). Their advantages notwithstanding, patent statistics suffer from shortcomings which recommend caution when they are used to assess the innovative per-formance of organizations (Pavitt, 1985; Archibugi and Pianta, 1996; Kleinknecht et al., 2002). Indeed, the raw count of patents and patent citations can be considered a mea-sure of inventive performance rather than innovative success (Freeman and Soete, 1997). However, even when patents are treated as an intermediate output of R&D activities puzzles and anomalies emerge. Econometric analysis have detected no time-lag between R&D input and patenting outputs at the firm level (Hall et al., 1986), and “this raises the unanswered question of when patenting occurs in the R&D sequence. If it typically takes place early in the innovation process, it will be a poor measure of the output of development activities”(Patel and Pavitt, 1995, p. 22).
In recent years, a remarkable effort has been made to put forward satisfactory alterna-tives which cope with drawbacks affecting traditional indicators. New indicators have thus appeared that include shares of imitative and innovative products in a firm’s total sales, the collection of major innovations by means of interviews with technical experts,4 and
the count of new product and process announcements in trade, engineering and technical journals (Kleinknecht and Bain, 1993; Kleinknecht et al., 2002). The latter, known as a literature-based innovation output indicator (Coombs et al., 1996; Flor and Oltra, 2004), is considered an ”object” approach to innovation measurement5 since it concentrates on
the innovations themselves. It represents an adequate indicator of innovative performance
3Needless to say that the availability of reliable data on the output side of the innovation process is a
major concern also for policy makers interested in the sources of innovativeness, the right incentives to promote it and the ultimate impact of technological change over social welfare.
4This method was used to construct the SPRU Database, a collection of major technical innovations
in British industries over the period 1945-1983 (Pavitt et al., 1987)
5The literature dealing with innovation indicators distinguishes two basic types of approaches: (i) a
“subject” approach which focuses on the innovating agent and relies upon firm surveys to gather data on firm-level innovation activity; (ii) an “object” approach which focuses on the objective output of the innovation process and identifies technological innovation through expert appraisal or new product announcement (Archibugi and Pianta, 1996; Smith, 2005)
when one considers results for companies in terms of the degree to which they actually introduce inventions into the market (Hadgedoorn and Cloodt, 2003). Besides, it offers remarkable advantages over extant alternatives: it is a direct measure of the market in-troduction of new products and services; data are relatively cheap to collect and publicly available, thus they can be obtained without contacting the firm through questionnaires; it is possible to split the data by type of innovation, market niches, degree of complex-ity; and finally, “the fact that an innovation is recognized by an expert or a trade journal makes the counting of an innovation somewhat independent of personal judgements about what is or is not an innovation” (Smith, 2005, p. 161).
An outstanding example where the indicator has been used is the US Small Business Administration’s Innovation Data Base, consisting of 8074 innovations commercially in-troduced in the United States in 1982 (Edwards and Gordon, 1984). Using these data for a sample of more than two hundred industries, Acs and Audretsch (1988) found that the number of innovations commercialized increased less than proportionately than R&D expenditures. Later studies estimating a firm production function for innovation output on the same database, found that decreasing returns to firm size and R&D expenditures were the norm among U.S. companies at the beginning of the 1980’s (Acs and Audretsch, 1990, 1993). Spurred by this research, a series of contributions published during the 1990s explored the innovativeness of large and small firms in other countries (Kleinknecht and Bain, 1993; Coombs et al., 1996; Santarelli and Piergiovanni, 1996; Wakasugi and Koyata, 1997). They support the idea that small and medium sized companies tend to introduce a larger share of innovations than their other contributions to the economy (e.g. employees, R&D spending, etc.) (Tether, 1998). Small companies actually account for a share of total innovations that is far larger than their share of employees, and record a higher number of innovations per unit of R&D expenditures. On the top of this, although a positive correlation between R&D expenditures, or alternatively firm size, and innovation output has been found (Becheikh et al., 2006), scant evidence supports the idea that increasing returns exist in product development.
Limitations are still there, however, that prevent us from considering conclusions from previous research as unambiguous. Most of the published works analyze only a single cross section of data, thus neglecting how firm size affects innovativeness over time (Stock et al., 2002). Besides, the interpretation of the empirical evidence so far collected strongly de-pends on the assumption of equivalent economic value in innovations introduced. Whereas normally unstated, this assumption may be misguiding and the conclusions relating inno-vativeness and firm size may dramatically change when it is properly taken into account (Tether, 1998).
The present study draws upon the literature-based innovation output method to in-vestigate the Schumpeterian hypothesis using firm-level data from the semiconductor industry. Our base line analysis explores how firm size and R&D investments affect the commercialization of incremental product innovations by established semiconductor producers. Although sometimes underemphasized in discussion of technical change, incre-mental innovations account for long periods of time in the stages through which technol-ogy evolves (Tushman and Anderson, 1986), and they significantly affect a firm’s ability to sustain its market position (Rosenberg and Steinmueller, 1988). Since incremental innovations elaborate and extend a particular dominant design, while reinforcing the
ca-pabilities of established organizations, they result particularly valuable for firms operating in mature industries (Henderson and Clark, 1990). Qualitative evidence from companies’ reports corroborates this argument and supports the idea that introducing new products, on a cost-effective and timely base, is a major concern for companies operating in the semiconductor industry.
Afterwards, we extend our base line specification to include other general, strategic and contextual determinants of a firm’s innovativeness. We take into account how aging affects organizational innovation, an issue not yet adequately addressed in the otherwise extensive literature6 dealing with organizational factors supportive of technological change
(Becheikh et al., 2006). On the empirical ground, the net effect of age on innovation hinges on two opposite forces. On one side, the accumulation of knowledge and organizational competence positively affect a firm’s ability to pursuit technological advances and improve its innovation rate. In many technologies, current period achievements strongly depend on previous effort and learning that, as time goes by, develop into capabilities to innovation and to profit from innovation (Nelson, 1991). On the other side, if aging leads to rigidities in communication flows within the boundaries of the firm, and rivalry towards technical advances thriving in the surrounding environment, firms will produce a smaller amount of innovations as they get older (Sorensen and Stuart, 2000).
The strategic choice of pursuing a higher degree of vertical and horizontal specializa-tion rather than integrating along the value chain and/or offering a diversified products portfolio may ultimately influence the firm’s innovative output. Once again the balancing of opposite forces (e.g. the nature and complexity of the innovation under scrutiny, the need of complementary assets, the appropriability regime and the technological oppor-tunities characterizing the competitive environment) will determine the net impact that a firm’s boundaries profile has over its innovative rate. Vertically specialized producers may achieve higher innovative scores than their integrated counterparts because of their alleged dominance in isolating and solving problems. Likewise, horizontally specialized firms may outperform diversified competitors deploying an array of competing units to tackle a specific problem (Robertson and Langlois, 1995). Conversely, diversified produc-ers may have more opportunities to exploit the unpredictable results of research activities (Nelson, 1959) and complementarities arising out from a broader and coherent portfolio of activities where a single innovation is closely tied with a set of following ones (Nelson, 1991; Teece et al., 1994).
3
Database and Descriptive Statistics
3.1
Sample
The working sample employed in this study comprises 95 companies operating in the semiconductor and related device industry (SIC CODE 3674). The procedure used to select these firms is based on the following criteria: 1) we only consider incumbent firms
6Notwithstanding the limited attention thus far obtained, the topic is quite important insofar as it
is tidily associated with the theme of whether aging has positive or negative effects over organizational functioning, an prominent issue within organizational ecology studies (Sorensen and Stuart, 2000)
which continuously operated in the semiconductor industry during the period 1997-2004; 2) we select among them only those companies for which complete data about product introductions (for the period 1998-2004) and financial statements (for the period 1997-2003) were available. This screening procedure implies that only listed companies remain in our sample, while privately held firms and operating divisions of large conglomerates (primarily Japanese producers) are not covered in our analysis.
Detailed information on the product innovation activity of surveyed companies is avail-able. We gathered monthly data on product announcements which, released by semi-conductor companies, appear on technical journals only after a positive assessment of technical experts. Interviews with industry operators clarified that products that may get a press release on trade, engineering and technical journals are: (i) a new product family, (ii) a new member of an existing family with a new feature, (iii) a new product with a substantial enhancement of existing features7. Accordingly, we can assume that
innovations involved in our analysis coincide with technologically improved products as described in the Oslo Manual (Oslo Manual, 1997; p. 32)
The availability of such data distinguishes our analysis from previous research and allows us to appreciate the dynamics of innovation activities in great details. Comple-mentary data on firm size, R&D expenditures, and the vertical boundaries of the firm are also available8. In what follows we provide descriptive statistics concerning the variables
of interest for our investigation, while in the next section we will focus on the existence of increasing return to R&D and/or size in the product innovation function and the dynamics of product introductions.
3.2
Product Innovation
Following an “object” approach to innovation indicators (Smith, 2005) we use product announcements as a proxy of the innovative performance of the firm. Data on product announcements for surveyed companies were gathered from trade, engineering and tech-nical journals accessible through multiple sources: among them are the Gale Thompson’s PROMT database, the Markets and Industry News database, the OneSource database, and press releases available on companies’ web sites. We carefully examined a huge num-ber of product releases in order to select announcements describing product introductions (excluding other events like product enhancement, product information, product develop-ment, etc.) and delete duplicates in the collection of announcements. We ended up with a unique collection of about 8470 releases concerning semiconductor devices commercialized during the period 1998-2004.
Semiconductor firms included in our sample released, on average, slightly more than one product announcement per month (Table 1). This value remains quite stable along the entire period, apart from a peak in 2002, just after the downturn involving the whole electronic industry. This trend is confirmed by the variance mean ratio which is constantly
7On the contrary, products for which semiconductor producers do not generally issue a press release,
and technical journals do not even take into account, are: (i) an existing product in a new package, (ii) an existing product with incremental changes in features.
8Sources of financial and economic data are Compustat, the Competitive Landscaping Tool and the
Table 1: Descriptive statistics for product announcements observed on a monthly base
Mean Variance Median Min Max Variance/Mean 1998 0.74 1.50 0 0 10 2.04 1999 0.99 2.31 0 0 10 2.34 2000 1.04 2.48 0 0 10 2.38 2001 1.12 2.88 1 0 12 2.57 2002 1.24 3.82 1 0 19 3.08 2003 1.18 3.08 1 0 12 2.61 2004 1.09 2.86 1 0 11 2.62
above a value of two (we will comment more on such a value in a while) and reaches a maximum of 3.08 in year 2002. The specificity of this year further emerges if we consider that the maximum number of product announcements per month in 2002 equated nine-teen, a pretty higher value than those observed in other years. The low values computed for the median finally suggest that the distribution of product announcements is right skewed meaning that most firms introduce few components while a very small number of producers account for a large fraction of the innovation output that we observe9.
We carry on our investigation by assessing whether the arrival of new products can be modeled according to any known probability distribution function. The reference point for count response variables (variables which takes on only nonnegative integer values) is the Poisson distribution which is characterized by its well known equidispersion (equality of mean and variance) property10. Figures in the last column of Table 1 show, however,
that this assumption is too restrictive for the data we are exploring; the ratio between the variance and the mean is, in fact, above the unity (overdispersion). An alternative probabilistic model which is commonly used to handle the overdispersion problem is the negative binomial distribution (Hall et al., 1986; Crepon et al., 1998). Under this model the probability of having exactly y product announcements in a given period is equal to:
p(y) = Γ(s + y) Γ(s)y! µ s s + m ¶sµ m s + m ¶y
where m is the expected value of the number of product announcements, s an overdis-persion parameter and Γ(t) is defined as Γ(t) = R0∞ut−1e−udu (t > 0). Table 2
com-pares the expected distribution of product releases under the negative binomial model with observed frequencies. The specified model is able to predict with great accuracy the probability that one firm sends out a given number of announcements per month (χ2 = 3.22 ρ = 0.779). Likewise, in all other years, but 2004, we could not reject the
null hypothesis that the arrival of product announcements in a given month can be well represented by a negative binomial distribution. We will exploit this piece of evidence
9When data on product announcements are aggregated on a yearly base we get an average number of
releases which ranges from 8.83 in 1998 to 14.82 in 2002. The corresponding median takes on a minimum value of 5 and a maximum of 9 in years 1998 and 2003, respectively, while the variance mean ratio ranges from 11.52 to 22.77.
10Under this model the probability of observing exactly y product announcements in a given period is
in the remainder of the paper when considering different regression models to investigate the innovation production function.
Table 2: Observed and expected number of product announcements by month (Year 2000)
Number of product Observed Expected under announcements Negative Binomial
0 591 594.8 1 274 258.5 2 123 131.2 3 61 69.8 4 39 38.0 5 22 21.0 6 13 11.7 7 8 6.5 More than 8 9 8.2 TOTAL 1140 1140
3.3
Firm’s Characteristics
Besides their innovative behavior, structural characteristics of companies included in our sample deserve some comments at this point. Most of the firms, eighty two, are public companies headquartered in the United States, six are located in Europe and the remain-ing seven are East Asian producers. The mean age is 24 years at the end of the observation period, with a standard deviation equal to 13 and a range of variation spanning from a minimum of 7 to a maximum of 57 years.
The organization of economic activities along the value chain is an important factor to differentiate firms operating in the semiconductor industry. Spurred by the adoption of the Complementary Metal-Oxide Semiconductor (CMOS) process at the beginning of the 1980s (Macher et al., 1998), the industry went through a process of vertical disintegration that led to the emergence of two types of firms commercializing physical components. On one side we have integrated device manufacturers (henceforth IDMs), companies that internally realize the design, production and marketing of components they sell. On the other side are fabless, companies that outsource manufacturing services to external suppliers while performing in house the design and marketing of products. When grouping sampled companies according to this structural feature we obtain two clusters comprising, respectively, 47 IDMs and 48 fabless.
Unlike previous research, that has generally looked at the semiconductor industry as an homogeneous setting, we take into consideration the high degree of within indus-try heterogeneity by weighing up the horizontal boundaries of the firms. We adopt an industry breakdown that distinguishes six product markets and allows us to cluster com-panies according to the number of markets they operate. The industry breakdown we are considering comes out from a taxonomy of semiconductor components arranged and made courteously available by STMicroelectronics, Inc. The six product markets are: 1) Discrete Components; 2) Optoelectronics & Sensors; 3) Standard & Commodities; 4)
Table 3: Sample Statistics
Mean Standard First Median Third Min Max Deviation Q Q
Product announcementsa 12.74 14.8 3 7 16 0 112
Employmentb,c 2.93 0.93 258 743 3,745 19 88,447
R&D ($M)b,c 4.61 0.89 14.26 36.27 132.89 0.22 4,370.0
Market share (%)b 0.72 1.86 0.04 0.14 0.57 0 14.73
Age of the firm in 2004 24 13 16 20 30 7 57
DR&D/Employees=0 (N =19) 0.03
DU.S.f irm (N =574) 0.86 DF abless f irm(N =336) 0.51
DSingle business f irm (N =350) 0.53
a 665 Observations (95 firms) 1998-2004
b 665 Observations (95 firms) 1997-2003
c Arithmetic means are shown for these variables, along with the standard deviation of the log
Microcomponents; 5) Memories; 6) Application Specific Devices. Relying on this piece of information we differentiate companies as either single business or diversified firms, with the former representing the 53% of the whole sample. A joint analysis of the vertical and horizontal boundaries of the firms clarifies that fabless companies are typically involved in a single market (75%), whereas the percentage of single business producers among IDMs is equal to 25.5%.
Firm size is proxied by the total number of employees at the end of the year. During the seven years of observation the average value of this variable is equal to 5,720, the median is 743 and the range of variation goes from a minimum of 19 to a maximum of about 88,500. Sample firms undertake expenditures in research and development averaging US$ 205 Millions, which implies an average value of R&D expenditures per employee equal to US$ 63 thousands. The distribution of R&D investments is right skewed, as well as the one describing corporate size. The median is somewhat above US$ 36 Millions, the third quartile is almost US$ 133 Millions while the ninety percent of firms spends at most US$ 585 Millions. Another skewed distribution describes the pattern of market shares, computed as the ratio of total semiconductor sales accruing to each company, in a given year, over the total value of semiconductor shipments according to World Semiconductor Trade Statistics Inc11. Sampled companies gain on average a portion of
the total market lower than one percentage point (0.71%). Only one company, Interl Corp., wins a share larger than ten percentage points with a mean value of 16.4% along the period of observation.
11WSTS Inc. is a non-profit mutual benefit corporation whose Charter and Bylaws define services for
the world semiconductor industry, including management of the collection and publication of trade net shipments and semiconductor industry forecasts.
4
Econometric Analysis
4.1
The Innovation Production Function
Borrowing from extant research dealing with innovation production functions (Crepon et al., 1998) and in accordance with the piece of evidence stemming from the above descriptive statistics, we move forward our investigation assessing the explanatory power of variables of interest in our study. We accomplish this task by estimating different negative binomial regression models which represent an attractive option to cope with the overdispersion problem in applied works (Cameron and Trivedi, 2005). Under the specified model the expected number of product announcements for each firm, in a given year, is an exponential function of some firm’s characteristics Xit:
E[Iit|Xit] = λit= exp(Xitβ + γt)
where i and t index, respectively, the firm and the year, while γtis a time-specific mean12.
In our baseline specification the vector xit includes variables measuring the firm’s R&D
expenditures and its size. Both regressors are lagged one period with respect to the de-pendent variable and expressed on a logarithmic scale, thus allowing to give an elasticity interpretation to the estimated β coefficients. The base line specification is later aug-mented by means of a set of variables assessing how a firm’s age, the choice of operating as a vertically specialized producer rather than an integrated manufacturer, and the fact that the firm is headquartered in the United States influence its innovative performance. Since the last two variables remain constant over time, we resort to a pooled negative binomial model rather than any other alternative (conditional fixed effects or random effects models) that would otherwise sweep these effects out.
Table 4 presents estimated coefficients associated with explanatory variables included in our econometric model. Figures reported in the first two columns are at odds with Schumpeterian predictions. Estimated parameters suggest us to reject the hypothesis that increasing returns associated with either R&D spending or size per se characterize the production of new components in the semiconductor industry. Computed elasticities of 0.924 (st.err. = 0.09) for R&D spending, and 0.956 (st.err. = 0.08) for firm size, are nevertheless pretty close to unity, thus implying that constant returns might reasonably describe the innovation process of sampled firms. Indeed, separate Wald tests do not reject the null hypothesis that the two coefficients are statistically equal to one13. Our
estimates are in line with previous finding by Hall and Ziedonis (2001) which calculate an elasticity of 0.989 (st.err = 0.036) with respect to R&D investments for a sample of ninety
12The expected number of product announcements for each firm in a given year corresponds to the
first moment of the negative binomial distribution, E[I|λ] = E[I|µ, α] = µ (assuming λ = µα), where µ is a deterministic function of regressors x. In the most common variant of the negative binomial model, known as NB2 model, α is a parameter to be estimated that captures the unobserved heterogeneity in the data. Under this variant the variance function exceeds the mean and is equal to V [I|µ, α] = µ(1 + αµ) (Cameron and Trivedi, 2005, p. 676).
13We obtain a Wald test statistics of 0.71 (ρ = 0.40) and 0.30 (ρ = 0.59) when testing the null hypothesis
that coefficients associated with lagged R&D expenditures and lagged firm size are not statistically different from one.
Table 4: Product Innovation Estimates. Semiconductor Firms 1998-2004 (665 observations)
Variable Name Negative Negative Negative Negative Binomial (1) Binomial (2) Binomial (3) Binomial (4) Log R&D ($Th) or log R&D 0.924*** -0.282 0.140 per employee ($T h)a (0.09) (0.215) (0.175)
Log firm size (employees) 0.956*** 0.902*** 0.744*** (0.080) (0.108) (0.089) Dummy for no reported 2.965*** 1.107*** 0.674 1.037* R&D (or employees) (0.464) (0.296) (0.545) (0.469) Log Firm age (number 0.083
of years) (0.114)
Dummy for U.S. firms 0.565** 0.484* (0.199) (0.203) Dummy for fabless firms -0.687***
(0.155) Constant -2.029*** -0.687** -0.840 -0.432
(0.408) (0.231) (0.574) (0.528) Log pseudolikelihood -2214.9 -2138.1 -2109.4 -2084.5 Number of parameters 10 10 13 13
a Log R&D in column 1; log R&D per employee in columns three and four.
Notes: Standard errors in parentheses are heteroskedastic-consistent and robust to within cluster
correlation. Time dummies included in all specifications. The method of estimation is maximum likelihood for the Negative Binomial model.
Significance levels: * p < 0.05, ** p < 0.01, *** p < 0.001.
five U.S. semiconductor producers observed over the period 1979-1995, while employing patents as a measure of innovative output.
Column three in Table 4 shows results for an augmented version of our regression model where R&D and firm’s size are jointly considered along with a variable capturing the age of the firm and a dummy variable that takes on a value of one for companies whose headquarter is in the United States. In order to avoid confounding the size ef-fect with the R&D efef-fect we normalize the latter dividing R&D spending by the total number of employees. Under this specification the R&D coefficient sharply drops and becomes statistically insignificant, while the employment variable captures the entire size effect with a magnitude of 0.90. The estimated parameter measuring the impact of firm age, although positive, is not statistically significant14, whereas firms headquartered in
the United States present a significantly higher propensity to innovate than competitors located elsewhere in the world.
We finally study how results change when introducing a dummy variable that distin-guishes firms on the basis of how they organize activities along the semiconductor value
14This piece of evidence is in accordance with findings discussed in Hall and Ziedonis (2001). Conversely,
Sorensen and Stuart (2000) provide empirical support for the hypothesis that as organizations age they generate more innovation thus improving their capabilities to innovation
chain. As we have already seen vertically specialized producers represent approximately half of our sampled companies and are typically organized as single business companies. Moreover, they are quite smaller than vertical integrated producers, with an average num-ber of 647 employees against a mean value of more than ten thousand workers for the latter. Figures in the final column of Table 4 extends our knowledge of the innovative behavior of specialized producers, telling us that fabless companies tend to release a sig-nificantly lower number of product announcements than integrated manufacturers. Since fabless companies typically operate in a single market within the semiconductor indus-try, the Application Specific Devices (hereafter ASDs) market, it is important to assess how their innovative performance changes with respect to IDMs when only components introduced in this market are taken into account. The rest of this section exploits a non parametric approach to address this point along with other issues concerning the dynamics of product introduction.
4.2
Dynamics of Product Innovation
A potential drawback in many published works investigating the innovative behavior of business organization is the poor handling of a peculiar feature of innovation outcomes, namely their arrival time. Previous research employing either indicators based on the count of new product announcements or a raw count of patents has typically modeled the dependent variable as a sum of all announcements released, or patents applied for in a given calendar year15. This practice, although effective in several circumstances, compels
econometricians to treat innovation data like any other financial data recorded in fiscal income statements of the firm. This may unfortunately imply a misguided representation of the actual timing regulating the innovation process, and the neglect of spells of inno-vating behavior which occur in narrow defined time intervals within a year (Geroski et al., 1997).
Since an objective of this study is to provide a clue of the dynamics of product inno-vation, and since we may exploit original data which record product announcements on a monthly base for a relatively long period of time, a complementary analysis that avoids strong parametric assumptions about the recurrent event process may be worthwhile. Such an attempt has two advantages. On one side, it allows us to ascertain the robust-ness of our results through an assorted range of methodologies. On the other side, it gives the opportunity to choose, in a range of instruments, the ones that help disentangling distinctive features of the phenomenon we are going over.
In what follows we resort to the approach taken by Nelson (1988) and later developed by Nelson (1995) and Lawless and Nadeau (1995) which focuses on mean cumulative func-tions (hereafter CMF) to analyze processes of recurrent events without full probabilistic specification of the processes16. Define the cumulative mean function of the number of
events, product announcements in our case, Ni(t) occurring over the interval [0, ti] for
each firm i (i ∈ [1, . . . , K]) as M(t) = E[Ni(t)]. A non parametric and robust estimator,
15Among the few exceptions is the article by Sorensen and Stuart (2000).
16The approach employed in this section has been widely applied in studies concerning the analysis
of valve-seat replacements (Nelson, 1995), automobile warranty claims (Lawless and Nadeau, 1995), cutaneous epitheliomas (Canal et al., 2004)
ˆ
M(t), of this function is given by:
ˆ M(t) = t X s=0 ˆ m(s) = t X s=0 n(s) δ(s) (1)
where ˆM(t) is the mean number of product announcements observed at time s calculated
dividing the total number of announcements n(s) observed at time s by the number of firms δ(s) which are still under observation at time s. The associated variance estimator that we use to construct confidence interval for the mean function is the one proposed by Lawless and Nadeau (1995):
ˆ V (t) = K X i=0 " t X s=0 δi(s) δ(s)(ni(s) − ˆm(s)) #2 (2)
where δi(s) is equal to 1 if the i-th is still under observation at time s and 0 otherwise.
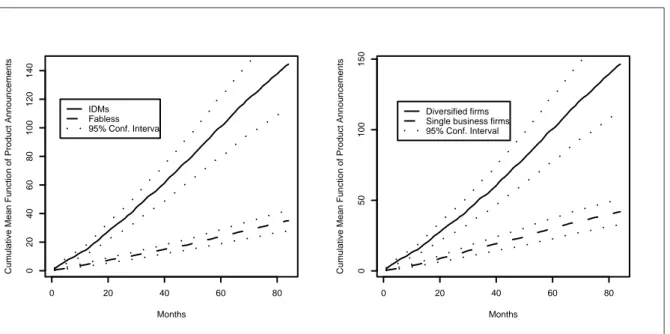
Figure 1 shows ˆM(t) for product announcements of integrated device manufacturers versus
fabless companies (left panel) and diversified firms versus single business producers (right panel), with associated 95% confidence intervals. It appears that vertically integrated firms are more likely to release product announcements than their specialized rivals, along the observation period. It is likewise clear, but not surprising given that IDMs are also horizontally diversified, that companies operating a wider product portfolio present a higher propensity to innovate than firms competing in a single product market. Overall, this findings corroborate results obtained in the previous section by negative binomial regressions. 0 20 40 60 80 0 20 40 60 80 100 120 140 Months
Cumulative Mean Function of Product Announcements
IDMs Fabless 95% Conf. Interval 0 20 40 60 80 0 50 100 150 Months
Cumulative Mean Function of Product Announcements
Diversified firms Single business firms 95% Conf. Interval
Figure 1: Estimated CMFs for specialized and diversified firms
Two further remarks concern the persistence of differences in the propensity to in-novate of specialized and vertically integrated firms, and the sensitiveness of observed differences when a narrow defined product market is taken into account. A plot of the
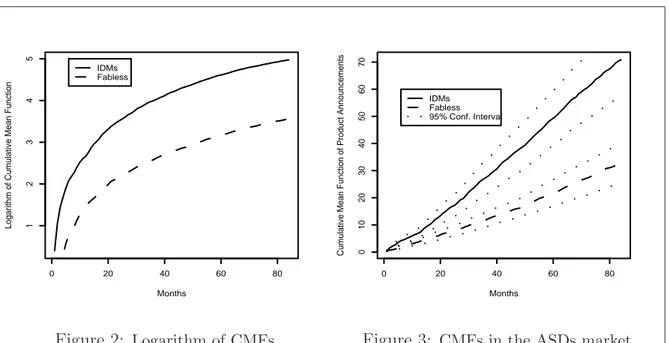
natural logarithm of ˆM(t) against time (Figure 2) shows that differences between
esti-mated values of CMFs for IDMs and fabless companies are approximately constant. This implies that discrepancies in the propensity to innovate of the two organizational profiles tend to be stable over time.
0 20 40 60 80 1 2 3 4 5 Months
Logarithm of Cumulative Mean Function
IDMs Fabless Figure 2: Logarithm of CMFs 0 20 40 60 80 0 10 20 30 40 50 60 70 Months
Cumulative Mean Function of Product Announcements
IDMs Fabless 95% Conf. Interval
Figure 3: CMFs in the ASDs market
We have already emphasized that fabless companies generally compete in just one out of six product markets resulting from the industry breakdown we adopted, the ASDs market. The latter comprises components like field programmable logics, display drivers, application specific integrated circuits and application specific standard products17;
over-all, a cluster of products that may compete closely among them, but do not compete directly with semiconductor devices in other product segments like transistors, dynamic random access memories, etc. Given that, the innovative performances of fabless compa-nies and integrated device manufacturers should be evaluated within this specific market rather than considering the whole semiconductor industry. To accomplish this task we selected from our working sample companies competing in the ASD market and kept only their product announcements describing the introduction of new components in this market. The resulting sample comprises eighty five companies (42 IDMs and 43 fabless) accounting for about 4370 product announcements. A plot of ˆM(t) against time (Figure 3)
shows that vertically integrated manufacturers outperform their specialized competitors even when the comparison is conducted at this narrow defined level of analysis. Although curves representing the estimated CMFs of the two groups are closer than what observed before, their confidence intervals do not overlap and are still distinguishable from each other. This finally suggests that differences in the innovative score of the two groups remain statistically significant.
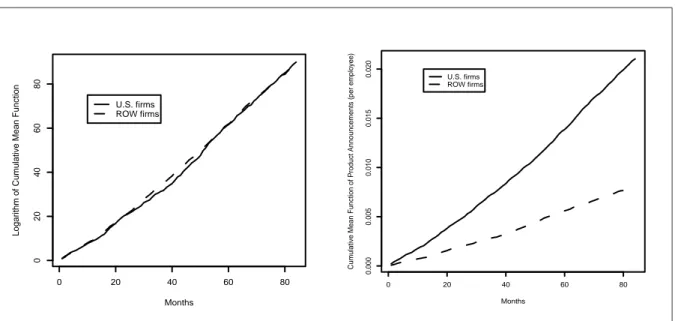
Something interesting comes out when we compare the cumulative mean functions of U.S. versus rest of the world companies. Apparently at odds with results in Table ??, the left panel in Figure 4 shows two overlapping functions associated with each group of
0 20 40 60 80 0 20 40 60 80 Months
Logarithm of Cumulative Mean Function
U.S. firms ROW firms 0 20 40 60 80 0.000 0.005 0.010 0.015 0.020 Months
Cumulative Mean Function of Product Announcements (per employee)
U.S. firms ROW firms
Figure 4: Estimated CMFs for U.S. and ROW firms
firms, thus implying a not significantly higher propensity to innovate for semiconductor producers headquartered in the United States. However, if we estimate the same mean cumulative functions taking into account the size of firms comprising the two groups (it amounts to properly modify the denominator of Eq. (1) in order to obtain CMFs of product announcements per employee) the two curves separate.
5
Conclusions
Whereas a large number of articles investigated the sources and economic consequences of technological innovation, weaknesses in how applied researchers commonly measure innovation prevent us from deriving unambiguous implications from the bulk of evidence so far collected. Two limitations in the existing literature deserve further attention. On one side, we need to properly frame the role of incremental innovations in discussion of technical change. Although sometimes underemphasized, incremental innovations account for long periods of time in the stages through which technology evolves (Tushman and Anderson, 1986). They reinforce the capabilities of established organizations (Henderson and Clark, 1990) and affect a firm’s ability to sustain its market position (Rosenberg and Steinmueller, 1988). On the other side, we are compelled to address shortcomings in traditional innovation indicators and to look for suitable alternatives. Overall, the often inappropriate measurement of incremental innovations and the lack of satisfactory evidence on factors driving their introduction urge an endeavor to fill the gap.
This paper tackled the above limitations using original data for a sample of semicon-ductor companies. Drawing upon the object approach to innovation indicators (Smith, 2005) we construct a database comprising information about all important incremental product innovations commercialized by incumbent firms during the period 1998-2004. The availability of monthly observations on product announcements distinguishes our contri-bution from previous research and allows us to properly describe the arrival of innovations.
We have shown that a negative binomial distribution model is able to predict with great accuracy the probability of having a given number of product announcement sent out in a month. Such a model outperforms the commonly used Poisson distribution in dealing with the heterogeneity characterizing the propensity to innovate of sampled com-panies. Building upon findings from our descriptive analysis, we have later addressed the innovation-size relationship, a landmark in the innovation literature. According to previous research (Crepon et al., 1998; Hall and Ziedonis, 2001), we estimated an innova-tion producinnova-tion funcinnova-tion where the dependent variable is measured as the total number of product announcements each firm released in a given year. The relevant explanatory variables are R&D spending and firm size. Estimated parameters do not support the idea that increasing returns, associated with any of the two variables, exist in the production of new semiconductor components. Nevertheless, Wald test statistics suggest us not to reject the hypothesis that estimated elasticities for R&D and firm size are statistically equal to one. As a consequence constant returns to firm size might reasonably describe the innovation process of sampled firms.
Thereafter, we augmented the base line specification of our model in order to assess how other general and strategic characteristics of the firm influence its propensity to innovate. This exploration suggests that vertically integrated manufacturers have a higher propensity to release product announcements than their specialized competitors. It is also the case that companies operating a larger product portfolio are more likely to introduce new components. A higher number of product announcements is also associated with companies headquartered in the United States, while there is no support for a statistically significant effect of aging on product innovation. To exploit the detailed information on the time arrival of product announcements, we finally resorted to a complementary analysis that avoids strong parametric assumptions about the recurrent event process. Drawing upon the approach developed in Nelson (1995) and Lawless and Nadeau (1995) we estimated cumulative mean functions of the number of product announcements for groups of firms identified according to their structural characteristics. The non-parametric approach corroborates findings arising out from negative binomial regression models, and provides further support for the idea that vertically integrated producers show a higher propensity to innovate than fabless companies.
A few remarks on desirable extensions of this study are noteworthy. It would be interesting to assess how estimated elasticities of product announcements with respect to R&D spending and firm size change when the technological and economic value of commercialized products is taken into account. In fact, Tether (1998) shows that the conclusions relating innovativeness and firm size may change when the normally unstated assumption of equivalent economic value of innovations is taken into account. It would be as well appealing to repeat our analysis including in the working sample both new entrants and firm leaving the semiconductor industry. It is indeed plausible that considering only incumbent firms induces a sample selection bias that significantly affect the estimated relationship between R&D expenditures (or firm size) and product innovation. Finally, it would be desirable to build upon the results obtained through the non-parametric approach and use event-history analysis so as to shed light over not yet uncovered features of the innovative behavior of business organizations.
References
Acs, Z. J. and Audretsch, D. B. (1988), ‘Innovation in large and small firms: an empirical analysis’, The American Economic Review 78(4), 678–690.
Acs, Z. J. and Audretsch, D. B. (1990), Innovation and Small Firms, The MIT Press. Acs, Z. J. and Audretsch, D. B. (1993), Analyzing innovation output indicators: The us
experience, in A. Kleinknecht and D. Bain, eds, ‘New Concepts in Innovation Output Measurement’, St. Martin’s Press, pp. 10–41.
Archibugi, D. and Pianta, M. (1996), ‘Measuring technological change through patents and innovation surveys’, Technovation 16(9), 451–468.
Becheikh, N., Landry, R. and Amara, N. (2006), ‘Lessons from innovation empiirical studies in the manufacturing sector: a systematic review of the literature from 1993-2003’, Technovation 24, 644–664.
Cameron, A. C. and Trivedi, P. K. (2005), Microeconometrics: Methods and Applications, Cambridge University Press.
Canal, L., Micciolo, R., Boi, S. and Cristofolini, M. (2004), ‘Recurrence analysis of cuta-neous epitheliomas’, Statistica Applicata 16(2), 143–157.
Cohen, W. (1995), Empirical studies of innovative activity, in P. Stoneman, ed., ‘Hand-book of the Economics of Innovation and Technological Change’, Blackwell, pp. 182– 264.
Cohen, W. M. and Levin, R. C. (1989), Empirical studies of innovation and market structure, in R. Schmalensee and R. D. Willig, eds, ‘The Handbook of Industrial Or-ganization’, Vol. II, Elsevier Science Publishers B. V.
Coombs, R., Narandren, P. and Richards, A. (1996), ‘A literature-based innovation output indicator’, Research Policy 25(3), 403–413.
Corsino, M. (2008), Three Essay on the Determinants and Economic Consequences of Product Innovation, PhD thesis, Sant’Anna School of Advanced Studies.
Crepon, B., Duguet, E. and Mairesse, J. (1998), ‘Research, innovation and productivity: An econometric analysis at the firm level’, Economics of Innovation and New Technology 7, 115–158.
Damanpour, F. (1992), ‘Organizational size and innovation’, Organization Studies 13(3), 375–402.
Dosi, G. (1984), Technical change and industrial transformation: the theory and an
ap-plication to the semi-conductor industry, London: Macmillan.
Edwards, K. L. and Gordon, T. J. (1984), Characteristics of innovations introduced in the us market since 1982, Technical report, Futures Group.
Fisher, F. M. and Temin, P. (1973), ‘Return to scale in research and development: What does the schumpeterian hypothesis imply?’, Journal of Political Economy 81, 56–70. Flor, M. L. and Oltra, M. J. (2004), ‘Identification of innovating firms through
technologi-cal innovation indicators: an application to the spanish ceramic tile industry’, Research
Policy 33(2), 323–336.
Freeman, C. and Soete, L. (1997), The Economics of Industrial Innovation, third edn, The MIT Press.
Geroski, P. A., Van Reenen, J. and Walters, C. F. (1997), ‘How do persistently firms innovate’, Research Policy 26(1), 33–48.
Griliches, Z. (1990), ‘Patent statistics as economic indicator: a survery’, Journal of
Eco-nomic Literature 28(4), 1661–1707.
Gruber, H. (2000), ‘The evoolution of market structure in semiconductors: The role of product standards’, Research Policy 29, 725–740.
Hadgedoorn, J. and Cloodt, M. (2003), ‘Measruing innovative performance: Is there an advantage in using multiple indicators?’, Research Policy 32(8), 1365–1379.
Hall, B. H. and Ziedonis, R. (2001), ‘The patent paradox revisited: An empirical study of patenting in the u.s. semiconductor industry, 1979-1995’, The RAND Journal of
Economics 32(1), 101–128.
Hall, B. H., Griliches, Z. and Hausman, J. A. (1986), ‘Patents and r and d: Is there a lag?’, International Economic Review 27(2), 265–283.
Henderson, R. M. and Clark, K. B. (1990), ‘Architectural innovation: The reconfiguration of existing product technologies and the failure of established firms’, Administrative
Science Quarterly 35(1), 9–30.
Irwin, D. A. and Klenow, P. J. (1994), ‘Product competition in microprocessors’, The
Journal of Political Economy 102(6), 1200–1227.
Kamien, M. I. and Schwartz, N. L. (1975), ‘Market structure and innovation: a survey’,
Journal of Economic Literature 13(1), 1–37.
Kim, S. R. (1998), ‘The korean system of innovation and the semiconductor industry: a governance perspective’, Industrial and Corporate Change 7(2), 275–309.
Kleinknecht, A. and Bain, D. (1993), New Concepts in Innovation Output Measurement, The MacMillan Press.
Kleinknecht, A., Van Montfort, K. and Brouwer, E. (2002), ‘The non-trivial choice be-tween innovation indicators’, Economics of Innovation and New Technology 11(2), 109– 121.
Kohn, M. and Scott, J. T. (1982), ‘Scale economies in research and developmnet: The schumpeterian hypothesis’, The Journal of Industrial Economics 30(3), 239–249. Langlois, R. N. and Steinmueller, W. E. (1999), The evolution of competitive advantage in
the worldwide semiconductor industry, 1947-1996, in D. C. Mowery and R. R. Nelson, eds, ‘The Sources of Industrial Leadership’, Cambridge University Press, pp. 19–78. Lawless, S. B. and Nadeau, C. (1995), ‘Some simple robust methods to for the analysis
of recurrent events’, Technometrics 37(2), 158–168.
Macher, J. T., Mowery, D. C. and Hodges, D. A. (1998), ‘Reversal of fortune? the recovery of the u.s. semiconductor industry’, California Management Review 4(1), 107–136. Malerba, F. and Orsenigo, L. (1996), ‘The dynamics and evolution of industries’,
Indus-trial and Corporate Change 5(1), 51–87.
Nelson, R. R. (1959), ‘The simple economics of basic scientific research’, Journal of
Po-litical Economy 67(3), 297–306.
Nelson, R. R. (1991), ‘Why do firms differ, and how does it matter?’, Strategic
Manage-ment Journal 12(Winter), 61–74.
Nelson, R. R. and Winter, S. G. (1982), An Evolutionary Theory of Economic Change, Cambridge, MA, and London: The Belknap Press.
Nelson, W. B. (1988), ‘Graphical analysis of system repair data’, Journal of Quality
Technology 20, 24–35.
Nelson, W. B. (1995), ‘Confidence limits for recurrence data - applied to costs or number of product repair’, Technometrics 37(2), 147–157.
Patel, P. and Pavitt, K. (1995), Patterns of technological activity: Their measurement and interpretation, in P. Stoneman, ed., ‘Handbook of the Economics of Innovation and Technological Change’, Blackwell, pp. 15–51.
Pavitt, K. (1985), ‘Patent statistics as indicator of innovative activities: Possibilities and problems’, Scientometrics 7(1-2), 77–99.
Pavitt, K., Robson, M. and Townsend, J. (1987), ‘The size distribution of innovating firms in the uk: 1945-1983’, The Journal of Industrial Economics 35(3), 297–316.
Robertson, P. L. and Langlois, R. N. (1995), ‘Innovation, networks and vertical integra-tion’, Research Policy 24(4), 543–562.
Rosenberg, N. and Steinmueller, W. E. (1988), ‘Why are americans such poor imitators?’,
The American Economic Review 78(2), 229–234.
Rothwell, R. and Dodgson, M. (1994), Innovation and size of firm, in M. Dodgson and R. Rothwell, eds, ‘The Handbook of Industrial Innovation’, Edward Elgar, pp. 310–324.
Santarelli, E. and Piergiovanni, R. (1996), ‘Analyzing literature-based innovation output indicators: the italian experience’, Research Policy 25(5), 689–711.
Saxenian, A. (1994), Regional Advantage: Culture and Competition in Silicon Valley and
Route 128, Cambridge, MA: Harvard University Press.
Schumpeter, J. A. (1950), Capitalism, Socialism, and Democracy, third edn, New York: Harper.
Smith, K. (2005), Measuring innovation, in J. Fagerberg, D. C. Mowery and R. R. Nelson, eds, ‘The Oxford Handbook of Innovation’, Oxford University Press, pp. 148–179. Sorensen, J. B. and Stuart, T. E. (2000), ‘Aging, obsolescence, and organizational
inno-vation’, Administrative Science Quarterly 45(1), 81–112.
Stock, G. N., Greis, N. P. and Fischer, W. A. (2002), ‘Firm size and dynamic technological innovation’, Technovation 22(9), 537–549.
Stuart, T. E. (2000), ‘Interorganizational alliances and the performance of firms: a study of growth and innovation rates in a high technology industry’, Strategic Management
Journal 21(8), 791–811.
Teece, D. J., Rumelt, R. P., Dosi, G. and Winter, S. (1994), ‘Understanding corporate coherence. theory and evidence’, Journal of Economic Behavior and Organization 23, 1– 30.
Tether, B. S. (1998), ‘Small and large firms: Sources of unequal innovations’, Research
Policy 27(7), 725–745.
Tilton, E. (1971), International Diffusion of Technology: The Case of Semiconductors, Washington D.C.: The Brookings Institutions.
Tokumaru, N. (2006), ‘The organizational evolution of innovative activity in the semicon-ductor industry: Technological specialization and diversification’, Economics of
Inno-vation and New Technology 15(6), 591–603.
Tushman, M. L. and Anderson, P. (1986), ‘Technological discontinuities and organiza-tional environments’, Administrative Science Quarterly 31(3), 439–465.
Wakasugi, R. and Koyata, F. (1997), ‘R&D, firm size and innovation outputs: are japanese firms efficient in product development?’, Journal of Product Innovation Management 14, 383–392.
West, J. (2002), ‘Limits to globalization: Organization homogeneity and diversity in the semiconductor industry’, Industrial and Corporate Change 11(1), 158–188.