DETERMINANTS OF FOREIGN DIRECT
INVESTMENT IN ASIAN COUNTRIES:
AN EMPIRICAL ANALYSIS
G. Rod Erfani
Transylvania University, USAJack Berger
Indiana University, USAReceived: December 24, 2019 Accepted: March 16, 2020 Online Published: May 20, 2020
Abstract
The increasing importance of foreign direct investment (FDI) in the global economy manifests the efforts of countries to attract foreign investment. The purpose of this paper is to examine empirically the determinants of inward FDI for a panel of Asian countries. A pooled ordinary least squares (OLS), semi-log fixed-effects (FE) regression model is utilized to analyze the determinants of FDI in a sample of six Asian countries. The balanced panel data consists of India, Singapore, China, South Korea, Turkey, and Malaysia from 1995-2013. The dependent variable is FDI net inflows. The explanatory variables include democracy, inflation, human capital, economic growth, domestic investment, trade openness, and financial development. The fixed effects regression results show all variables with exception of the financial development variable are statistically significant and have the expected sign.
Key words: Foreign Direct Investment; Global Trade; Economic Growth and Development.
1. Introduction
Traditionally, developed countries have dominated both foreign direct investment (FDI) inflows and outflows. However, since the early 1990s, globalization has significantly increased the relative importance of FDI inflows into developing countries. While worldwide FDI inflows decreased from 2015 to 2018, FDI inflows into developing countries has remained relatively stable (UNCTAD 2019). This is consistent with recognized trends over the past 20 years during which middle-income and low-income countries have slowly accounted for an increasing proportion of FDI inflows. The potential benefits of FDI flows into developing countries may include higher economic growth and development resulting from additional capital resources, transfer of technology, entrepreneurial skills, and the training of their labor force. However, the realization of these potential benefits remains a subject of controversy. The importance of FDI in the international economy has greatly increased since the 1980s. Privatization and liberalization
of the service sector, such as telecommunications, transportation, and public utilities, have stimulated more investment opportunities. The increasing importance of FDI in the global economy reflects the efforts of countries to attract foreign investment. In order to encourage foreign investment, developing countries provide a variety of economic incentives to foreign investors, such as temporary tax exemptions, investment subsidies, and duty-free imports of capital goods. Developing countries have a higher likelihood of receiving net capital inflows, since a capital-scarce country (e.g., a developing country) is more likely to have a higher return on its investments than a capital-abundant country (e.g., a developed country).
The purpose of this paper is to examine empirically the determinants of inward FDI for a panel of Asian countries. A pooled ordinary least squares (OLS), semi-log fixed-effects (FE) regression model is utilized to analyze the determinants of FDI in a sample of six Asian countries. The panel data consists of India, Singapore, China, South Korea, Turkey, and Malaysia from 1995-2013. Furthermore, a Hausman test employed to determine whether a fixed or random effects model is preferred. The empirical findings of this study are of particular interest to policymakers in developing countries as they adopt economic policies to attract FDI inflows.
Multinational corporations (MNCs) increase the level of world income by reallocating resources between countries. MNCs function as a solution to the lack of national savings many developing countries experience. MNCs are valuable sources of foreign currency due to their stability and longevity in the host country. FDI has shown “the most resiliency to economic and financial crises” (UNCTAD 2018). This stability is evidenced by the heavily supported notion that FDI has been the most stable component of the balance of payments over the past 15 years. In contrast, debt-related flows and portfolio equity flows, two other sources of foreign currency, are volatile to economic conditions. History has shown this to be true as developing countries continue to rely heavily on debt from foreign commercial banks (Demirhan 2008). Portfolio equity investment is more volatile than FDI as it can be sold off quickly and does not require building of physical facilities. Due to the diffusion of technology and inflow of capital, FDI originating from MNCs provides many benefits, including increases in tax revenue, exports, product availability, human capital, employment/job creation, and decreases in production costs. Thus, in the words of Adam Smith, “by pursuing [their] own interest, [MNCs] frequently promote that of the society more effectually than when [they] really intend to promote it” (Smith 2003, originally published in 1776).
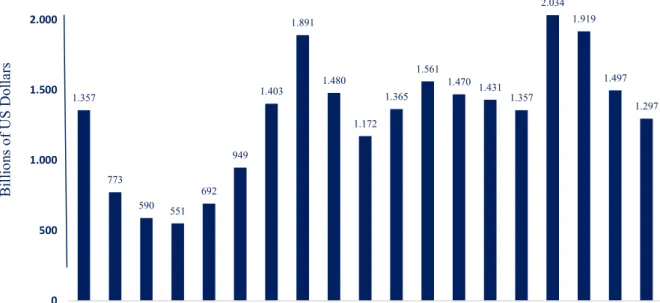
According to the 2018 UNCTAD report, inflows are higher on average in developing and transition economies. The Hecksher-Ohlin (HO) model can explain the higher rates of return in developing countries. The HO model theorizes that countries with higher relative endowment in capital (i.e., developed countries) will export capital to countries with lower relative endowment in capital (i.e., developing countries) in order to gain a higher rate of return. According to the 2019 UNCTAD’s World Investment Report, FDI inflows decreased from $1.5 trillion to $1.3 trillion (13%), between 2017 and 2018 (Figure 1). While worldwide FDI inflows decreased for the third consecutive year in 2018, FDI inflows into developing countries increased and remained relatively stable (Figure 2 and Figure 3). The share of developing countries of global FDI inflows increased from 46% to a record 54% between 2017 and 2018 (Figure 2). FDI inflows to developing countries in Asia and Oceania increased by about 4%, equating to US$513 billion in 2018, with the majority being inflows to China/Hong Kong, Singapore, and India. Asian countries are the world's top recipients of FDI inflows, accounting for 33% of global FDI inflows. Asia and its inflows of FDI as a percentage of world FDI inflows increased from 25% in 2016 to 33% in 2017 (UNCTAD 2018). With regard to the organization of the paper, we review key literature on determinants of FDI (Section II). In section III, we describe methodology and data used to examine the determinants of FDI inflows for a
representative panel of developing countries. Then, we report empirical findings of our study (Section IV). Finally, we summarize our main findings, draw conclusions, and suggest implications for economic policy (Section V).
Figure 1 – Global Foreign Direct Investment Inflows (annual) US dollars at current prices in billions
Source: World Investment Report (2019), UNCTAD, United Nations
Figure 2 – Foreign Domestic Investment Inflows Global and by Group of Economies, 2017 and 2018 (Billions of US dollars)
Source: World Investment Report (2019), UNCTAD, United Nations
1.357 773 590 551 692 949 1.403 1.891 1.480 1.172 1.365 1.561 1.470 1.431 1.357 2.034 1.919 1.497 1.297 0 500 1.000 1.500 2.000 2.500 2000 2001 2002 2003 2004 2005 2006 2007 2008 2009 2010 2011 2012 2013 2014 2015 2016 2017 2018 B il lio ns o f U S D ol la rs 759 475 494 155 414 691 1497 557 342 513 147 459 706 1297 0 200 400 600 800 1000 1200 1400 1600 Developed economies Transition economies Developing economies: Asia and Oceania Developing economies: America Developing economies: Africa Developing economies World
Billions of US Dollars
.
Figure 3 – Foreign Domestic Inflows Global and by Group of Economies, 2000-2018 (Billions of US dollars)
Source: World Investment Report (2019), UNCTAD, United Nations
2. Review of Literature
This study examines the determinants of FDI in a sample of six Asian countries, consisting of India, Singapore, China, South Korea, Turkey, and Malaysia. Many past studies include some, but not all, of the aforementioned countries. In our study, an econometric model is developed to examine relevant explanatory variables with their respective proxies, utilizing the panel of selected countries for the study period of 1995-2013.
Trade openness is one of the most common explanatory variables found in related literature. In Kumari (2017), Williams (2015), and Das (2017) studies, trade openness is positive and insignificant. In contrast, trade openness is positive but significant in Ranjan (2011) and Tsaurai (2017). The most universally accepted proxy for trade openness is exports plus imports as a percentage of GDP. In an interesting study by Ali Asghar (2016), four different variables for trade openness are employed interchangeably, namely, exports/GDP, imports/GDP, (exports + imports)/GDP, and (exports + imports)/GDP per capita. Applying a random effects regression model to a panel data of South Asian countries for the study period of 1998-2010, Asghar finds all four variables to be significant. The results show that each independent proxy is positive and significant, highlighting the importance of trade openness as a determinant of FDI. Market size and economic growth are other commonly used variables in the literature studying the determinants of FDI. GDP and GDP per capita are frequently used as a proxy for market size. GDP growth and GDP per capita growth are often used as a proxy for growth. Economou et al. (2017) and Kumari (2017) find market size to be positive and significant. However, not all studies using a variable to proxy market size find positive and/or significant results. Das (2017) utilizes total population as a proxy for market size, finding it to be negative and significant, using 2005-2014 data for India. In theory, a large market size is thought to attract foreign investors as it seemingly represents a potential demand
0 500 1000 1500 2000 2500 2000 2001 2002 2003 2004 2005 2006 2007 2008 2009 2010 2011 2012 2013 2014 2015 2016 2017 2018
Transition economies Developed economies
for the final product. However, if foreign investors were only interested in the manufacturing of intermediate goods, then the host country’s market size would not be as significantly important. Given that Asia trades relatively more manufacturing intermediates than both North America and Europe, market size may not be as critical in attracting FDI (Mirodot 2009). Economic growth is also frequently used as an explanatory variable instead of market size. GDP growth is both a positive and significant variable in the study by Williams (2015). Similarly, GDP per capita growth is both a positive and significant variable in the study by Hussain (2016).
Financial development is another explanatory variable widely tested in the literature. Stock market capitalization, as a percentage of GDP, and domestic credit, as a percentage of GDP, are two of the most widely used proxies for financial development. Most studies find financial development to be statistically insignificant. Kaur (2013) employs fixed effects, random effects, and pooled ordinary least square (OLS) regressions to examine how financial development affects FDI in a panel of five major emerging national economies comprising of Brazil, Russia, India, China and South Africa (BRICS). Kaur shows that stock market capitalization to GDP is positive and significant for only the pooled and fixed effects models. In this study, domestic credit to private sector, as a percentage of GDP, which measures the banking sector’s ability to provide credit in the forms of loans to private firms, is surprisingly negative and significant for both the pooled and fixed effects models. Using a panel of 88 countries, including China, South Korea, Malaysia, and Turkey, and a fixed-effects model, Erdogen (2015) finds stock market capitalization to GDP and domestic credit to private sector to GDP to be both positive and significant. Shah (2016) uses a random effects model with a panel of Middle Eastern and North African countries and finds domestic credit to private sector to be positive and significant, whereas stock market capitalization to be insignificant. The sign and significance of financial development proxies seem to vary heavily dependent on the panel used and does yield consistent results. Svirydzenka (2016) argues that this is likely because commonly used proxies, such as stock market capitalization and domestic credit to private sector, measure only financial depth rather than financial development. Svirydzenka developed a financial development index, which combines various variables, as a proxy not only for financial depth (size of financial institutions and markets), but also for financial access and efficiency in both financial markets and institutions. Although not yet widely used in literature, this new index provides a much more accurate depiction of the entire financial sector’s development.
Inflation is commonly used as an explanatory variable in studies to measure economic stability. Countries with rapidly inflating currencies will not be attractive to foreign investors, as such shows signs of uncertainty, risk, and lower long-term profitability. Furthermore, an inflating currency will also lead to reductions in domestic investment and economic growth. It is important to know the effects of inflation to countries’ foreign direct investment inflows. Though it seems that inflation will have a negative impact on FDI, this is not always the case. Williams (2015), Ranjan (2011), and Tsaurai (2017) find inflation to be the expected sign of negative and significant. However, Das (2017) and Erdogen (2015) both find it to be positive and significant which seems counterintuitive to economic theories. Some studies such as Tampakoudis (2017) find inflation to be insignificant. Like financial development, inflation is a variable that yields inconsistent results. Human capital is essential to countries to attract FDI and their economic growth is a commonly used variable in related literature. According to Robert Barro, a renowned researcher of economic growth, in terms of per capita income, poor countries tend to converge with rich countries if they have high human capital per capita (Barro 1991). Secondary school enrollment is commonly used as a proxy for human capital and is reported as both significant and positive in empirical studies, including Kamath (2009) who focuses on India. Some studies, such as Hecock (2013), finds secondary school enrollment to
be insignificant. The United Nations’ human development index (HDI) is also regularly used as a proxy for human capital and is considered more comprehensive as it accounts not only for education, but also for quality of life, health, and life expectancy. Results of studies using HDI are mixed. Das (2017) finds HDI to be negative and insignificant, while Tsaurai (2017) finds it to be positive and significant.
Most studies that include a domestic investment variable only account for public investment in infrastructure. Numerous infrastructure proxies have been used with contrasting results. Kumari (2017) uses total electrical power consumption over a certain period of time as a proxy for infrastructure and finds it to be negative and significant. Williams (2015) uses the number of telephones per 1,000 people as a proxy for infrastructure and finds it to be positive and significant. Whereas infrastructure only accounts for public investment, gross fixed capital formation accounts for both public and private domestic investment. Lautier (2012) define in theory why gross fixed capital is a more correct variable for determining both public and private domestic investment. Private investment, like public investment, can also attract FDI through reducing “transaction costs,” promoting the “inter-firm division of labor,” and furthering the diffusion of technology (Lautier 2012). Private investment can also increase FDI inflows because domestic investors have a greater depth of and access to domestic information than foreign investors. Therefore, high levels of domestic investment can signal a healthy domestic economic climate to foreign firms. Gross fixed capital formation (GFCF) is found to be a significant and positive in Lautier (2012). Panigrahi (2012) utilizes a three-country panel, China, India, and Malaysia and finds GFCF to be positive and significant. Some studies in developing countries, such as Jong (2015) in Nigeria, actually find GFCF to have a negative sign. Nevertheless, the majority of literature points to more of a positive relationship between domestic investment, development, and FDI inflows.
Numerous institutional variables are used in existing literature. One of such variables is democracy. Due to their “executive constraint and judicial independence,” democracies can enforce property rights, which is attractive to foreign investors and may lead to greater FDI inflows (Farazmand 2015). However, since democracies do a better job of preventing monopolies and oligopolies in business, MNCs may hence invest in autocratic countries due to their increased profit opportunities and possibility of rent-seeking (Farazmand 2015). Firms located in countries with more authoritarian regimes may have a greater ability to influence government policy decisions. There are several measures of democracy used in literature, such as the Freedom House’s democracy index, the Polity IV’s democracy index, and the International Country Risk Guide’s (ICRG) democratic accountability index. However, the ICRG’s index is “targeted toward foreign investors” and, therefore, is most appropriate to use for studies related to FDI (Asiedu 2011). Previous studies that used a democracy index find statistically significant results. Dumludag (2009) uses the ICRG index and finds it to be significant for a panel of developing countries. Farazmand (2015) uses the Polity IV’s index and finds positive and significant results in a generalized least squares (GLS) model for a panel of countries that includes Malaysia, Turkey, and Singapore. Studies, such as Nazeer (2017) and Topal (2016), create political instability and political risk indices by combining a democracy index with other widely used institutional variables, such as corruption, law and order. Nazeer (2017) uses a political instability index comprising of government stability, corruption, law & order, democratic accountability, and bureaucracy quality from the ICRG index and finds it to be positive and significant.
3. Data and Methodology
This study examines the determinants of FDI, using a data panel of representative Asian countries. A pooled ordinary least squares (OLS), semi-log fixed-effects (FE) regression model is utilized to analyze the determinants of FDI in a sample of six Asian countries. The balanced panel data consists of India, Singapore, China, South Korea, Turkey, and Malaysia for the study period of 1995-2013. Furthermore, a Hausman test employed to determine whether a fixed or random effects model is preferred.
The regression model takes the following form:
Y= β0 + β1Xit + β2Xit + β3Xit + β4Xit + β5Xit + β6Xit + β7Xit + €it (1)
where,
Subscript i denotes the six representative countries while subscript t denotes times (country i at time t);
X is a vector of explanatory variables and β is a vector of unknown parameters to be estimated.
The following semi-log fixed-effects (FE) regression model is utilized to evaluate the major determinants of FDI inflows:
Ln(FDI)it = β0 + β1(INF)it + β2(DEM)it + β3(SMCAP)it + β4(GDPPCG)it + β5(GFCF)it + β6(HC)it + β7(TRADE)it + €it (2)
where,
Subscript i denotes the six countries (i = 1-6) and subscript t denotes times in years (t=1995-2013);
Ln (FDI)it= dependent variable (the natural logarithm of FDI inflows);
(INF)it = inflation, consumer prices (as annual % change);
(DEM)it = democratic accountability variable;
(SMCAP)it = stock market capitalization to GDP;
(GDPPCG)it = GDP per capita growth (as annual % change);
(GFCF)it = gross fixed capital formation (as % of GDP);
(HC)it = human capital of country;
(TRADE)it = trade (as % of GDP);
€it (epsilon) = stochastic (or random) error term, serving as a proxy for all those variables
that are omitted from the model but collectively affect FDI inflows.
The parameters in Equation 2 are unknown and must be estimated empirically. The coefficients (β1-β7) represent the rate of change of the dependent variable (FDI) as a function of change in the
independent variables. €it is the error term and includes all the variations in FDI not explained by
the independent variables. A Hausman test is used to determine whether a fixed effects or random effects model is preferred. The p-value is 0.00, which is less than 0.05, so a fixed effects model is the preferred method. The data sources include World Bank’s World Development Indicators, St. Louis Federal Reserve, Penn World Table’s (PWT) Human Capital Index, International Country Risk Guide (ICRG), and UN's Human Development Reports.
The dependent variable (FDI) is foreign direct investment net inflows in constant 2010 USD. Inflation (INF) is used as a proxy for economic instability. It is expected that inflation will have a negative coefficient because higher economic instability should result in less FDI. Foreign investors are less likely to invest in a country if its currency is rapidly inflating. For the Democracy (DEM)
variable, the Democratic Accountability variable of the International Country Risk Guide (ICRG) index is used. This index measures how accountable governments are to their people. The ratio of stock market capitalization to GDP (SMCAP) is used as a proxy for financial development. It is defined as the ratio of the value of all listed shares of a country’s stock market to its GDP. While stock market capitalization is one of the most widely used proxies for financial development. However, many researchers find it insignificant. GDP per capita growth (GDPPCG) variable (as annual % change) is expected to have a positive sign because foreign investors would understandably be interested in the profit opportunities of a rapidly growing economy. Gross fixed capital formation (GFCF, as % of GDP) is used as a proxy for domestic physical investment. GFCF reveals the percentage of a country’s GDP, which is comprised of fixed capital. This fixed capital could include capital that fosters production, such as manufacturing plants and machinery. It could also include infrastructure that is more commonly found in developed countries, such as, schools, hospitals, and roads. The expected sign for GFCF is positive. The Penn World Table’s (PWT) human capital index is used as a proxy for human capital (HC). The United Nation’s human development index (HDI) is also used as a proxy for human capital and is more detailed than secondary school education, since it also measures health and quality of life. However, given its wider range of measurements, HDI was multicollinear with many other variables used in this study, and therefore, was dropped in favor of the PWT’s human capital index. Trade, as a % of GDP, is used as a proxy for trade openness. Trade openness is the sum of imports and exports of goods and services, normalized by GDP. It is calculated as imports plus exports divided by GDP. The expected sign for this variable is positive.
4. Empirical Results
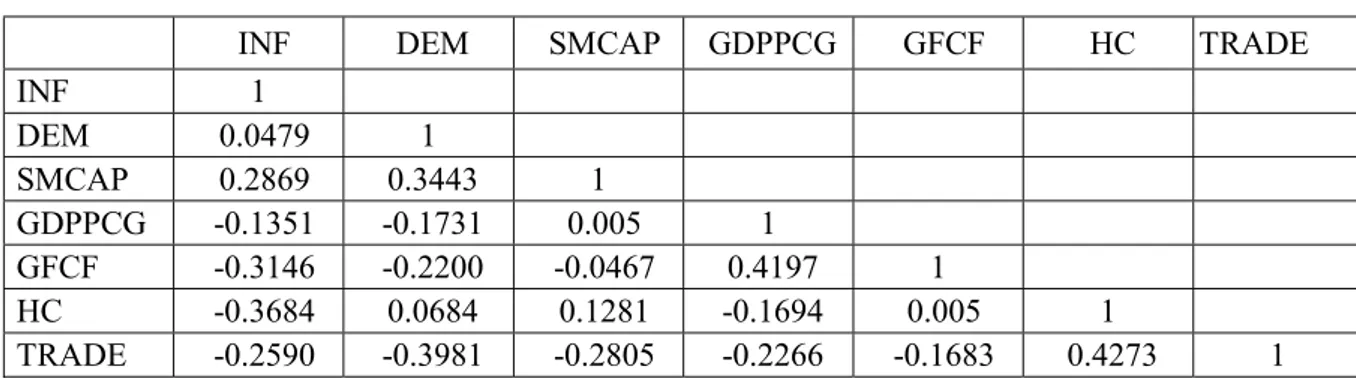
The correlation matrix in Table 1 shows that there is no evidence of multicollinearity between the independent variables (all correlations between any two variables are less than 0.5 in an absolute value). That is, no two predictor variables are highly correlated which leads to the possibility that our interpretation of coefficients will be incorrect. The financial development index created by Svirydzenka (2016) had a correlation of 0.93 with the human capital index used in our model, and therefore, was dropped from the model as a proxy for financial development, in favor of stock market capitalization to GDP.
Table 1 – Correlation Matrix
INF DEM SMCAP GDPPCG GFCF HC TRADE
INF 1 DEM 0.0479 1 SMCAP 0.2869 0.3443 1 GDPPCG -0.1351 -0.1731 0.005 1 GFCF -0.3146 -0.2200 -0.0467 0.4197 1 HC -0.3684 0.0684 0.1281 -0.1694 0.005 1 TRADE -0.2590 -0.3981 -0.2805 -0.2266 -0.1683 0.4273 1
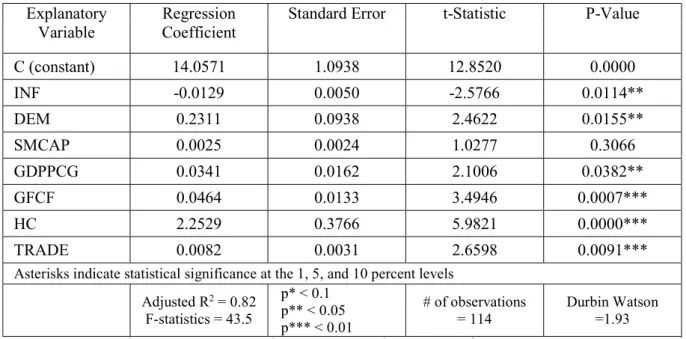
Table 2 shows the fixed-effects estimation results. The adjusted R-squared is 0.82 and the probability of F statistics is 0.000, which both indicate a goodness of fit. The Durbin-Watson statistic is 1.93; there is no evidence of autocorrelation in our model. All variables except SMCAP are found to be significant and have the expected sign. INF is negative and significant, while DEM, GDPPCG, GFCF, HC, and TRADE are all positive and significant. Although SMCAP is insignificant, it still has the expected positive sign. From review of literature, it is apparent that similar studies in the past also found financial development proxies to be
insignificant. These common proxies for financial development measure only financial depth (size of financial institutions and markets relative to aggregate economic output).
Table 2: Fixed Effects Model Estimation Results. Dependent Variable = FDI (Inflows)
Explanatory Variable
Regression Coefficient
Standard Error t-Statistic P-Value
C (constant) 14.0571 1.0938 12.8520 0.0000 INF -0.0129 0.0050 -2.5766 0.0114** DEM 0.2311 0.0938 2.4622 0.0155** SMCAP 0.0025 0.0024 1.0277 0.3066 GDPPCG 0.0341 0.0162 2.1006 0.0382** GFCF 0.0464 0.0133 3.4946 0.0007*** HC 2.2529 0.3766 5.9821 0.0000*** TRADE 0.0082 0.0031 2.6598 0.0091***
Asterisks indicate statistical significance at the 1, 5, and 10 percent levels Adjusted R2 = 0.82 F-statistics = 43.5 p* < 0.1 p** < 0.05 p*** < 0.01 # of observations = 114 Durbin Watson =1.93
5. Summary and Conclusions
A semi-log fixed-effects regression model is utilized to analyze the determinants of FDI in a sample of six Asian countries. A panel data consisting of India, Singapore, China, South Korea, Turkey, and Malaysia from 1995-2013 is employed. The dependent variable is FDI net inflows. The explanatory variables included in our econometric model are the following: democracy, inflation, human capital, economic growth, domestic physical investment, trade openness, and financial development. Furthermore, a Hausman test is employed to determine whether a fixed or random effects model is preferred. The fixed effects model estimation results show all variables, with the exception of the financial development variable, are statistically significant and have the expected sign.
The results of this study reveal that gross fixed capital formation as both a positive and significant determinant of FDI, suggesting that foreign capital does not come at the expense of domestic capital, but rather is attracted to it. Human capital is also positive and significant, meaning foreign investors are interested in developing skilled labor. This is beneficial for our panel of representative countries as high human capital results in more benefits from FDI inflows, such as technological diffusion and knowledge spillovers. Human capital as a significant determinant of FDI is noteworthy for future studies as a new index from Penn World Table is applied in this study. As expected, we find inflation to be negative and significant determinant of FDI, indicating that developing countries should emphasize monetary responsibility in order to prevent economic instability. Trade and GDP per capita growth have their expected sign and are significant determinants of FDI.
In conclusion, the empirical findings of this study are of particular interest to policymakers in developing countries as they adopt economic policies to attract FDI inflows. Policymakers need to focus on promoting domestic capital, education, trade openness, monetary responsibility, and development of the financial sector.
6. Research Limitations and Future Research
The ratio of stock market capitalization to GDP is utilized as a proxy for financial development in this study. Although this financial development proxy has the expected sign, it is insignificant, which is consistent with the current literature. The financial development index developed by Svirydzenka (2016) was multicollinear with the human capital index used in our model. Therefore, it was dropped from the model as a proxy for financial development, in favor of stock market capitalization to GDP. The new broad-based index of financial development introduced by Svirydzenka (2016) may be applied as a possible solution to this problem as it combines measures for financial depth (size of financial institutions and markets), financial access, and financial efficiency. Thus, further studies are warranted to apply this new financial development index. Furthermore, larger sample sizes provide more information and reliable empirical results.
References
1. Asghar, Ali (2016). Foreign Direct Investment and Trade Openness: The Case of South Asian Economies. International Journal of Innovation and Applied Studies, 17(2), 513-521.
2. Asiedu, E., & Lien, D. D. (2011). Democracy, Foreign Direct Investment and Natural Resources. Journal of International Economics, 84(1), 99-111.
3. Barro, Robert (1991). Economic Growth in a Cross Section of Countries. The Quarterly Journal of Economics, 106(2), 407-443.
4. Das, S. (2017). Foreign Direct Investment and its Determinants: A Study on India and Brazil. International Journal of Business and Management Invention, 6(1), 62-69.
5. Demirhan, E., & Masca, M. (2008). Determinants of foreign direct investment flows to developing countries: A cross-sectional analysis. Prague Economic Papers, University of Economics, Prague, 17(4), 356-369.
6. Dumludag, Devrim (2009). Political Institutions and Foreign Direct Investment Flows into Developing Countries. MPRA Paper 27327, University Library of Munich, Germany, revised Feb. 2, 2010.
7. Economou, Fotini, et al. (2017). Foreign Direct Investment Determinants in OECD and Developing Countries. Review of Development Economics, 21(3), 527–542.
8. Erdogan, Mahmut, and Mustafa Unver (2015). Determinants of Foreign Direct Investments:
9. Dynamic Panel Data Evidence. International Journal of Economics and Finance, 7(5), 82– 95.
10. Farazmand, H., & Moradi, M. (2015). Determinants of FDI: Does democracy matter? International Journal of Strategic Management and Decision Support Systems in Strategic Management, 20(1), 38-46.
11. Hecock, R. D., & Jepsen, E. M. (2013). Should Countries Engage in a Race to the Bottom? The Effect of Social Spending on FDI. World Development, 44 (April), 156-164.
12. Hussain, M., & Haque, M. (2016). Foreign Direct Investment, Trade, and Economic Growth: An Empirical Analysis of Bangladesh. Economies, 4(7), 1-14.
13. Kamath, G. Bharathi (2009). Macroeconomic determinants of foreign direct investment in India. Baudhik, September– December 1(2), 3–13.
14. Kaur, M., Yadav, S.S. & Gautam, V. (2013). Financial System Development and Foreign Direct Investment: A Panel data Study for BRIC Countries. Global Business Review, 14(4), 729-742.
15. Kumari, Reenu, and Anil K. Sharma (2017). Determinants of Foreign Direct Investment in Developing Countries: A Panel Data Study. International Journal of Emerging Markets, 12(4), 658–682.
16. Lautier, M & Moreaub, F. (2012). Domestic Investment and FDI in Developing Countries: The Missing Link. Journal of Economic Development, 37(3), 1-23.
17. Miroudot, S., R. Lanz and A. Ragoussis. (2009). Trade in Intermediate Goods and Services, OECD Trade Policy Papers, No. 93, OECD Publishing, Paris.
18. Nazeer, Abdul Malik & Masih, Mansur, (2017). Impact of political instability on foreign direct investment and Economic Growth: Evidence from Malaysia. MPRA Paper 79418, University Library of Munich, Germany, 1-19.
19. Jong, C. M., Arikpo, O. F., & Anthony, O. (2015). Determinants of Foreign Direct Investment Inflow to Nigeria. IOSR Journal of Humanities and Social Science, 20(8), 34-43.
20. Panigrahi, T. R., & Panda, B. D. (2012). Factors Influencing FDI Inflow to India, China and Malaysia: An Empirical Analysis. Asia-Pacific Journal of Management Research and Innovation, 8(2), 89-100.
21. Ranjan, V., & Agrawal, G. (2011). FDI Inflow Determinants of BRIC Countries: A Panel Data Analysis. International Business Research, 4(4), 255-263.
22. Shah, M. H. (2016). Financial development and foreign direct investment: The case of Middle East and North African (MENA) developing nations. MPRA Paper 82013, University Library of Munich, Germany, 1-18.
23. Smith, A., & Cannan, E. (2003). The Wealth of Nations. New York, N.Y: Bantam Classic. 24. Svirydzenka, K. (2016). Introducing a New Broad-based Index of Financial Development.
IMF Working Papers, 16(5), 1-43.
25. Tampakoudis, I. A., Subeniotis, D. N., Kroustalis, I. G., & Skouloudakis, M. I. (2017). Determinants of Foreign Direct Investment in Income Countries: New Middle-Income Trap Evidence. Mediterranean Journal of Social Sciences, 8(1), 58-70.
26. Topal, M. H., & Gul, O. S. (2016). The Effect of Country Risk on Foreign Direct Investment: A Dynamic Panel Data Analysis for Developing Countries. Journal of Economic Library, 3(1), 141-155.
27. Tsaurai, Kunofiwa (2017). The Dynamics of Foreign Direct Investment in BRICS Countries. Journal of Economics and Behavioral Studies, 9(3): 101-112.
28. Williams, Kevin. (2015). Foreign Direct Investment in Latin America and the Caribbean: An Empirical Analysis. Latin American Journal of Economics, 52(1), (57–77).
29. World Development Indicators (2018). World Bank, Washington, D. C.
30. World Investment Report (2018 & 2019), United Nations Conference on Trade and Development (UNCTAD), Geneva: United Nations.
31. Musso F. (2012), “Technology in Marketing Channels: Present and Future Drivers of Innovation”, International Journal of Applied Behavioural Economics (IJABE), vol. 1, n. 2, pp. 41-51. doi:10.4018/ijabe.2012040104.
32. Musso F. (1997), “The Changing Role of Trade Co-operation in Regional Economies: A Case Study”, Proceedings of the 37th European Regional Science Association Congress, Roma, Università degli Studi di Roma "Tor Vergata", Facoltà di Economia, August 26-29. 33. Musso F. (2005), L’impresa commerciale minore in Italia, Cedam, Padova.
34. Musso F. (2010), "Small Retailing, Town Centres and Inland Territories. An “Extended Town Centre Management” Perspective", Public Administration & Regional Studies, 3rd Year, n. 2 (6), Galati University Press, pp. 37-58.