UNIVERSITÀ DEGLI STUDI DI SASSARI CORSO DI DOTTORATO DI RICERCA
Scienze Agrarie
Curriculum “Agrometeorologia ed Ecofisiologia dei Sistemi Agrari e Forestali”
Ciclo XXIX
S
OIL
O
RGANIC
C
ARBON
:
CURRENT STOCK AND FUTURE PROJECTIONS IN
I
TALY
AND
E
UROPE USING A SPATIAL MODELLING APPROACH
Dr. Antonio Caddeo
Coordinatore del Corso Prof. Antonello Cannas
Referente di Curriculum Prof. Donatella Spano
Tutor Co-Tutor
Dr. Costantino Sirca Dr. Valentina Mereu
UNIVERSITÀ DEGLI STUDI DI SASSARI CORSO DI DOTTORATO DI RICERCA
Scienze Agrarie
Curriculum “Agrometeorologia ed Ecofisiologia dei Sistemi Agrari e Forestali”
Ciclo XXIX
La presente tesi è stata prodotta durante la frequenza del Corso di Dottorato di ricerca in Scienze Agrarie dell’Università degli Studi di Sassari, A.A. 2013/2014 - XXIX ciclo, con il sostegno di una borsa di studio finanziata con le risorse dell’INPS – Gestione Ex INPDAP nell’ambito delle Iniziative Accademiche Homo Sapiens Sapiens.
Dr. Antonio Caddeo presents its sincere thanks to the INPS - Gestione Ex INPDAP for the financial support of her PhD scholarship (funded by Homo Sapiens Sapiens Academic Initiatives).
CONTENTS
ABSTRACT………5
1. INTRODUCTION………..7
1.1 CLIMATE CHANGE………...7
1.2 CLIMATE CHANGE AND SOIL ORGANIC CARBON………...11
1.2.1 CENTURY MODEL APPLICATIONS……….14
2. OBJECTIVES………...17
3. MATERIALS AND METHODS……….18
3.1 CENTURY MODEL………..18
3.2 SOIL DATA………20
3.3 CLIMATE DATA………...21
3.4 LAYER LINKAGE AND SPIN-UP PHASE……….22
4. CHAPTER 1………..24
CURRENT SOC STOCK AND FUTURE PROJECTIONS IN ITALIAN FORESTRY AND TREE CROP SURFACES. 4.1 STUDY AREA AND INPUT DATA………...24
4.2 RESULTS AND DISCUSSION ………....27
4.2.1 ACTUAL SOC STOCK………..27
4.2.2 FUTURE SOC PROJECTIONS ………....39
5. CHAPTER 2………..53
CURRENT SOC STOCK AND FUTURE PROJECTIONS IN EUROPEAN WOODLAND AND PERMANENT CROP SOILS. 5.1 STUDY AREA AND INPUT DATA………...53
5.2 RESULTS AND DISCUSSION ………57
5.2.1 ACTUAL SOC STOCK………..57
6. CONCLUSIONS………...87
ABSTRACT
Soil organic carbon (SOC) represents the largest carbon pool in the terrestrial biosphere, containing twice as much carbon as the atmosphere and three times that in global vegetation. The soil can behave both as a carbon sink (taking CO2 from the atmosphere) and as a carbon source (releasing CO2 into the atmosphere), playing a key role in the global carbon budget. A significant impact of climate change on carbon accumulation and release processes from soils has been recognized from the scientific community, due to the role of climate variables (e.g. temperatures, rainfall, and so on) on the biochemical carbon cycle.
In the last decades a noticeable number of papers highlighted the role of forested areas in the global carbon budget, assessing its carbon accumulation potential. Although few papers have attempted to assess the role of tree crop surfaces in the carbon budget, consistent datasets on the carbon accumulation capacity for these surfaces are now available. At the same time, a noticeable data shortage related to the carbon stored in forested and tree crop soils has been recognized. A literature survey carried out in the Euro-Mediterranean area showed little data, mainly based on inventory approaches are available for the actual SOC stock for forested and tree crop surfaces. Less information is available for the evaluation of climate change impacts on the SOC stock at local or spatial limited scales. Models of SOC dynamics, as the CENTURY ecosystem model, represents a powerful tool in order to assess both the SOC stock and its changes on terrestrial ecosystems. CENTURY is able to simulate SOC dynamics over the time accounting for soil, vegetation, and climate data, including CO2 concentration in the atmosphere. CENTURY, enclosed the last available version (v.5) works at local scale (single points) and has been validated for many agricultural and forest ecosystems.
Starting from this context, the main objectives of this work were: (i) to develop a methodology for allowing the use of CENTURY at high resolution and wide (regional) scales and (ii) to assess the
current SOC stock and the climate change impacts at national (Italy) and regional (Euro-Mediterranean) scale for the forested and tree crop surfaces.
In the first part of this work, a spatial modeling platform that works in a GIS environment using the CENTURY 5 ecosystem model coupled with Visual Basic and R Studio routines was developed. The model was then run at 500 m resolution for Italy and at 1 km resolution for the Euro-Mediterranean area, using the climate (EURO-CORDEX Project), soil (HWSD 1.2), and land cover (IUTI for Italy, CLC 2006 for Europe) databases as input data. Three Global Circulation Model (GCMs), both for actual climate (1970-2005) and future changes (2006-2100), based on two different scenarios simulated moderate (RCP4.5) and extreme (RCP8.5) climate change conditions in future projections. The results were compared with data from different national inventories, enclosed the LUCAS (Land Use/Land Cover Area Frame Survey 2009) data.
The results are presented separately for Italy and the Euro-Mediterranean domains.
In Italy the actual SOC stock ranges between 1320 Tg and 1425 Tg. The largest contribution to the total SOC stock was found in the broad-leaved forests (701 Tg), followed by coniferous forests (ranging from 295 Tg to 399 Tg).
In the Euro-Mediterranean area, the total SOC stock ranges from 5917 Tg to 6317 Tg. The largest contribution was found for coniferous forests (from 1704 to 1955 Tg), followed by broad-leaved (from 1775 to 1783 Tg), and mixed forests (from 971 to 1116 Tg). With respect to the projections, on average, considering all GCMs and climate scenarios, the total SOC stock decreases both in Italy (-0.75%; 13 Tg) and Euro-Mediterranean area (-0.86%; 53 Tg) in the period 2005-2095.
The results obtained in these works would represent a contribution for improving our knowledge on the role of the Italian and Euro-Mediterranean forestry surfaces both for scientific purposes and the development of policies related to climate change mitigation strategies.
1. INTRODUCTION
1.1
CLIMATE CHANGE
The Earth's climate has always changed under the influence of different natural factors: sometimes this has happened slowly and predictably, other times these changes were unexpected. Nowadays, however, the Earth's climate tends to change at a rate not dependant on by natural factors. The causes are mainly attributable to human activities, as evidenced by the large amount of published scientific data (Diffenbaugh et al., 2015; Trenberth, 2011; Trenberth et al., 2015). With the industrial revolution, human activities have disrupted the original composition of the atmosphere by increasing the concentration of Greenhouse Gases (GHGs), mainly carbon dioxide (CO2), methane (CH4), nitrous oxide (N2O). The concentration of these gases increased with time, and significant emission increases have occurred in the industrial era: +80% between 1970 and 2010 (IPCC, 2007) (Figure 1). The energy sector was the main cause of GHGs emissions (+145%), followed by the industrial sector (31.7%), agriculture (11.2%), and forestry and other land use (12.7%) (IPCC, 2014). The growing attention to this issue by the International scientific community has led, in 1988, the establishment of Intergovernmental Panel on Climate Change (IPCC). The role of IPCC is to collect and evaluate the main scientific, technical, socio-economic information in order to understand the risks of human-induced climate change. In its Fifth Assessment Report (AR5, 2014), the IPCC confirmed the reality of climate science, with a greater amount of data and results deriving from models that confirm what they already knew. The IPCC defines climate change as a statistically significant change of the mean state of climate, persisting for an extended period (IPCC, 2013). The most important anthropogenic GHG is the CO2 (77% of total anthropogenic GHG emissions), followed by CH4 (15%), and N2O (6.2%) (IPCC, 2014). Half of anthropogenic CO2 emissions in the 1750-2010 period took place in the last 40 years
(Figure 2). The CO2 atmospheric concentration has increased from 280 ppm in pre-industrial era to 390 ppm in 2010 (+39.5%), becoming the most important component of the radiative forcing of climate change (IPCC, 2013). The increase of CO2 concentration in the atmosphere is mainly due to the use of fossil fuels, followed by deforestation, land use and land cover changes (IPCC, 2013). Fossil carbon (C) is different from young C that circulates in terrestrial biogeochemical cycles. The first consists mainly of C stable isotope (C12), and it is extremely poor in the isotope C14 (unstable). In the atmosphere the concentration of the isotope C12 is growing due to the large use of fossil fuels. Consequently, the ratio between C12 and C14 is increasing in the atmosphere, which is depleted in C14 (IPCC, 2007).
Figure 2. Trend in atmospheric concentration of long-lived greenhouse gases over the last 40
years (IPCC, 2014).
The increase of GHG emissions and the consequent increase in the atmospheric concentration of these gases are responsible for the mean temperature increase in the post-industrial era (IPCC, 2013). At the end of the century the global mean temperature may vary from a minimum of 1.1°C to a maximum of 6.4°C. (IPCC, 2013). Another consequence of the climate change, which is due to the increase of GHG in the atmosphere, is the reduction of precipitation, and the increase in the frequency of extreme weather events (IPCC, 2013). The future evolution of GHGs emissions is very uncertain because of the considerable complexity of the climate system. In order to improve the knowledge on climate change and their implications on the environment and human activities, the IPCC developed the future emissions scenarios. The new generation scenarios known as Representative Concentration
scenarios in the evolution of atmospheric composition (Moss et al., 2010). The RCPs were developed to represent a broad range of climate outcomes, based on a literature review, and included a stringent mitigation scenario (RCP2.6), two intermediate scenarios (RCP4.5 and RCP6.0) and one scenario with very high GHGs emissions (RCP8.5) (Figure 3). The RCPs, covering the entire 21st century, provide inputs for climate models and are widely used for the analysis of the climate change impacts. Furthermore, the emission scenarios are being used to drive climate model simulations planned as part of the World Climate Research Programme’s Fifth Coupled Model Intercomparison Project (CMIP5) (Taylor et al., 2009) and other comparison exercises. Currently, many scientific works used different Global Circulation Models (GCMs) in order to minimize the models climate variability.
Figure 3. Emissions of main greenhouse gases across the RCPs (from van Vuuren et al.,
1.2
CLIMATE CHANGE AND SOIL ORGANIC CARBON
The projected mean air temperature increasing and the decrease in effective rainfall may affect soil moisture and temperature regimes. At the ecosystem level, the soil affects vegetation through its influence on water availability, element cycling and soil temperature regime. These changes may also impact the Soil Organic Carbon (SOC) pool and soil physical properties because of the changes in biomass inputs (above ground and below ground biomass) returned to the soil (Lal, 2004). The SOC is the largest carbon pool in the terrestrial biosphere (ca. 1500 Pg C), second only to the oceans, containing twice as much carbon as the atmosphere (730 Pg C) and three times that stored in global vegetation (500 Pg C) (IPCC, 2004). The global soil carbon stock is not a static and unchanging amount. The soil can behave both as a carbon sink (absorbing CO2 from the atmosphere) and as a carbon source (releasing CO2 into the atmosphere) according to a direct relationship: an increase of 1 Pg of SOC results in a decrease of 0.47 ppm of atmospheric CO2 (Lal, 2006) and vice versa. Soil carbon sequestration should be evaluated as a strategy for climate change mitigation by reducing the atmospheric GHGs concentration over the next century (Smith, 2004). Therefore, it is extremely important to study Soil Organic Matter (SOM) dynamics in order to understand the potential of soils to accumulate carbon and to accurately estimate the current SOC stock at global level. Although most studies reported a global SOC estimate of roughly 1500 Pg C stored in a 1.0 m depth (Eswaren et al., 1993; Batjes, 1996; Lal, 2004), there is a considerable variation, range 504-3000 Pg (Scharlemann et al., 2014). Other works reported global SOC estimates of 2344 Pg stored in the top 3 m of soil (Stockmann et al., 2013) and about 615 Pg in the top 20 cm (Jobbàgy & Jackson, 2000; Guo & Gifford, 2002). Even though ground and atmospheric carbon measurements suggest that the terrestrial biosphere is a net sink of CO2 (Le Quéré et al., 2009), it is unclear if this sink will persist despite climate change. The answer to this mainly depends on the impact of drought stress on plant
production and tree mortality (Phillips et al., 2009; Goulden et al., 2011). Soils may play a fundamental but uncertain role in climate change mitigation during the coming decades. Although alone not decisive in this challenge (mostly due to reversibility of SOC), C sequestration by soils can be done with competitive costs, it does not require the development of new technologies and provides a contribution comparable with other economic sectors (Schils et al., 2008). More recently, soil received growing attention because SOC reduction leads to a decrease in soil fertility, and the onset of degradative processes such as soil erosion, desertification, compaction and nutrient deficiency (Lal, 2004).
The methodologies used to estimate the actual SOC stock and future projections can be distinguished in inventory methods and modelling approaches. The first consist on direct field measurement of SOC concentration, but despite the accuracy require long time and high costs for large scale studies. Furthermore, the inventory methods were used to extrapolate specific regression equations to estimate SOM changes in time. According to Falloon et al. (2002), the main limitation of this approach is the assumption of a constant rate of SOM change during the time. The dynamic SOM models are widely used to estimate the SOC stock and future changes both for individual experiments that for large scale studies. The most obvious advantage is that models takes account of dynamic processes in determining SOC stock (SOM is divided into several pools with a different turnover rate). Another advantage is that models allow to make future projections using climate or land use change scenarios, not reproducible in field experiments. Furthermore, models cover the whole surface, the data does not refer to a single point as for the inventory methods. The models, however, simplify the soil system (chemical and physical reactions are described by mathematical equations). Another critical aspect of model applications is the C allocation in the different soil pools. This fundamental issue has not been emphasized enough, despite it can influence the behavior
correctly allocate the C in the different pools. Various promising spin up approaches have been studied, but they usually require too much measured data.
Many authors linked dynamic SOM models to Geographic Information System (GIS) to estimate the SOC stock and future projections for large scale studies (Falloon et al., 1998; Ardo & Olsonn, 2003; Easter et al., 2007; Alvaro-Fuentes et al., 2011). The GIS allows the use of geo-referenced input data, and thus improves the accuracy and reliability of spatial estimates. Regional studies are necessary in order to refine global SOC stock estimates, obtained by the aggregation of data, mainly at country scale (Milne et al., 2007), because currently only few and not homogeneous data exist. Different national studies have been conducted by combining SOC field measurements from different data sources in UK (Howard et al., 1995; Smith et al., 2000), in Spain (Rodriguez Murillo, 2001; Doblas-Miranda et al., 2013; Rodríguez-Martín et al., 2016), in France (Arrouays et al., 2001), and in Italy (Chiti et al., 2012). Other authors carried out national wide studies building an empirical model to predict the SOC stock as a function of environmental variables such as land cover, soil type and climate (Martin et al., 2011; Meersmans et al., 2012; Meersmans et al., 2013).
There are few studies that used dynamic SOM models to assess future projections at country scale, in Italy (Mondini et al., 2011), in Spain (Alvaro-Fuentes et al., 2011), and in Japan (Hashimoto et al., 2012). At global and European level, the works with models on SOC stock and future projections vary for the different spatial resolution, land cover/land use considered, and for the management practices applied (Jones et al., 2005; Smith et al., 2005; Lugato et al., 2014). Currently, there is still little information about the current SOC stock and future changes in Mediterranean areas at regional and national scale (Alvaro-Fuentes et al., 2011). Furthermore, these works focus their attention mainly on grassland and cropland, but SOC studies at wide scale on forested and permanent tree crop surfaces has not been yet reported.
1.2.1 CENTURY MODEL APPLICATIONS
Globally, several ecosystem models have been developed and tested to simulate SOM dynamics. These models are used to assess the sequestration potential of C by soils and to simulate the response of soils to environmental and anthropogenic perturbation. Process-oriented models predict SOM dynamics based on different conceptual C pools that alter in size via decomposition rates and stabilization mechanisms. Within process-oriented models, CENTURY (Parton et al., 1988) and RothC (Jenkinson, 1990; Coleman & Jenkinson, 1999) are the most frequently used to evaluate the current SOC stock and future changes. CENTURY was tested successfully at field scale (Ardo & Olsonn, 2003; Lugato et al., 2006, 2007; Tornquist et al., 2009; Chiti et al., 2010), and applicate at national (Hashimoto et al., 2012; Alvaro-Fuentes et al., 2011) and European scale (Lugato et al., 2014). Some structural parts of CENTURY have been incorporated into several other models (Liu et al., 2003; Izaurralde et al., 2006). CENTURY was originally developed to simulate SOM dynamics in grasslands, and was later adapted to forest and agricultural ecosystems. Many authors used site specific datasets to calibrate and validate CENTURY in different European ecosystems, in relatively homogeneous conditions. Paustian et al. (1992) modeled the effects of organic matter and fertilizer additions on SOM dynamics from a Swedish long-term experiment. Kelly et al. (1997) used CENTURY to simulate some agricultural long-term experiments from central Europe. Lugato et al. (2007) simulated SOC dynamics in two long-term experiments in northeastern Italy comparing different nutrient management and soil types. Alvaro-Fuentes et al. (2009) evaluated the CENTURY model to investigate long-term management effects on SOC dynamics for a Mediterranean semi-arid agroecosystem in NE Spain. Chiti et al. (2010) predicted SOC changes with CENTURY in four Mediterranean and two mountain forest sites in Italy, equipped with Eddy Covariance systems, characterized by
and validated CENTURY for the analysis of SOC stock evolution from 1900 to 2050 for farms in Southern Brazil.
Although the importance of the field-scale studies to evaluate the model performance on different ecosystems, the results are not always representative at wider spatial scale. Spatial approaches are needed to understand SOM dynamics and SOC distribution on large areas, being it an essential step when quantifying regional and global C budgets (Paustian et al., 1997). Falloon et al. (1997) used RothC and CENTURY to investigate land management scenarios for C sequestration in a region of Central Hungary. They linked a GIS interface to dynamic SOM models, integrating detailed knowledge on soils, climate and land use/cover. Ardo & Olsoon (2003) used a different approach to Falloon et al. (1997) to link spatially explicit data to the CENTURY model. They compiled a spatially explicit database of soil texture, climate and land cover information for a 262,000 km2 area in Sudan. Instead of a polygon approach, data was used in a grid form. Each grid cell comprising a unique combination of soil, land cover and climate variables, processed only once by the model. In many cases, grid cells with unique combinations occurred more than once in the given geographic area. This reduced the number of model runs, but still resulted in separate model runs for each unique grid cell. Comprehensive systems such as the GEFSOC Modeling System (which includes CENTURY and GIS) have been recently developed and tested under a wide variety of environments (Milne et al., 2007; Easter et al., 2007). Alvaro-Fuentes et al. (2011) used the GEFSOC Modelling System to simulate SOC stock and future changes in a characteristic Mediterranean area of 95 269 km2 located in northeast Spain. Hashimoto et al. (2012) estimated the potential SOC in Japanese forest soils under nine forest managements and a climate change scenario with CENTURY model. Lugato et al. (2014) created a comprehensive model platform at European scale using CENTURY. They estimated SOC stock and changes for the combinations of soil-climate-land use, including the main arable
crops, orchards and pasture. The model was implemented with the main management practices (e.g. irrigation, mineral and organic fertilization, tillage) derived from official statistics.
The analysis of the literature highlighted a noticeable data shortage in the SOC estimation at regional and national scale for forestry and tree crop surfaces. Conversely, several SOC estimates in cropland and pasture surfaces were reported for Italy (Francaviglia et al., 2012; Mondini et al., 2012) and Europe (Smith et al., 2005; Lugato et al., 2014).
In this work I decided to consider only forestry, shrub-herbaceous associations, and tree crop surfaces because spatial SOC stock estimates for these land cover classes have not yet reported.
2. OBJECTIVES
SOM dynamics models (e.g. CENTURY, RothC) have been widely used to assess the impacts of land cover and environmental factors on the SOC content, reproducing chemical and physical soil processes by mathematical equations. These models, coupled with Geographic Information Systems (GIS), are powerful tools for estimating the real SOC stock and future SOC dynamics. In the first part of the thesis work, the analysis of the literature highlights a noticeable data shortage in the SOC estimation at regional scales for forestry and tree crop surfaces.
Starting from this context, the main objective of this research has been to estimate the current SOC stock values and the potential impacts of climate change on these stocks in forested and tree crop covered areas of the Euro-Mediterranean area using a spatial modeling platform based on CENTURY 5 model. Two climate scenarios (RCP4.5 and RCP8.5) and three Global Circulation Models data were used to assess the climate change impacts on the actual SOC stocks.
Besides the Introduction and the Materials and Methods sections, the work is organized in two main Chapters showing the results obtained at national scale (the whole Italian territory, Chapter I) and in a wider area covering most of the Euro-Mediterranean area (Chapter II).
3. MATERIALS
AND
METHODS
3.1
CENTURY MODEL
CENTURY is a model designed to simulate SOM dynamics in natural or cultivated systems using a monthly time step (Parton et al., 1988). The pools and C flows considered by the model are illustrated in Figure 4. The SOM submodel includes two litter and three SOC pools. Litter is divided into metabolic (easily decomposable, 0.1 to 1 year turnover time) and structural (lignocellulose plant material, 2-5 years turnover time) pools. The three SOC pools have a different turnover time: 2 to 4 years (active SOC), 20 to 50 years (slow SOC), 800 to 1200 years (passive SOC). Litter and SOC decomposition process are associated with losses of CO2, which are influenced by soil texture, water availability, and soil temperature. The model is set up to simulate the SOM dynamics in grasslands, agricultural crops, forests, and savanna (tree-grass) systems, including the effects of grazing, erosion, tillage, crop rotations, irrigation, fertilization and fire events. The grassland/crop submodel simulates plant production for different herbaceous crops and plant communities. The forest submodel simulates the growth of deciduous or evergreen forests. The savanna system is simulated as a tree-grass system, essentially using the existing tree and grassland/crop submodels with the two subsystems interacting through shading effects and nitrogen competition. Plant growth is affected by soil structure, water and nutrient availability, soil temperature ,climatic data and potential plant genetic traits. Furthermore, it is possible to include the impacts of future changes in atmospheric CO2 concentration on Net Primary Production (NPP) and, indirectly, on SOM.
In this study I used the CENTURY 5 Ecosystem model version, as distributed by developers (Natural Resource Ecology Laboratory at Colorado State University)
possibility to run with different soil layers having a different depth), new erosion and deposition submodels. Additional input/output file formats are also added.
The model requires the following input data: climate (monthly values of precipitation, maximum and minimum temperature), soil texture (clay, silt and sand content), and physical variables (pH, bulk density, organic carbon concentration, wilting point and field capacity), and plant specific parameters.
3.2
SOIL DATA
Soil data used in this work (texture, pH, organic carbon concentration, and bulk density) for the CENTURY runs were obtained from the HWSD (Harmonized World Soil Database), version 1.2 (FAO, 2012) ( http://www.fao.org/soils-portal/soil-survey/soil-maps-and-databases/harmonized-world-soil-database-v12). This dataset is the result of the combination of existing regional and national updates of soil information worldwide (European Soil Database, SOTER and WISE Databases, Soil Map of China, Regional and Soil Map of the World). The HWSD is composed of a GIS raster image linked to a database of soil attributes in Microsoft Access format. The spatial data for the HWSD map are organized in a raster format of 30 x 30 arc-seconds. This corresponds to a grid cell size of about 0.93 km × 0.93 km (0.86 km2) at the equator and is adequate for broad scale inventories (Batjes, 2016). The HWSD attribute database provides information on the soil unit composition for each of the 15773 soil mapping units. The standardized soil parameters are organized in two different layers, topsoil (0.0-0.3 m) and subsoil (0.3-1.0 m). In the simulations I used the whole soil profile (1.0 m depth) when available or, when not available, the topsoil layer. The wilting point and field capacity values, not supplied by HWSD, were estimated using a pedotransfert rule (Saxton et al., 1986) and corrected accounting for the rock fragment content.
3.3
CLIMATE DATA
Climate data was obtained from the EURO-CORDEX Project (Coordinated Downscaling Experiment – European Domain) (http://www.euro-cordex.net/). This is an initiative sponsored by the World Climate Research Program (WCRP) with the aim to organize a coordinated model evaluation framework providing climate change projections for all European regions. Regional simulations at high resolution (12.5 km) are available by the activities carried out in the Coupled Model Intercomparison Project Phase 5 (CMIP5). For this study I selected three different GCMs (CNRM-CM5, EC-EARTH, MPI-ESM-LR), both for the actual climate (1970-2005) and projections (2006-2100). Future projections are driven by two different GHGs emission scenarios, based on the IPCC emission scenarios. The selected scenarios simulates a moderate (RCP4.5) and extreme (RCP8.5) climate change condition (Meinshausen et al., 2011). The RCP4.5 is a stabilization scenario where total radiative forcing is stabilized before 2100 by employment of a range of technologies and strategies for reducing greenhouse gas emissions (van Vuuren et al., 2006, 2007). The RCP8.5 is characterized by increasing GHGs emissions over time representative for scenarios in the literature leading to high greenhouse gas concentration levels (Rao & Riahi, 2006; Riahi et al., 2007). Future scenarios of atmospheric CO2 variation were associated to each climate scenario and included in the CENTURY 5 simulations.
3.4
LAYER LINKAGE AND SPIN-UP PHASE
The available version of CENTURY 5 works at local scale (single points), making difficult the applications of CENTURY on wide scales, e.g. regional SOC estimations. A significant part of my work was dedicated to implementing a methodology for the application of CENTURY on wide areas than to a single point. It was made also thanks to a collaboration and a continuous exchange of opinions with the developers (especially with Dr. Tom Hilinski, Colorado State University, USA) established at the beginning of the PhD course. The developed methodology is based on the use of the GIS, and on the coupling of CENTURY 5 with Microsoft Visual Basic and R Studio custom scripts to automate its sequential work. Using ArcMap 10.1© the soil, climate, and land cover layers were overlaid and cut using the land cover grid as guide template, obtaining as result a NetCDF file with all the cited attributes for each grid cell. I then compiled the scripts in Microsoft Visual Basic and R Studio to automate the CENTURY 5 sequential runs of each grid cell.
Due to the impossibility to know the real historical land use for wide areas, I made some basic assumptions. In particular, I assumed that the forestry species (broad-leaved, coniferous, and mixed forests), and shrubs and/or herbaceous associations have always been in those territories. For the permanent tree crops, I simulated the presence of a natural grassland until 1920 and the subsequent tree crop cultivation. I have not considered the land cover management because of the wide scale of this work and, in addition, because there is no information about it at the spatial resolution adopted in the analysis. These assumptions could cause uncertainties in the results because some land cover changes may have taken place during the future projections. To rightly allocate the initial C content between the different SOC pools considered by CENTURY 5, a long equilibrium (spin-up phase) was necessary. Various promising spin-up approaches have been evaluated, based on Bayesian calibration
approaches require an extremely large amount of measured data for the spatial area considered in this work. To initialize the CENTURY 5 spin-up phase I used the organic carbon concentration values from the HWSD. Although I set this initial value for each grid cell, according to the length of the spin-up led CENTURY 5 to an equilibrium phase completely independent from the initial SOC value (Lugato et al., 2014). During the spin-up phase, I ran the model for 5000 years using the 1970-2005 climate data as reference climate for each of the chosen GCM to estimate the current SOC stock (at the year 2005) following the scheme adopted by Chiti et al. (2010). Starting from the 2006, CENTURY 5 was then run with the two climatic scenarios of each GCM until the year 2095.
4. CHAPTER
1
CURRENT SOC STOCK AND FUTURE PROJECTIONS IN ITALIAN
FORESTRY AND TREE CROP SURFACES
4.1
STUDY AREA AND INPUT DATA
The study area covers all forested and tree crop surfaces of Italy. The Land Cover information were obtained by the IUTI (Italian Land Use Inventory) map realized in the framework of the Extraordinary Plan of Environmental Remote Sensing (Marchetti et al., 2012).
In the framework of the national research project CARBOTREES, the IUTI map was furtherly developed, and the version used in this thesis was courtesy provided by the developers.
To allow the application of CENTURY 5, I reclassified the forested and tree crop areas in 7 classes (broad-leaved forest, coniferous forest, Mediterranean maquis, vineyard, orchard, olive grove, natural grassland). All these land cover classes covered about the 52% of the Italian surface (Table 1, Figure 5). The NetCDF file obtained by the overlapping of the different informative layers, at 500 m resolution, totally includes 630,276 grid cells.
I used the default parameterizations provided by CENTURY 5 for broad-leaved forests, coniferous forests, Mediterranean maquis, and natural grasslands. The parameterization for vineyards, orchards, and olive groves come from Lugato et al. (2014).
Table 1. Surface occupied by each land cover class. IPCC
classes IUTI code Land Cover classes Surface (ha) % of Italian Surface
Forest
land 1.1 Broad-leaved forest 8,739,025 25.68
Coniferous forest 3,081,900 9.06 Mediterranean maquis 534,650 1.57
Cropland 2.2.1 Vineyard 824,500 2.42
Orchard 668,975 1.97
Olive grove 1,697,250 4.99
Grassland 3.1 Natural grassland 2,155,700 6.33
4.2
RESULTS AND DISCUSSION
4.2.1 ACTUAL SOC STOCK
The SOC stock estimates in forestry and tree crop soils are mainly related to the specific distribution and environmental conditions, unlike the SOC estimates in croplands where anthropogenic activities have a strong influence. In this work I simulated the current SOC stock, referred to the year 2005 (baseline) in forestry, natural grassland and tree crop Italian surfaces, for the three selected GCMs (Table 2). The mean SOC stock values (average between the GCMs) and their spatial distribution in the study area were reported in Figure 6.
Table 2. Actual SOC stock at the year 2005 (0.0-1.0 m depth).
UdS CNRM-CM5 EC-EARTH MPI-ESM-LR CNRM-CM5 EC-EARTH MPI-ESM-LR (Mg C ha-1) (Tg C) Broad-leaved forest 80.3 (1.3) 80.3 (1.2) 80.3 (1.3) 701.4 701.4 701.4 Coniferous forest 129.5 (201.1) 95.7 (98.5) 109.1 (155.9) 399.2 294.9 336.2 Mediterranean maquis 86.9 (95.4) 83.7 (30.5) 81.3 (35.8) 46.5 44.8 43.4 Natural grassland 52.7 (3.3) 52.8 (3.3) 52.6 (3.5) 113.6 113.8 113.5 Vineyard 51.5 (1.4) 51.7 (1.5) 51.6 (1.5) 42.5 42.7 42.5 Olive grove 51.6 (1.6) 51.9 (1.5) 51.7 (1.7) 87.6 88.1 87.8 Orchard (1.2) 51.3 (1.4) 51.7 (1.4) 51.5 34.4 34.6 34.5 Total 1425.1 1320.1 1359.3
Considering all land cover classes, the mean SOC stock values ranged from 51.40 to 129.50 Mg ha-1. The minimum mean value was observed for the orchard category (51.30±1.20 Mg ha-1), followed by vineyards (51.50±1.40 Mg ha-1), and olive groves (51.60±1.60 Mg ha-1). The highest mean value was found in coniferous forests (129.50±201.10 Mg ha-1).
High mean SOC stock values correspond also to Mediterranean maquis, ranging between 86.90±95.40 and 81.30±35.80 Mg ha-1, and to broad-leaved forests (80.30±1.30 Mg ha-1). The mean SOC stock values simulated for the natural grassland range from 52.80±3.30 to 52.60±3.50 Mg ha-1.
For coniferous forests, CENTURY 5 simulated the highest mean value when was driven by the climate model CNRM-CM5 (129.50±201.10 Mg ha-1), followed by MPI-ESM-LR (109.10±155.90 Mg ha-1) and EC-EARTH (95.70±98.50 Mg ha-1). Also for the Mediterranean maquis systems, the model simulated the highest mean value when was driven by CNRM-CM5 (86.90±95.40 Mg ha-1), followed by EC-EARTH (83.70±30.50 Mg ha-1) and MPI-ESM-LR (95.70±98.50 Mg ha-1).
The high standard deviations associated to the mean SOC values for the coniferous forests are probably due to the wide spatial distribution throughout the Italian peninsula, in environments extremely heterogeneous. In particular, I obtained SOC stock values very high in the Alps, where the Alpine climate ensures high rainfall and low temperatures. Probably, also the long spin-up phase (5000 years), necessary to rightly allocate the initial C content in the different SOC pools considered by CENTURY 5, influenced these data.
The high variability associated with the Mediterranean maquis derived from the differences in species composition and shrub architecture of these systems (Costa & La Mantia, 2005).
The total SOC stock in forestry and tree crop Italian soils, to 1 meter depth, ranges from 1320.10 to 1425.10 Tg, considering all the different GCMs.
The broad-leaved forests cover almost half of the simulated area, then considering a mean SOC stock of 80.30 Mg ha-1, resulted a total SOC storage of 701.40 Tg.
Conversely, the coniferous forests covered only the 17.4% of the whole area but the total SOC stock stored was very high (ranges from 294.90 to 399.20 Tg).
Although the high mean SOC values simulated in the areas covered by Mediterranean maquis, these plant systems occupy a small surface (just 3%, mainly in Sardinia) compared to the whole area, providing a contribution to the total SOC stock that ranges from 43.40 to 46.50 Tg.
Despite the mean SOC stock values that ranges between 52.80±3.30 and 52.60±3.50 Mg ha-1, the natural grasslands made a significant contribution (about 113 Tg) in terms of total SOC stock, covering the 6.33% of the Italian area.
The tree crops, due to the lower SOC stored and surfaces occupied than the forestry systems, provided a limited contribution to the total SOC stock. The olive groves covers the 4.99% of Italian surface, followed by vineyards (2.42%) and orchards (1.97%), contributing in terms of total SOC stock with about 88 Tg, 42 Tg and 34 Tg, respectively.
Figures 7a, 7b, 7c, 7d, 7e, 7f, 7g showed the boxplot of actual SOC stock for each land cover class studied in Italy.
Figure 7a. Boxplot of actual SOC stock broad-leaved forest for each GCM (year 2005).
Figure 7e. Boxplot of actual SOC stock in Mediterranean maquis for each GCM (year 2005).
In this study the performance of CENTURY 5 were evaluated for each land cover class through the analysis of variance (ANOVA) to analyze the differences between the SOC results obtained when the model was driven by the different GCMs. Subsequently a post-hoc analysis, the Tukey’s test, was done to find data that statistically different from each other. For broad-leaved forests, the statistical analysis showed that there are not significant differences between the SOC results from the different climate models (Figure 7a).
In the coniferous forests the statistical analysis showed significant differences between the climate models (Figure 7b).
Also for Mediterranean maquis systems (Figure 7e), the ANOVA and the Tukey’s test indicated that the averages and the standard deviations significantly differed between the GCMs. Less marked were the differences between the SOC values obtained from the different climate models in the other land cover classes (Figure 7c; 7d; 7f; 7g). However, all these land cover classes reported different averages and standard deviations for each GCM.
The analysis of the literature highlighted a noticeable data shortage in the SOC estimation at regional scale for forestry and tree crop surfaces. Also the applied methodologies are often quite different and not directly comparable. In this thesis most of the results have been compared in terms of carbon per unit of surface.
I compared the mean SOC stock with field data referred to different sources (soil databases, forest inventories) to check whether the simulations were comparable (Table 3).
Considering the simulated mean SOC stock for broad-leaved forests (80.3±1.3 Mg ha-1), similar data were reported for Italy in “Inventario Nazionale delle Foreste dei serbatoi
forestali di Carbonio” (INFC, 2005) with a mean value of 72.21±4.46 Mg ha-1. Analogous
mean SOC stock values were also reported for Spain: 93.60±58.20 Mg ha-1 (Rodriguez-Murillo, 2001), 73.30±16.70 Mg ha-1 (Doblas-Miranda et al., 2013), and 65.24±35.05 Mg ha-1 (Rodríguez-Martín et al., 2016).
For coniferous forests, I compared the results with the same previous works. The mean SOC stock value of 111.40±151.80 Mg ha-1 obtained for the coniferous was compared with the data reported for Italy in the INFC (77.88±7.17 Mg ha-1). For the same land cover class other authors reported in Spain a mean value of 75.80±66.90 Mg ha-1 (Rodriguez-Murillo, 2001), 94.60±21.30 Mg ha-1 (Doblas-Miranda et al., 2013) and 65.21±32.12 Mg ha-1 (Rodríguez-Martín et al., 2016). Probably these differences are attributable to the different surfaces considered in these works. Also the high variability associated with the mean data could be justified by the large areas analyzed, characterized by heterogeneous pedologic and climatic conditions.
Similar data to the mean SOC stock obtained for Mediterranean maquis (84.0±53.90 Mg ha-1) was reported for Spain by Doblas-Miranda et al. (2013) (93.70±4.37 Mg ha-1), and by Rodríguez-Martín et al. (2016) (62.30±35.23 Mg ha-1). In this case the differences between
the data are mainly attributable to the structural and morphological heterogeneity of Mediterranean maquis systems (Sirca et al., 2016).
Many scientific papers reported data corresponding to pastures for the Mediterranean area, but few of these referred to natural grasslands. For this land cover class I compared the simulated results (52.70±3.40 Mg ha-1) with that reported by Evrendilek et al. (2004) for southern Turkey (57.30±0.26 Mg ha-1) and by Rodríguez-Martín et al. (2016) for Spain (68.13±40.73 Mg ha-1).
For the tree crop areas I compared my results with those reported for Italy by Chiti et al. (2012). CENTURY 5 simulated a mean value of 51.60±1.50 Mg ha-1 for vineyards, 51.70±1.60 Mg ha-1 for olive groves and 51.50±1.30 Mg ha-1 for orchards. Chiti et al. (2012) reported a mean value of 41.90±15.90 Mg ha-1 for vineyards, 51.50±19.80 Mg ha-1 for olive groves and 44.10±12.10 Mg ha-1 for orchards. Similar data was also reported for Spain by Rodriguez-Murillo (2001) for vineyards (42.50±28.90 Mg ha-1) and olive groves (39.90±28.30 Mg ha-1).
Table 3. Comparison between the mean SOC stock at the year 2005 and other works. Modeled SOC (0.0-1.0 m) INFC (0.0-0.3 m) Chiti et al., 2012 (0.0-0.3 m) Doblas-Miranda et al., 2013 (0.0-1.0 m) Evrendilek et al., 2004 (0.0-0.2 m) Rodriguez-Murillo, 2001 (0.0-1.0 m) Rodriguez Martin et al., 2016 (0.0-0.3 m) UdS (Mg C ha-1) Broad-leaved forest 80.25 (1.25) 72.21 (4.46) 73.33 (16.7) 93.60 (58.2) 65.24 (35.05) Coniferous forest 111.43 (151.81) 77.88 (7.16) 94.60 (21.3) 75.80 (66.9) 65.21 (32.12) Mediterranean maquis 83.96 (53.91) 93.70 (4.37) 62.3 (35.23) Natural grassland 52.71 (3.38) 57.32 (0.26) 68.13 (40.73) Vineyards 51.62 (1.49) 41.90 (15.9) 42.50 (28.9) Olive groves 51.73 (1.61) 51.50 (19.8) 39.90 (28.3) Orchards 51.52 (1.34) 44.10 (12.1)
4.2.2 FUTURE SOC PROJECTIONS
The future projections in Italy showed that the mean SOC stock, referred to each land cover class, tends to decrease from the year 2005 to 2095 (Table 4). Generally, for all GCMs, CENTURY 5 simulated a greater decrease of mean SOC stock for the extreme scenario (RCP8.5) compared to the moderate (RCP4.5).
Considering the broad-leaved forests, the model simulated very low decreases of mean SOC if considered a century of time. Only when CENTURY 5 was driven with the climate model MPI-ESM-LR, the results showed at the year 2095 an increase of mean SOC stock, only for the RCP8.5.
The future projections in coniferous forests showed greater decreases of mean SOC compared to the broad-leaved, especially when the simulations concerned the RCP8.5 and the climate models EC-EARTH and MPI-ESM-LR.
For the other land use classes (Mediterranean maquis, natural grassland, vineyard, olive grove, and orchard) the model simulated very low decreases. Also for these classes, the largest decreases of mean SOC have been reported when CENTURY 5 was driven with the model MPI-ESM-LR for the extreme scenario.
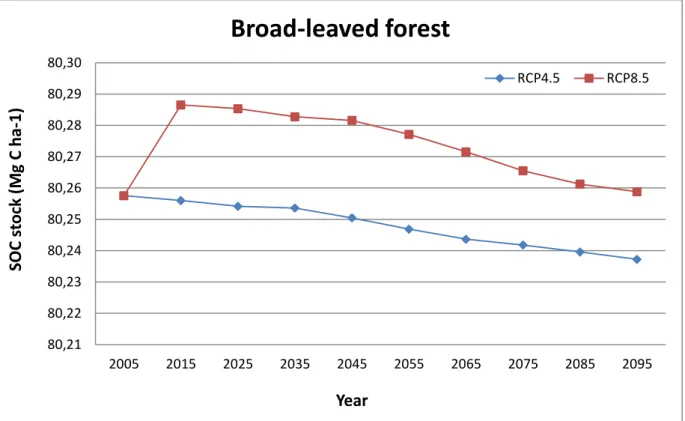
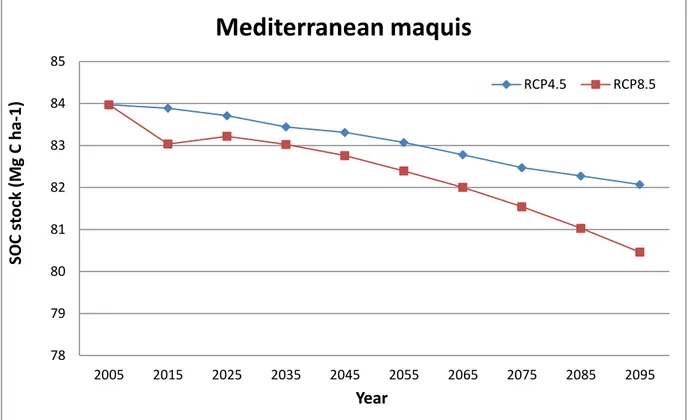
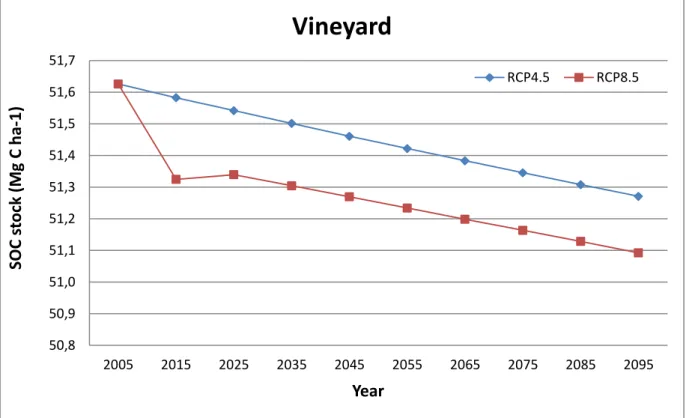
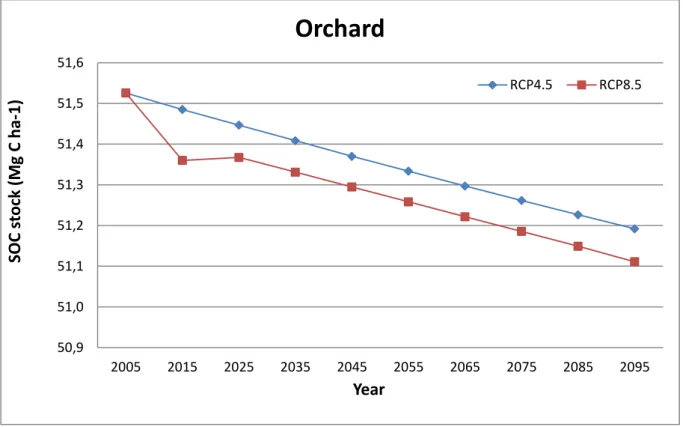
Figures 8a, 8b, 8c, 8d, 8e, 8f, 8g showed the future projections of mean SOC stock for each land cover class. The graphics reported the different trends from the year 2005 to 2095, with time steps of decades, between the moderate climate scenario (RCP4.5) and the extreme (RCP8.5). These values represent the average of the different GCMs.
Table 4. Future projections of mean SOC stock (Mg C ha-1) for each land cover class (0.0-1.0 m depth).
RCP4.5 RCP8.5
Uds Year CNRM-CM5 EC-EARTH MPI-ESM-LR CNRM-CM5 EC-EARTH MPI-ESM-LR
(Mg C ha-1) Broadleaved forest 2005 80.26 (1.3) 80.26 (1.2) 80.26 (1.3) 80.26 (1.3) 80.26 (1.2) 80.26 (1.3) 2095 80.24 (1.1) 80.24 (0.9) 80.24 (1.1) 80.23 (1.0) 80.24 (0.9) 80.31 (1.1) Coniferous forest 2005 129.53 (201.1) 95.67 (98.5) 109.09 (155.9) 129.53 (201.1) 95.67 (98.5) 109.09 (155.9) 2095 128.77 (207.1) 93.13 (102.0) 107.71 (160.8) 127.03 (207.5) 90.79 (102.3) 101.89 (158.5) Mediterranean maquis 2005 86.89 (95.4) 83.75 (30.5) 81.26 (35.8) 86.89 (95.4) 83.75 (30.5) 81.26 (35.8) 2095 85.28 (97.5) 81.36 (31.1) 79.57 (36.6) 84.10 (97.4) 80.40 (31.1) 76.88 (37.0) Natural grassland 2005 52.70 (3.3) 52.80 (3.3) 52.63 (3.5) 52.70 (3.3) 52.80 (3.3) 52.63 (3.5) 2095 52.68 (3.3) 52.78 (3.3) 52.60 (3.5) 52.66 (3.2) 52.76 (3.2) 52.21 (3.3) Vineyard 2005 51.54 (1.4) 51.74 (1.5) 51.60 (1.5) 51.54 (1.4) 51.74 (1.5) 51.60 (1.5) 2095 51.21 (1.1) 51.37 (1.1) 51.23 (1.2) 51.20 (1.1) 51.35 (1.1) 50.73 (1.0) Olive grove 2005 51.61 (1.6) 51.88 (1.5) 51.71 (1.7) 51.61 (1.6) 51.88 (1.5) 51.71 (1.7) 2095 51.19 (1.2) 51.32 (1.2) 51.31 (1.3) 51.42 (0.9) 51.32 (1.1) 51.25 (1.2) Orchard 2005 51.35 (1.2) 51.68 (1.4) 51.55 (1.4) 51.35 (1.2) 51.68 (1.4) 51.55 (1.4) 2095 51.06 (0.9) 51.32 (1.1) 51.20 (1.1) 51.05 (0.9) 51.30 (1.1) 50.99 (1.0)
Figure 8a. Future projections of mean SOC stock from 2005 to 2095 in broad-leaved forests.
Figure 8b. Future projections of mean SOC stock from 2005 to 2095 in coniferous forests.
80,21 80,22 80,23 80,24 80,25 80,26 80,27 80,28 80,29 80,30 2005 2015 2025 2035 2045 2055 2065 2075 2085 2095 SOC st ock (M g C ha -1) Year
Broad-leaved forest
RCP4.5 RCP8.5 100 102 104 106 108 110 112 2005 2015 2025 2035 2045 2055 2065 2075 2085 2095 SOC st oc k (M g C h a-1) YearConiferous forest
RCP4.5 RCP8.5Figure 8c. Future projections of mean SOC stock from 2005 to 2095 in Mediterranean maquis areas. 78 79 80 81 82 83 84 85 2005 2015 2025 2035 2045 2055 2065 2075 2085 2095 SOC st oc k (M g C h a-1) Year
Mediterranean maquis
RCP4.5 RCP8.5 52,45 52,5 52,55 52,6 52,65 52,7 52,75 2005 2015 2025 2035 2045 2055 2065 2075 2085 2095 SOC st oc k (M g C h a-1) YearNatural grassland
RCP4.5 RCP8.5Figure 8e. Future projections of mean SOC stock from 2005 to 2095 in vineyards.
Figure 8f. Future projections of mean SOC stock from 2005 to 2095 in olive groves.
50,8 50,9 51,0 51,1 51,2 51,3 51,4 51,5 51,6 51,7 2005 2015 2025 2035 2045 2055 2065 2075 2085 2095 SOC st oc k (M g C h a-1) Year
Vineyard
RCP4.5 RCP8.5 51,0 51,1 51,2 51,3 51,4 51,5 51,6 51,7 51,8 51,9 2005 2015 2025 2035 2045 2055 2065 2075 2085 2095 SOC st oc k (M g C h a-1) YearOlive grove
RCP4.5 RCP8.5Figure 8g. Future projections of mean SOC stock from 2005 to 2095 in orchards. 50,9 51,0 51,1 51,2 51,3 51,4 51,5 51,6 2005 2015 2025 2035 2045 2055 2065 2075 2085 2095 SOC st oc k (M g C h a-1) Year
Orchard
RCP4.5 RCP8.5In Italy, the future projections from the year 2005 to 2095 (average of the GCMs) reported different trends of mean SOC stock for each land cover class and climate scenario hypothesized.
For the surfaces covered with broad-leaved forests (Figure 8a), the trend of mean SOC stock had a strong initial growth with the extreme scenario (RCP8.5), and subsequently a gradual decrease to a final value slightly higher than the year 2005. Instead with the moderate scenario (RCP4.5) the trend showed a progressive decrease between the year 2005 and 2095. For coniferous forests (Figure 8b), the model simulated a slight gradual decrease of mean SOC stock with the moderate scenario, while the decrease is more pronounced with the RCP8.5.
In surfaces covered by Mediterranean maquis CENTURY 5 simulated similar trends to coniferous forests, reporting a major decrease of mean SOC stock with the extreme scenario than the moderate (Figure 8c).
For the surfaces covered by natural grasslands, the results showed clear differences between the two climate scenarios (Figure 8d). When the model was driven by the moderate scenario, it simulated a small decrease in SOC stock up to 2095, instead the decrease is stronger with the extreme scenario.
The future projections of mean SOC stock in vineyards and orchards reported similar trends (Figure 8e; 8g). The model simulated progressive decreases for both the climate scenarios, more pronounced in the extreme.
Instead, examining the results on surfaces covered with olive groves, the model simulations showed a greater decrease with the moderate scenario than the extreme (Figure 8f).
Considering the future projections of total SOC stock, for all GCMs and land cover classes, CENTURY 5 simulated greater decreases for the extreme scenario (RCP8.5) compared to the moderate (RCP4.5) (Tables 5a; 5b).
For the broad-leaved forests, the model simulated very low decreases of total SOC. Only when CENTURY 5 was driven with the MPI-ESM-LR, the model reported at the year 2095 an increase of total SOC stock, only for the RCP8.5.
Generally, the coniferous forests showed the largest decreases, especially when CENTURY 5 was driven with the climate models EC-EARTH and MPI-ESM-LR, and the simulations concerned the extreme scenario.
For the other land use classes (Mediterranean maquis, natural grassland, vineyard, olive grove, and orchard) the model simulated very low decreases. Also for these classes, the largest decreases of total SOC stock referred to the simulations when CENTURY 5 was driven with MPI-ESM-LR for the scenario RCP8.5.
Table 5a. Future projections of total SOC stock (Tg C) for each land cover class (0.0-1.0 m depth). Differences between 2005 and 2095 for
each GCM and soil cover were statistically analyzed with the ANOVA and Tukey’s test for p<0.01.
RCP4.5 RCP8.5
Uds Year CNRM-CM5 EC-EARTH MPI-ESM-LR CNRM-CM5 EC-EARTH MPI-ESM-LR
(Tg C) Broad-leaved forest 2005 701.4 701.4 701.4 701.4 701.4 701.4 2095 701.2 701.1 701.1 701.1 701.1 701.7 Coniferous forest 2005 399.2 294.9 336.2 399.2 294.9 336.2 2095 396.8 (n.s.) 287.0 331.9 (n.s.) 391.5 279.8 314.0 Mediterranean maquis 2005 46.5 44.8 43.4 46.5 44.8 43.4 2095 45.5 (n.s.) 43.5 42.5 44.9 42.9 41.1 Natural grassland 2005 113.6 113.8 113.5 113.6 113.8 113.5 2095 113.5 (n.s.) 113.7 (n.s.) 113.4 (n.s.) 113.5 (n.s.) 113.7 (n.s.) 112.5 Vineyard 2005 42.5 42.5 42.7 42.5 42.5 42.7 2095 42.2 42.3 42.2 42.21 42.3 41.8 Olive grove 2005 87.6 88.1 87.8 87.6 88.1 87.8 2095 86.8 87.1 87.0 87.2 87.1 86.9 Orchard 2005 34.4 34.6 34.5 34.4 34.6 34.5 2095 34.1 34.3 34.2 34.1 34.3 34.1
Table 5b. Future projections of total SOC stock (Tg C) for each land cover class (0.0-1.0 m depth). Differences between RCP4.5 and
RCP8.5 (year 2095) for each GCM and soil cover were statistically analyzed with the ANOVA and Tukey’s test for p<0.01.
Uds CNRM-CM5 EC-EARTH MPI-ESM-LR
Year RCP4.5 RCP8.5 RCP4.5 RCP8.5 RCP4.5 RCP8.5 (Tg C) Broad-leaved forest 2095 701.2 701.1 (n.s.) 701.1 701.1 (n.s.) 701.1 701.7 Coniferous forest 2095 396.8 391.5 (n.s.) 287.0 279.8 331.9 314.0 Mediterranean maquis 2095 45.5 44.9 (n.s.) 43.5 42.9 42.5 41.1 Natural grassland 2095 113.5 113.5 (n.s.) 113.7 113.7 (n.s.) 113.4 112.5 Vineyard 2095 42.2 42.21 (n.s.) 42.3 42.3 (n.s.) 42.2 41.8 Olive grove 2095 86.8 87.2 87.1 87.1 (n.s.) 87.0 86.9 Orchard 2095 34.1 34.1 (n.s.) 34.3 34.3 34.2 34.1
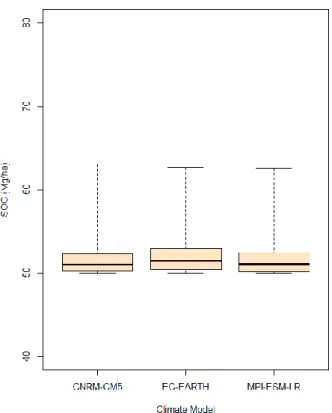
Figure 9 clearly showed that the total SOC stock in Italy tended to progressively decrease for each GCM and climate scenario hypothesized. The highest values of total SOC stock for the Italian surface were simulated when CENTURY 5 was driven with the climate model CNRM-CM5, followed by MPI-ESM-LR and EC-EARTH. Differences marked after the year 2050 (CNRM-CM5, EC-EARTH), when the trends began to diverge among the two scenarios. Conversely, when CENTURY 5 was driven by the MPI-ESM-LR model, it simulated a distinct trend between the scenarios. On average, the total SOC stock will decrease by 0.75% (13 Tg C) between 2005 and 2095 (Table 6).
Figure 9. Future projections of total SOC stock for each GCM and climatic scenario. Data
Table 6. Total SOC stock of all land cover classes. The trends represent the difference
between the year 2095 and 2005.
RCP4.5 RCP8.5 CNRM-CM5 EC-EARTH MPI-ESM-LR CNRM-CM5 EC-EARTH MPI-ESM-LR (Tg C) Year 2005 1425.10 1320.12 1359.28 1425.10 1320.12 1359.28 2095 1420.50 1309.25 1352.64 1414.81 1301.49 1332.39 Trend (%) -0.32 -0.48 -1.36 -0.77 -0.62 -0.98 Trend (Tg C) -4.59 -10.87 -6.63 -10.29 -18.63 -26.88
The future projections obtained in this work were compared with the results reported by other authors that simulated future changes of total SOC stock, mainly with other land cover classes (Table 7).
Mondini et al. (2011), using the Roth-C model, simulated the SOC projections for 6 agricultural land use classes (grassland, arable, horticulture, vineyards, olive trees and industrial crops). They reported a SOC stock decrease of 7.4% in Italy. It is important to highlight that the model predicted SOC stock decreases also for the fertilized soils.
Smith et al. (2005) reported future projections of total SOC stock for grassland and cropland surfaces in Europe, obtaining a mean decrease of 12% and 8%, respectively.
Jones et al. (2005) simulated future projections for the total SOC stock at global level using two different models (Roth-C and HadCM3LC), reporting for both SOC decreases. Despite the two models show a similar trend, HadCM3LC simulates a total loss of 140 Gt C, instead Roth-C simulates a loss of 86 Gt C over the 21 century, showing how the SOC estimates were
In a study of SOC stock future changes in Japanese forest soils, Hashimoto et al. (2012) obtained, using Century 4.0 model, a decrease of 5%. They motivated this result saying that the potential increases in plant production would not compensate the increases in soil respiration caused by rising global temperatures. This result was a lower decrease compared to the previous mentioned works.
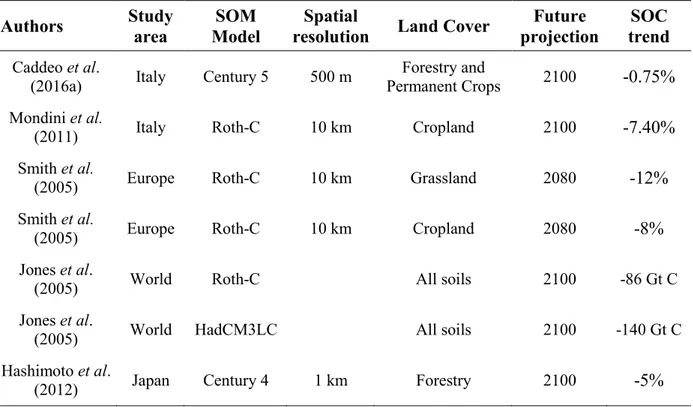
Table 7. Comparison between the future trend of total SOC stock and the results reported in
other works.
Authors Study area Model SOM resolution Spatial Land Cover projection Future trend SOC
Caddeo et al.
(2016a) Italy Century 5 500 m
Forestry and
Permanent Crops 2100 -0.75%
Mondini et al.
(2011) Italy Roth-C 10 km Cropland 2100 -7.40%
Smith et al.
(2005) Europe Roth-C 10 km Grassland 2080 -12%
Smith et al.
(2005) Europe Roth-C 10 km Cropland 2080 -8%
Jones et al.
(2005) World Roth-C All soils 2100 -86 Gt C
Jones et al.
(2005) World HadCM3LC All soils 2100 -140 Gt C
Hashimoto et al.
Spatial SOC estimates are important to evaluate the impacts of climate change on soil C stock, and to understand the real capacity of soils to store carbon. These data are useful to also predict the SOC stock changes in future studies.
Future SOC stock predictions in forestry, natural grassland and tree crop surfaces in Italy showed small SOC losses compared to other land cover classes. Probably, as confirmed by Hashimoto et al. (2012), the increases in NPP would not compensate the increases in the SOM mineralization caused by the global warming.
In Italy the surface covered by forests is increasing in recent decades. Therefore, a greater surface covered with woodland could facilitate the achievement of the targets signed by Italy at International level (PK, UNFCCC).
5. CHAPTER
2
CURRENT SOC STOCK AND FUTURE PROJECTIONS IN EUROPEAN
WOODLAND AND PERMANENT CROP SOILS
5.1 STUDY AREA AND INPUT DATA
The study area covers the forestry and permanent tree crop surfaces in a Euro-Mediterranean area (lon -9°43’66’’ to 40°41’42’’; lat 30°79’35’’ to 54°94’47’’), totally 75,084,400 ha (Table 8). Land Cover information were obtained from Corine Land Cover 2006 (CLC2006), freely available (http://www.eea.europa.eu/data-and-maps/data/corine-land-cover-2006-clc2006). This map represent a high level detail of land cover information at 100 m resolution. Due to the difficulties of working with a huge number of points for a large area, using ArcMap 10.1©, I created a mask (1 km resolution), starting from the CLC2006 (100 m resolution), applying the criterion of majority land cover. Always through ArcMap 10.1©, I overlaid and cut the soil and climate layers using the new mask, obtaining a NetCDF file (overall 750,834 grid cells) with all the attributes.
For this study I selected only three vegetation typologies (permanent crops, woodland, shrubs and/or herbaceous vegetation associations). The three typologies totally include ten land cover classes: vineyard, orchard, olive grove, broad-leaved forest, coniferous forest, mixed forest, natural grassland, moors and heathland, Mediterranean maquis, transitional woodland-shrub. The spatial distribution of selected land cover classes was reported in Figure 10.
To simulate SOC stock in vineyards, orchards and olive groves I used the same parameterizations of Lugato et al. (2014). Conversely, for the other typologies (woodland, shrubs and/or herbaceous vegetation associations), I modified the parameterizations provided by the CENTURY model.
Table 8. Surface occupied by each land cover class (Corine Land Cover 2006).
Typologies CLC06 code Land Cover class Surface (ha)
Permanent crops 221 Vineyard 1,937,700
222 Orchard 1,599,600
223 Olive grove 1,077,600
Woodland 311 Broad-leaved forest 22,122,800
312 Coniferous forest 17,140,300
313 Mixed forest 9,637,500
Scrub and/or herbaceous
vegetation associations 321 Natural grassland 7,534,200
322 Moors and heathland 1,388,900
323 Mediterranean maquis 3,365,400
324 Transitional woodland-shrub 9,280,400
The modeled results were compared with LUCAS measured values (Land Use/Land Cover Area Frame Survey, 2009). This dataset is a soil survey from the European Commission to sample and analyze the main properties of topsoil in EU-23. Topsoil samples were collected from 10% of the general survey points: the final database contains 19,967 geo-referenced points. A sampling procedure was used to collect 0.5 kg of topsoil, corresponding to 0.0-0.20 m depth. The samples were collected for all land use/land cover typologies (mainly on agricultural areas), and analyzed in a single ISO-certified laboratory to obtain physical and chemical parameters. SOC data was expressed as concentration (g C kg-1); using a pedotransfert function (Hollis et al., 2012), and considering also rock fragments content, I obtained bulk density values to convert this concentration to a stock.
5.2 RESULTS AND DISCUSSION
5.2.1 ACTUAL SOC STOCK
In this work I simulated the current SOC stock (1.0 m soil depth), referred to the year 2005 (baseline), in a Euro-Mediterranean area using CENTURY 5 model for three different GCMs (Table 9). The mean SOC stock values (average between the GCMs) and the spatial distribution in the study area were reported in Figure 11.
Considering all land cover classes, the mean SOC stock values ranged between 50.03±12.86 to 115.75±192.52 Mg ha-1. The minimum mean SOC stock value was simulated in transitional woodland-shrub surfaces (50.03±12.86 Mg ha-1), followed by permanent crops (vineyard, orchard, and olive grove), and natural grassland.
The highest mean value was obtained in mixed forests (115.75±192.52 Mg ha-1), followed by coniferous forests.
High mean SOC stock values correspond also to Mediterranean maquis ( from 81.70 to 86.31 Mg ha-1) and to broad-leaved forests (from 80.24 to 80.54 Mg ha-1).
For coniferous forests, CENTURY 5 simulated the highest mean value when was driven by the climate model CNRM-CM5 (114.07±207.22 Mg ha-1), followed by MPI-ESM-LR (113.57±210.130 Mg ha-1) and EC-EARTH (99.44±165.06 Mg ha-1). Also for the Mediterranean maquis systems, the model simulated the highest mean value when was driven by CNRM-CM5 (86.31±75.84 Mg ha-1), followed by MPI-ESM-LR (81.80±78.12 Mg ha-1) and EC-EARTH (82.70±78.93 Mg ha-1).
Conversely, for mixed forests CENTURY 5 simulated the highest mean value when was driven by the climate model MPI-ESM-LR (86.31±75.84 Mg ha-1), followed by CNRM-CM5 (109.68±163.50 Mg ha-1) and EC-EARTH (100.72±116.55 Mg ha-1).
Also for the moors and heathland, the model simulated the highest mean value when was driven by the climate model MPI-ESM-LR (78.81±130.17 Mg ha-1), followed by CNRM-CM5 (74.00±119.22 Mg ha-1) and EC-EARTH (62.04±106.26 Mg ha-1).
The high standard deviations associated to the mean SOC values for the coniferous forests, mixed forests, and moors and heathland are probably due to the wide spatial distribution, in environments extremely heterogeneous. Probably, also the long spin-up phase (5000 years), necessary to rightly allocate the initial C content in the different SOC pools considered by CENTURY 5, influenced these data.
The high variability associated with the Mediterranean maquis derived from the to the structural and morphological heterogeneity of these systems.
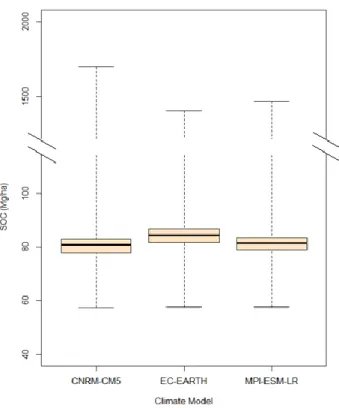
The simulated total SOC stock, considering all GCMs, ranges between 5917 and 6317 Tg. The largest contribution to the total SOC stock was given by coniferous forests (from 1704 to 1955 Tg), followed by broad-leaved (from 1775 to 1783 Tg), and mixed forests (from 971 to 1116 Tg), covering the 22.83%, 29.46%, and 12.83% of the study area, respectively.
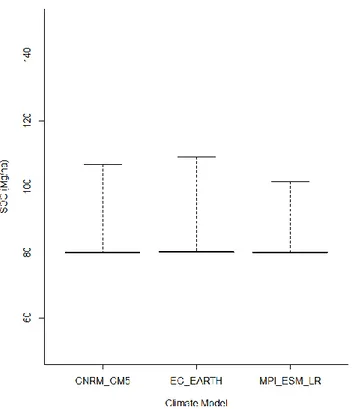
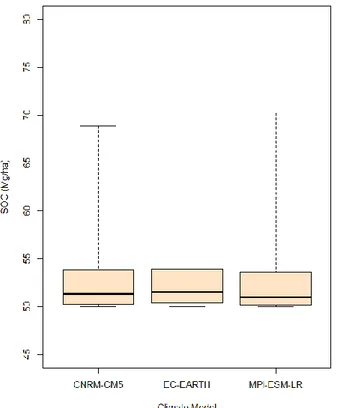
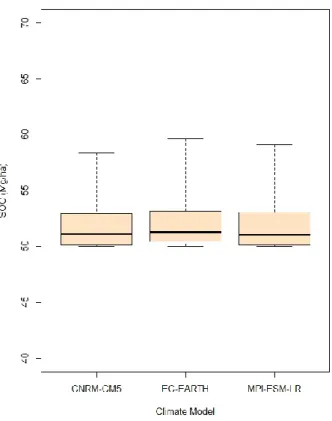
Figures 12a, 12b, 12c, 12d, 12e, 12f, 12g, 12h, 12i, 12l showed the boxplot of actual SOC stock for each land cover class studied in the Euro-Mediterranean area.
Table 9. Actual SOC stock at the year 2005 (0.0-1.0 m depth). Uds CNRM-CM5 EC-EARTH MPI-ESM-LR CNRM-CM5
EC-EARTH MPI-ESM-LR (Mg C ha-1) (Tg C) Vineyard 51.47 (1.51) 51.89 (1.71) 51.52 (1.57) 100 101 100 Orchard 51.98 (1.58) 51.85 (1.62) 51.57 (1.52) 83 83 82 Olive grove 50.14 (1.79) 50.52 (1.68) 50.11 (1.82) 54 54 54 Broad-leaved forest 80.54 (14.77) 80.35 (1.00) 80.24 (0.95) 1782 1778 1775 Coniferous forest 114.07 (207.22) 99.44 (165.06) 113.57 (210.13) 1955 1704 1947 Mixed forest 109.68 (163.50) 100.72 (116.55) 115.75 (192.52) 1057 971 1116 Natural grassland 52.49 (9.21) 53.01 (3.18) 52.24 (2.71) 396 399 394 Moors and heathland 74.00 (119.22) 62.04 (106.26) 78.81 (130.17) 103 86 109 Mediterrane an maquis 86.31 (75.84) 81.70 (78.93) 81.80 (78.12) 290 275 275 Transitional woodland-shrub 50.03 (12.86) 50.18 (0.57) 50.11 (0.52) 464 466 465 Total 6284 5917 6317
Figure 12a. Boxplot of actual SOC stock in vineyards for each GCM (year 2005).
Figure 12c. Boxplot of actual SOC stock in olive groves for each GCM (year 2005).
Figure 12e. Boxplot of actual SOC stock in coniferous forests for each GCM (year 2005).
Figure 12g. Boxplot of actual SOC stock in natural grasslands for each GCM (year 2005).
Figure 12i. Boxplot of actual SOC stock in Mediterranean maquis for each GCM (year 2005).
Figure 12l. Boxplot of actual SOC stock in transitional woodland-shrub for each GCM (year