RESEARCH
Mitochondrial DNA methylation and copy
number predict body composition in a young
female population
Laura Bordoni, Vanessa Smerilli, Cinzia Nasuti and Rosita Gabbianelli
*Abstract
Background: Since both genomic and environmental factors are involved in obesity etiology, several studies about
the influence of adiposity on both nuclear DNA and mitochondrial DNA methylation patterns have been carried out. Nevertheless, few evidences exploring the usage of buccal swab samples to study mitochondrial DNA epigenetics can be found in literature.
Methods: In this study, mitochondrial DNA from buccal swabs collected from a young Caucasian population (n = 69)
have been used to examine potential correlation between mitochondrial DNA copy number and methylation with body composition (BMI, WHtR and bioimpedance measurements).
Results: A negative correlation between mitochondrial DNA copy number and BMI was measured in females
(p = 0.028), but not in males. The mean percentage of D-loop methylation is significantly higher in overweight than in lean female subjects (p = 0.003), and a specific CpG located in the D-loop shows per se an association with impaired body composition (p = 0.004). Body composition impairment is predicted by a combined variable including mtDNA copy number and the D-loop methylation (AUC = 0.785; p = 0.009).
Conclusions: This study corroborates the hypothesis that mitochondrial DNA carries relevant information about
body composition. However, wider investigations able to validate the usage of mtDNA methylation from buccal swabs as a biomarker are warranted.
Keywords: Mitochondrial epigenetics, DNA methylation, Buccal swabs, Body composition
© The Author(s) 2019. This article is distributed under the terms of the Creative Commons Attribution 4.0 International License (http://creat iveco mmons .org/licen ses/by/4.0/), which permits unrestricted use, distribution, and reproduction in any medium, provided you give appropriate credit to the original author(s) and the source, provide a link to the Creative Commons license, and indicate if changes were made. The Creative Commons Public Domain Dedication waiver (http://creativecommons.org/ publicdomain/zero/1.0/) applies to the data made available in this article, unless otherwise stated.
Background
Obesity is a well-known risk factor for numerous chronic pathologies, including cardiovascular diseases [1] and cancer [2]. Overweight and obesity in children and adolescents represent a major burden in the modern global society, as their prevalence in recent decades has increased worldwide [3–6], and it has been demonstrated that early life obesity is a precursor to obesity in adult-hood [7].
Since adiposity and obesity result from the interaction of both genetic background and environmental factors from very early in life, epigenetic processes have been
indexed as potential mediators that may fill the gap in the understanding of etiology of this multifactorial pathology [8, 9]. Despite promising results and increasing efforts in this field, the epigenetic basis of obesity remains largely unknown, in particular in early developmental stages, such as childhood and adolescence [10].
DNA methylation is one of the most-studied herit-able epigenetic marker herit-able to regulate gene expression without changing the primary DNA sequence, and which can be modified by lifestyle and environmental factors [11, 12]. Several studies have described DNA meth-ylation patterns associated with obesity [13, 14]. Most of them investigated the epigenome of genomic DNA from peripheral blood cells [15] or tissues with specific metabolic roles (i.e. subcutaneous fat [16]); some oth-ers changes can be investigated in genomic DNA from
Open Access
*Correspondence: [email protected]
Unit of Molecular Biology, School of Pharmacy, University of Camerino, Via Gentile III da Varano, 62032 Camerino, MC, Italy
buccal swabs [17], as it is a non-invasive, easily accessible sample, whose usage in epidemiological (and epigenetic) studies is spreading [18].
Recently, it has been demonstrated that methylation marks can be detected also in the mitochondrial DNA (mtDNA) [19], but the debate about their existence and biological meaning is still ongoing. Because of its role at the interface between environmental exposure, genomics and biochemistry of energy balance, this novel epigenetic mark has been addressed to be a next generation bio-marker of exposure and disease [20]. Not only mitochon-drial epigenetics [21] but also mtDNA copy number can play a relevant role in numerous health and disease con-ditions [22–27]. Indeed, each mitochondrion contains 2–10 mitochondrial DNA copies [24] and it has been demonstrated, for instance, that high mtDNA copy num-ber in peripheral blood is associated with higher cogni-tion in elderly women [28], while decreased mtDNA content precedes the onset of non-insulin-dependent dia-betes mellitus [29]. Interestingly, numerous studies iden-tified that differences of mtDNA copy number are gender specific in both animal models and humans [30–32].
Despite growing interest on this topic, few data are available about the usage of buccal swabs to study mtDNA methylation and copy number in obesity [33]. Environmental epidemiology and public health research-ers often rely on peripheral biological sources as they do not have access to specific target tissues related to com-plex diseases. Thus, in a context concerning vulnerable individuals such as children, buccal swabs and saliva sam-ples could be useful samsam-ples with reduced discomfort, able to increase participation and improve overall feasi-bility of the investigation [17, 18, 34–36]. In this respect, the aim of this study is to investigate if body composi-tion affects copy number and methylacomposi-tion of mtDNA extracted from buccal swab samples in a cohort of young Caucasian individuals.
Materials and methods
Study design and sampling
This study included 69 children and adolescents (35 males and 34 females) recruited during a sport medi-cine check-up. As described in a previous study [37], all the recruited subjects regularly play sports, from 2 to maximum 4 times a week. The level of physical activ-ity of the studied population is estimated to be moder-ate (3–6 metabolic equivalents of task, METs), according to CDC (Centers for Disease Control and Prevention, USA) guidelines. The sports practiced are heterogeneous but characterized by alternation of aerobic and anaero-bic phases (i.e. basket, volleyball, soccer, water polo, judo, figure skating, tennis, artistic gymnastic). More-over, it must be considered that the participants are
active subjects, but not agonist players. The recruitment occurred on a voluntary basis and parental consent was obtained from all participants. Exclusion criteria were (a) current or previous occurrence of metabolic or digestive disease (except for appendectomy) or kidney disease; (b) being pregnant or breastfeeding. The study protocol has been approved by the general direction of Area Vasta 2, Jesi, Marche (Italy), in accordance with the Declaration of Helsinki in its revised edition and with international and local regulatory requirements. The subset of analyzed buccal swab samples was limited by the amount of DNA requested for the mtDNA isolation procedures explained as follow. As sex-dependent effects on mtDNA have been previously observed [30–32], the investigations were car-ried out in male and female population separately.
Body composition assessment
Data concerning age, height, weight (Wunder A150) and waist circumference (WC) (Hoechst mass roll fix tape) of recruited subjects were collected by trained evaluators according to standard protocols, as explained in the pre-vious paper [37]. Body mass index (BMI) was calculated as weight divided by height squared, while waist to height ratio (WHtR) was determined by dividing the waist cir-cumference for their height, both measured in the same units. Subjects with the BMI percentile > 85th according to sex and age were classified as overweight (as percen-tiles represents the gold standard to define overweight in children), in agreement with the IOTF cut-offs [38]. Bio-electrical impedance analysis (BIA) was carried out using BIA (BIA Akern 101, Akern s.r.l), as previously described [39]. Data about FM percentage (FM%), body cellular mass (BCM), and phase angle (PhA) were collected. BCM was normalized for height by calculating the BCM index (BCMI) [18]. The PhA [40] was derived as the arctan-gent of the reactance-to-resistance ratio that was directly measured through BIA analysis. PhA is one of the most relevant impedance parameter as it correlates with vari-ous indexes of functional and nutritional status [41–43].
DNA isolation and mtDNA copy number assessment
Genomic DNA was extracted from buccal swabs through isopropanol precipitation. MtDNA copy number was assessed by qPCR method (as previously described [44,
45]) using primers specific for mtDNA (mtpair21 fw-AAT CCA AGC CTA CGT TTT CACA; mtpair21 rv-AGT ATG AGG AGC GTT ATG GAGT) and normalizing for the amount of genomic DNA used in each reaction by using primers specific for gDNA (18s fw-GCA ATT ATT CCC CAT GAA CG; 18s-rv GGG ACT TAA TCA ACG CAA GC). qRT reaction was performed using Takara TB Green™ Premix Ex Taq™ II (Takara) by using CFX-96 (Biorad).
Purification of mtDNA and evaluation of D‑loop methylation
MtDNA was isolated from nuclear DNA (ncDNA) according to the technique previously reported by Jayaprakash and colleagues [44] referred as Mseek, which is an innovative and efficient method based on the selec-tive digestion of ncDNA without degrading the circular mtDNA. Briefly, 4 μg of gDNA were digested with the Exonuclease V (M0345S, NEB) at 37 °C for 48 h. After the heat inactivation of the enzyme (70° for 30 min), the DNA was purified by using Agencourt AMPure XP mag-netic beads (Beckman coulter) according to the manufac-turer’s protocol. A second digestion with Exonuclease V was then performed in the same conditions and, after the purification, the isolated mtDNA was tested for ncDNA contamination with the same primers used to quantify the mtDNA, as described in the previous paragraph. MtDNA was considered pure when amplification prod-ucts for ncDNA were obtained at cycles higher than 30 and a delta of at minimum of 8 cycles between nuclear and mitochondrial Ct could be measured.
MtDNA methylation of two areas of the D-loop was assessed by bisulphite pyrosequencing. MtDNA was converted by bisulphite using the EZ DNA methylation gold kit (Zymo research), according to the manufactur-er’s protocol. The following primers were used to amplify the selected regions: MT2 fw–GTG TAT TGT TTT GAG GAG GTA AGT; MT2 rv-biotin-CAC TCC CAT ACT ACT AAT CTC ATC AAT; MT2 seq-TTT TTG GGG TTT GGT; MT20 fw-TGG ATG ATT TTT TTT AGA TAG GGG TTTT; MT20 rv-biotin- CAA TTC ACT TTA ACT ACC CCC AAA TA; MT20 seq-AGG GGT TTT TTG ATT ATT ATT. These two regions were selected since they previously showed highest methylation levels in mtDNA [47].
Statistical analysis
Data were analyzed using SPSS (SPSS Inc., Chicago, IL, USA). Kolmogorov–Smirnov test was used to assess nor-mality of distributions. Pearson correlation was tested to demonstrate significant correlations among normally distributed variables. A logarithmic transformation was used to normalize variables whenever it was possible. Spearman correlation was used with the same aim for not normally distributed parameters. General linear models were used to detect associations among categorical and continuous variables. ROC curves were calculated to test the ability of different variables to predict overweight. The combined predicted probability was calculated according to a binary logistic regression model. Two-tailed p values are reported, and differences were consid-ered significant when p values were < 0.05.
Results
Descriptive statistics
Because of technical problems in mtDNA isolation, 57 samples out of 69 were analyzed.
Kolmogorov–Smirnov test revealed that all the primary variables were normally distributed except for the vari-able describing mtDNA copy number (that was normal-ized by logarithmic transformation) and the combined predicted probability calculated to test the combined effect of mtDNA copy number and mtDNA methylation (CP*MH). Descriptive statistics for the total population stratified by sex are shown in Table 1.
MtDNA copy number is correlated with body composition in females, but not in males
Data analysis of relative amount of mtDNA copy num-ber revealed higher mean values in the female than in the
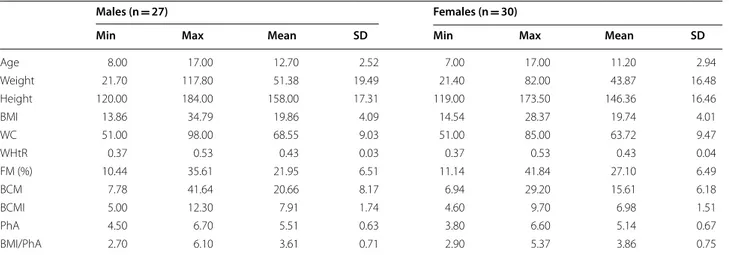
Table 1 Descriptive statistics for the total population divided by gender
BMI body mass index, WC waist circumference, WHtR waist to height ration, FM fat mass, BCM body cellular mass, BCMI BCM index, PhA phase angle
Males (n = 27) Females (n = 30)
Min Max Mean SD Min Max Mean SD
Age 8.00 17.00 12.70 2.52 7.00 17.00 11.20 2.94 Weight 21.70 117.80 51.38 19.49 21.40 82.00 43.87 16.48 Height 120.00 184.00 158.00 17.31 119.00 173.50 146.36 16.46 BMI 13.86 34.79 19.86 4.09 14.54 28.37 19.74 4.01 WC 51.00 98.00 68.55 9.03 51.00 85.00 63.72 9.47 WHtR 0.37 0.53 0.43 0.03 0.37 0.53 0.43 0.04 FM (%) 10.44 35.61 21.95 6.51 11.14 41.84 27.10 6.49 BCM 7.78 41.64 20.66 8.17 6.94 29.20 15.61 6.18 BCMI 5.00 12.30 7.91 1.74 4.60 9.70 6.98 1.51 PhA 4.50 6.70 5.51 0.63 3.80 6.60 5.14 0.67 BMI/PhA 2.70 6.10 3.61 0.71 2.90 5.37 3.86 0.75
male population (F = 6.676; M = 3.175, p = 0.027). Age does not affect mtDNA copy number neither in the male (Pearson correlation = 0.017, p > 0.05) nor in the female population (Pearson correlation = − 0.205; p > 0.05). This is expected as the analyzed population is homogeneous for age.
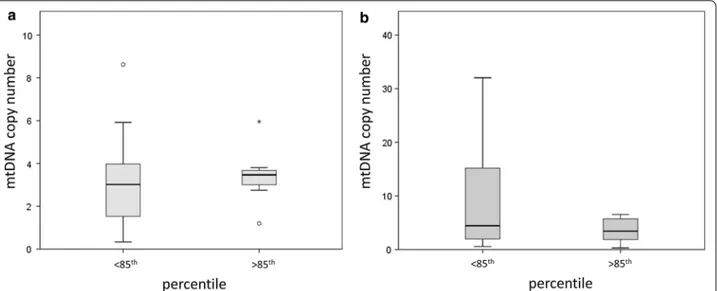
Whether we divide the population for the percentiles (higher/lower than 85th), mtDNA copy number does not differ between normal weight or overweight individuals, neither in males (GLM; p > 0.05) (Fig. 1a) nor in females (GLM; p > 0.05) (Fig. 1b).
None of the continuous variables describing body com-position resulted to be correlated with mtDNA copy number in males (Pearson correlation, p > 0.05). On the other hand, a negative correlation between mtDNA copy number and BMI (Pearson correlation = − 0.402; p = 0.028) was measured in the female population (Fig. 2a).
Analyzing BIVA data about body composition, mtDNA copy number resulted to be negatively associated also to BCM (Pearson correlation = − 0.387; p = 0.035) (Fig. 2b), BCMI (Pearson correlation = -0.498; p = 0.005) (Fig. 2c) and PhA (Pearson correlation = − 0.576; p = 0.001) (Fig. 2d) indexes. However, this association is not signifi-cant if we normalize BIVA parameters for BMI; indeed, no significant association could be detected between mtDNA copy number and BCMI/BMI (Pearson correla-tion = − 0.221; p > 0.05) (Fig. 2e) or PhA/BMI (Pearson correlation = 0.036; p > 0.05) (Fig. 2f). This is in accord-ance with previous literature suggesting that BMI could act as a cofounder for BIVA parameters such as PhA measured in children and adolescents [48].
Higher methylation of a CpG in the D‑loop is associated with impaired body composition in females
Since preliminary data on mtDNA copy number sug-gest a correlation with body composition in females but not in males, pyrosequencing of D-loop was per-formed only in the subgroup of 30 female individuals. 7 CpGs located in two areas of the D-loop (MT2 and MT20) were analyzed singularly and then a mean % value of methylation has been calculated for each of the two areas. Data analysis reveals that age does not affect methylation levels in none of the analyzed CpGs, nei-ther singularly nor as mediated value (Pearson correla-tion, p > 0.05).
By categorizing the population in lean or overweight basing on the percentile (> or < than 85th), it emerged that the mean % of methylation is significantly higher in overweight than in lean subjects (GLM, p = 0.003) (Fig. 3a). One of the CpGs (the 3rd in the MT20 sequence) resulted to be associated with overweight also singularly (GLM, p = 0.004), suggesting that it is the main contributor of this detected association with overweight (Fig. 3b).
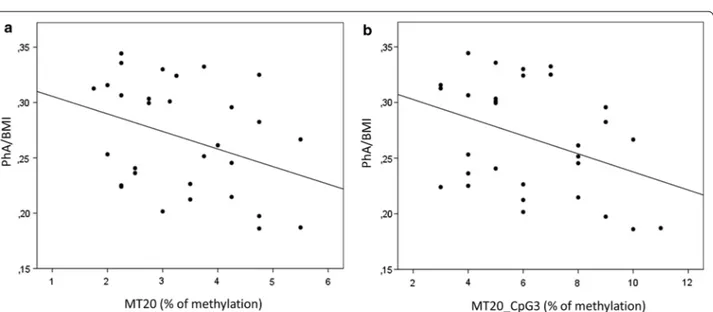
Concerning the continuous parameters describing the body composition, D-loop methylation at CpG3 resulted to be significantly associated to PhA/BMI (Pearson Correlation = − 0.374; p = 0.042) (Fig. 4a). A p for trend was calculated also testing correlation between the mean MT20% of methylation and PhA/ BMI (Pearson Correlation = -0.351; p = 0.058) (Fig. 4b). No significant associations could be measured between D-loop methylation and the other parameters describ-ing body composition.
Fig. 1 MtDNA copy number and body percentile. Box plots represents differences in mtDNA methylation in the male (a) and female (b) population divided for higher/lower than 85th percentile
MtDNA copy number and D‑loop methylation predict overweight in our female population
Testing the ability of mtDNA copy number and MT20_ CpG3 methylation to predict overweight, ROC curve analysis showed that MT20_CpG3 methylation alone significantly predicts the overweight in our population (AUC = 0.785; p = 0.009), while the mtDNA copy num-ber is not able to identify the overweight individuals from the others (AUC = 0.389; p > 0.05). The combined predicted probability (CP*MH) calculated from both the two variables (mtDNA copy number and CpG3
methylation) improved the prediction of the model for the overweight (AUC = 0.894; p = 0.00001), suggesting that the combination of these two variables could be more informative than the single ones (Fig. 5).
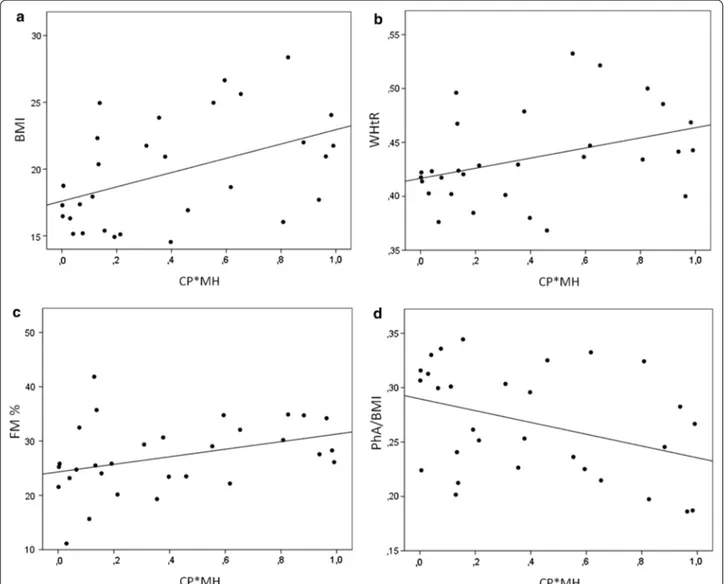
This hypothesis is supported by the evidence show-ing that this combined variable (CP*MH) linearly correlates to BMI (Spearman correlation = 0.438; p = 0.015) (Fig. 6a), WHtR (Spearman correla-tion = 0.435; p = 0.016) (Fig. 6b), FM % (Spear-man correlation = 0.413; p = 0.023) (Fig. 6c), and negatively correlates with PhA/BMI (Spearman correla-tion = − 0.367; p = 0.046) (Fig. 6d). This means that this
Fig. 3 D-loop methylation in lean vs overweight subjects. Mean % values of methylation of the D-loop (a) or the single CpG3 (b) are represented by dividing the population in lean vs overweight subjects
Fig. 4 D-loop methylation and PhA/BMI ratio. Mean % values of methylation of the D-loop (a) or the single CpG3 (b) are plotted against the PhA normalized for BMI (PhA/BMI)
combined variable can better predicts body composi-tion than mtDNA methylacomposi-tion alone, in a young female population.
Discussion and conclusions
The mtDNA plays a major role in numerous diseases, ranging from neurological [49] to cardiovascular [50], and it has been previously studied as a biomarker mostly from the genetic point of view. For example, a buccal swab approach has been used to examine mitochondrial dysfunction in children to screen mitochondrial disease before other clinical presentation onset [51]. The study of DNA copy number and, only recently, the study of methylation patterns displayed high potential as candi-date biomarkers of exposure and disease, particularly in multifactorial pathologies such as obesity. Alteration of mtDNA copy number in obesity has been described in several studies that investigated this parameter in adipose tissue [52] or surrogate markers such as peripheral blood [53]. For instance, the reduction of mtDNA copy number in peripheral blood buffy coat cells has been associated with BMI [54] and insulin resistance [25], particularly in subjects with metabolic syndrome [27]. Moreover, it has been independently associated with visceral fat accumu-lation in healthy young adults [30]. Variation of mtDNA copy number and its dynamics have been detected also before and after bariatric surgery, with a gender-specific trend [32], and a decrease in mtDNA copy number in blood has been associated also to increased mtDNA copy number in subcutaneous adipose tissue and TNF-α
production of people with high BMI [52]. This evidence suggests that different trends of mtDNA copy number variation can be observed in different tissues and that they are linked to inflammatory process, increasing the potential implication of this biomarker. Indeed, it has been demonstrated that peripheral blood mitochondrial DNA copy number could be a novel potential biomarker for diabetic nephropathy in type 2 diabetes patients, as it can predict complications of this degenerative pathology [26]. Nevertheless, the mechanistic link between mtDNA copy number and health is still unclear. As reduced mtDNA copy levels has been generally associated with poor health, it has been speculated that a reduction of this parameter could lead to detrimental effects through an impaired ATP production and mitochondrial gene-expression [55] or an alteration of the oxidative stress-response [56].
Not only blood has been used as a surrogate sample to study mtDNA copy number, but also buccal swabs and saliva [33, 57]. For example, it has been recently proved that child’s buccal cell mitochondrial DNA content alters the association between heart rate variability and recent air pollution exposure at school. Interestingly, particulate matter exposure was associated with lower heart rate var-iability only in subjects with low number of mtDNA cop-ies (while the association was not observed in children with high mtDNA content) [58]. Indeed, screening of mtDNA copies in children buccal swabs and identifying factors (i.e. overweight) that could affect this parameter, could be also useful to categorize subjects more prone to unfavourable responses to environmental effects. Buccal swabs and saliva have been previously used to investigate also the methylome of ncDNA in obesity or overweight. The usage of DNA methylation measured in whole blood cells as a marker for less accessible tissues, that are directly involved in disease, has been already proved [59], and differences in methylation profiles of peripheral blood DNA in obesity have been already demonstrated [60]. Also, epigenetic data on buccal swabs suggests an association between the saliva methylome and BMI in adolescence [61]. Interestingly, it has been demonstrated that, despite epigenetic marks are tissue-specific, DNA methylation in saliva appeared more similar to patterns from some brain regions than methylation in blood [62] and some similarities in methylation profile in blood and buccal cells in non-imprinted loci has been identi-fied [63]. Remarkably, a meta-analysis demonstrated that adiposity might influence DNA methylation, and perturbation of these epigenetic pattern could predict future development of type 2 diabetes; this suggests that alterations in DNA methylation are consequences of adi-posity, rather than causes [13]. In this context, to inves-tigate alterations of the epigenetic profile in overweight
Fig. 5 ROC curve predictions for overweight (percentile > 85th). AUC for the MtDNA copies, MT20_CpG3 methylation % and CP*MH variables are plotted
and obesity could help to elucidate physiopathological molecular mechanisms involved, characterizing different forms of obesity and predicting their complication. Nev-ertheless, evidences on mitochondrial DNA methylation alteration in overweight and obesity, particularly from buccal swab samples, are missing.
Our study shows that mtDNA methylation patterns can be studied in DNA samples from buccal swabs, and that they could be associated to the body composition in overweight children. This evidence has been demon-strated in the female population but not in the male one, supporting the gender-specific features already observed concerning mtDNA [30–32]. Girls having lower mtDNA copies and higher methylation levels at the D-loop in their mtDNA extracted from buccal swabs showed a
worst body composition, not only in terms of BMI, but also analyzing BIVA parameters such as FM % and PhA. We showed that taking into account both mtDNA copy number and the D-loop methylation it is possible to pre-dict the overweight of female subjects in the analyzed population. These data are coherent with previous evi-dence demonstrating that the reduction of mtDNA copy number in blood of obese humans is associated with insulin resistance and may arise from increased D-loop methylation, suggesting an insulin signaling-epigenetic-genetic axis in mitochondrial regulation [25].
Our preliminary results are remarkably because they support the usage of mtDNA methylation also in sur-rogate samples such as mtDNA extracted from buccal swabs, and represent a first evidence that mtDNA from
Fig. 6 Association between CP + MH and changes in body composition. Scatter plot describing the correlation between CP*MH and BMI (a), WHtR (b), FM % (c) or PhA/BMI (d)
buccal swabs is affected by alteration of body compo-sition. Moreover, in this study, body parameters are described not only using indexes such as BMI (which is an informative index at population level but doesn’t describe body composition [64]) but also WHtR (which is used to discriminate total and central fat and cardio-vascular risk factors associated with obesity in children [65]) and BIVA parameters, such as FM % and PhA, that really describe body composition, also in children and adolescents [66–68]. Another strength of this study is that all participants are young individuals, aged from 7 to 17 years old. As epigenetics and mtDNA copy num-ber [53] are affected by aging, a population of subjects homogeneous for age is a good model to study the effect of adiposity/body composition on mtDNA methylation and to reduce other cofounding factors like medication or comorbidities, which are very common in adult obese patients. A limitation of this study is that we did not have information about sexual maturation of the recruited subjects, so we could not correct body composition data for this aspect. A second limitation is that the purity of isolated mtDNA was not absolute and some potential residuals of gDNA could be retained in the samples. However, it have to be considered that (1) NUMTs are rarely generated from the D-loop area [46], which is the area that has been analysed in this study; (2) as this study is not focused on genetic variants but on DNA methyla-tion, eventual NUMTs contaminants would be reflected in marginal error in the percentage of methylation meas-ured; (3) even in this case, the error would be equally dis-tributed through all the samples. For all these reasons, we think that, even if occurring, potential residuals of NUMTs do not invalidate the results of this study.
Concluding, this preliminary evidence should be replicated in independent studies and further investi-gations able to assess the direction of this association and the functional mechanisms are warranted. Never-theless, there is an undeniable need to improve under-standing of molecular determinants of healthy and unhealthy obese. Thus, our study support the hypoth-esis that further studies clarifying the role of mtDNA epigenetics could help to identify a new biomarker (also from buccal swabs) which is a biosensor of expo-sure potentially useful to clarify molecular aspects of obesity complications’ onset and to stratify the risk of metabolic syndrome for obese individuals [69].
Abbreviations
BCM: body cell mass; BCMI: BCM index; BIA: Bioimpedance Analysis; BMI: body mass index; CP: copy number; FFM: free fat mass; FM: fat mass; MH: methyla-tion; mtDNA: mitochondrial DNA; ncDNA: nuclear DNA; PhA: phase angle; WC: waist circumference; WHtR: waist to height ratio.
Acknowledgements
We thank the School of Pharmacy to have cofound the Pyromark (Qiagen), used for the methylation analysis, and Dr. Emilio Amadio for sample recruit-ment at the Unit of “Medicina dello Sport”, Area Vasta 2, Jesi, Marche, Italy.
Authors’ contributions
LB and RG designed the study. LB and VS performed the experiments. LB ana-lysed and interpreted the data and drafted the manuscript. RG and CN revised the manuscript and supervised the entire work. All authors read and approved the final manuscript.
Authors’ information
Laura Bordoni, Post-Doctoral researcher; Vanessa Smerilli, Ph.D. student; Cinzia Nasuti, Associate professor of Pharmacology; Rosita Gabbianelli, Associated Professor of Biochemistry.
Funding
This study was supported by RG’s Institutional research fund-Unicam (FPA000033).
Availability of data and materials
All data generated or analysed during this study are included in this published article and its additional files.
Ethics approval and consent to participate
Parental consent was obtained from all participants. The study protocol has been approved by the general direction of Area Vasta 2, Jesi, Marche (Italy), in accordance with the Declaration of Helsinki (revised edition) and with interna-tional and local regulatory requirements.
Consent for publication
Not applicable.
Competing interests
The authors declare that they have no competing interests. Received: 1 October 2019 Accepted: 19 November 2019
References
1. Wormser D, Kaptoge S, Di Angelantonio E, Wood AM, Pennells L, Thomp-son A, et al. Separate and combined associations of body-mass index and abdominal adiposity with cardiovascular disease: collaborative analysis of 58 prospective studies. Lancet (London, England). 2011;377:1085–95. 2. Renehan AG, Tyson M, Egger M, Heller RF, Zwahlen M. Body-mass
index and incidence of cancer: a systematic review and meta-analysis of prospective observational studies. Lancet (London, England). 2008;371:569–78.
3. Cunningham SA, Kramer MR, Narayan KMV. Incidence of childhood obesity in the United States. N Engl J Med. 2014;370:403–11. 4. Rivera JA, de Cossio TG, Pedraza LS, Aburto TC, Sanchez TG, Martorell R.
Childhood and adolescent overweight and obesity in Latin America: a systematic review. Lancet Diabetes Endocrinol. 2014;2:321–32. 5. Lakshman R, Elks CE, Ong KK. Childhood obesity. Circulation.
2012;126:1770–9.
6. Mazidi M, Banach M, Kengne AP. Prevalence of childhood and adolescent overweight and obesity in Asian countries: a systematic review and meta-analysis. Arch Med Sci. 2018;14:1185–203.
7. Mistry SK, Puthussery S. Risk factors of overweight and obesity in child-hood and adolescence in South Asian countries: a systematic review of the evidence. Public Health. 2015;129:200–9.
8. Rzehak P, Covic M, Saffery R, Reischl E, Wahl S, Grote V, et al. DNA-meth-ylation and body composition in preschool children: epigenome-wide-analysis in the European Childhood Obesity Project (CHOP)-Study. Sci Rep. 2017;7:14349.
9. Bordoni L, Gabbianelli R. Primers on nutrigenetics and nutri(epi) genomics: origins and development of precision nutrition. Biochimie. 2019;160:156–71.
10. He F, Berg A, Imamura Kawasawa Y, Bixler EO, Fernandez-Mendoza J, Whitsel EA, et al. Association between DNA methylation in obesity-related genes and body mass index percentile in adolescents. Sci Rep. 2019;9:2079.
11. Goyal D, Limesand SW, Goyal R. Epigenetic responses and the develop-mental origins of health and disease. J Endocrinol. 2019;242:T105–19. 12. Martin EM, Fry RC. Environmental influences on the epigenome:
exposure-associated DNA methylation in human populations. Annu Rev Public Health. 2018;39:309–33. https ://doi.org/10.1146/annur ev-publh ealth -04061 7-01462 9.
13. Wahl S, Drong A, Lehne B, Loh M, Scott WR, Kunze S, et al. Epigenome-wide association study of body mass index, and the adverse outcomes of adiposity. Nature. 2016;541:81. https ://doi.org/10.1038/natur e2078 4. 14. Crujeiras AB, Diaz-Lagares A. Chapter 16—DNA methylation in obesity
and associated diseases. Boston: Academic Press; 2016. p. 313–29. 15. Sayols-Baixeras S, Subirana I, Fernández-Sanlés A, Sentí M,
Lluís-Ganella C, Marrugat J, et al. DNA methylation and obesity traits: an epigenome-wide association study. The REGICOR study. Epigenetics. 2017;12:909–16.
16. Arner P, Sinha I, Thorell A, Ryden M, Dahlman-Wright K, Dahlman I. The epigenetic signature of subcutaneous fat cells is linked to altered expression of genes implicated in lipid metabolism in obese women. Clin Epigenetics. 2015;7:93.
17. Eipel M, Mayer F, Arent T, Ferreira MRP, Birkhofer C, Gerstenmaier U, et al. Epigenetic age predictions based on buccal swabs are more precise in combination with cell type-specific DNA methylation signa-tures. Aging (Albany NY). 2016;8:1034–48.
18. Nishitani S, Parets SE, Haas BW, Smith AK. DNA methylation analy-sis from saliva samples for epidemiological studies. Epigenetics. 2018;13:352–62.
19. Castegna A, Iacobazzi V, Infantino V. The mitochondrial side of epigenet-ics. Physiol Genomepigenet-ics. 2015;47:299–307.
20. Iacobazzi V, Castegna A, Infantino V, Andria G. Mitochondrial DNA meth-ylation as a next-generation biomarker and diagnostic tool. Mol Genet Metab. 2013;110:25–34.
21. Sharma N, Pasala MS, Prakash A. Mitochondrial DNA: epigenetics and environment. Environ Mol Mutagen. 2019;60(8):668–82.
22. Coppedè F, Stoccoro A. Mitoepigenetics and Neurodegenerative Dis-eases. Front Endocrinol (Lausanne). 2019;10:86.
23. Ashar FN, Zhang Y, Longchamps RJ, Lane J, Moes A, Grove ML, et al. Asso-ciation of mitochondrial DNA copy number with cardiovascular disease. JAMA Cardiol. 2017;2:1247–55.
24. Hosgood HD 3rd, Liu C-S, Rothman N, Weinstein SJ, Bonner MR, Shen M, et al. Mitochondrial DNA copy number and lung cancer risk in a prospec-tive cohort study. Carcinogenesis. 2010;31:847–9.
25. Zheng LD, Linarelli LE, Liu L, Wall SS, Greenawald MH, Seidel RW, et al. Insulin resistance is associated with epigenetic and genetic regulation of mitochondrial DNA in obese humans. Clin Epigenetics. 2015;7:60. 26. Al-Kafaji G, Aljadaan A, Kamal A, Bakhiet M. Peripheral blood
mitochon-drial DNA copy number as a novel potential biomarker for diabetic nephropathy in type 2 diabetes patients. Exp Ther Med. 2018;16:1483–92. 27. Skuratovskaia DA, Sofronova JK, Zatolokin PA, Popadin KY, Vasilenko MA,
Litvinova LS, et al. Additional evidence of the link between mtDNA copy number and the body mass index. Mitochondrial DNA A. 2018;29:1240–4. 28. Lee J-W, Park KD, Im J-A, Kim MY, Lee D-C. Mitochondrial DNA copy
number in peripheral blood is associated with cognitive function in apparently healthy elderly women. Clin Chim Acta. 2010;411:592–6. 29. Lee HK, Song JH, Shin CS, Park DJ, Park KS, Lee KU, et al. Decreased
mito-chondrial DNA content in peripheral blood precedes the development of non-insulin-dependent diabetes mellitus. Diabetes Res Clin Pract. 1998;42:161–7.
30. Lee J-Y, Lee D-C, Im J-A, Lee J-W. Mitochondrial DNA copy number in peripheral blood is independently associated with visceral fat accumula-tion in healthy young adults. Int J Endocrinol. 2014;2014:586017. 31. Kristensen TN, Loeschcke V, Tan Q, Pertoldi C, Mengel-From J. Sex and
age specific reduction in stress resistance and mitochondrial DNA copy number in Drosophila melanogaster. Sci Rep. 2019;9:12305. https ://doi. org/10.1038/s4159 8-019-48752 -7.
32. Skuratovskaia D, Litvinova L, Vulf M, Zatolokin P, Popadin K, Mazunin I. From normal to obesity and back: the associations between mitochon-drial DNA copy number, gender, and body mass index. Cells. 2019;8:430.
33. Shoar Z, Goldenthal MJ, De Luca F, Suarez E. Mitochondrial DNA content and function, childhood obesity, and insulin resistance. Endocr Res. 2016;41:49–56.
34. Langie SAS, Moisse M, Declerck K, Koppen G, Godderis L, Vanden Berghe W, et al. Salivary DNA methylation profiling: aspects to consider for biomarker identification. Basic Clin Pharmacol Toxicol. 2017;121(Suppl):93–101.
35. Thaler R, Karlic H, Rust P, Haslberger AG. Epigenetic regulation of human buccal mucosa mitochondrial superoxide dismutase gene expression by diet. Br J Nutr. 2009;101:743–9.
36. van Dongen J, Ehli EA, Jansen R, van Beijsterveldt CEM, Willemsen G, Hottenga JJ, et al. Genome-wide analysis of DNA methylation in buccal cells: a study of monozygotic twins and mQTLs. Epigenetics Chromatin. 2018;11:54.
37. Bordoni L, Marchegiani F, Piangerelli M, Napolioni V, Gabbianelli R. Obesity-related genetic polymorphisms and adiposity indices in a young Italian population. IUBMB Life. 2017;69:98–105.
38. Cole TJ, Bellizzi MC, Flegal KM, Dietz WH. Establishing a standard defini-tion for child overweight and obesity worldwide: internadefini-tional survey. BMJ. 2000;320:1240–3.
39. Bordoni L, Napolioni V, Marchegiani F, Amadio E, Gabbianelli R. Angiotensin-converting enzyme ins/del polymorphism and body com-position: the intermediary role of hydration status. Lifestyle Genomics. 2017;10(1–2):1–8.
40. Oliveira CMC, Kubrusly M, Mota RS, Silva CAB, Choukroun G, Oliveira VN. The phase angle and mass body cell as markers of nutritional status in hemodialysis patients. J Ren Nutr. 2010;20:314–20.
41. Brantlov S, Jodal L, Andersen RF, Lange A, Rittig S, Ward LC. An evaluation of phase angle, bioelectrical impedance vector analysis and impedance ratio for the assessment of disease status in children with nephrotic syndrome. BMC Nephrol. 2019;20:331.
42. Mattiello R, Amaral MA, Mundstock E, Ziegelmann PK. Reference values for the phase angle of the electrical bioimpedance: Systematic review and meta-analysis involving more than 250,000 subjects. Clin Nutr. 2019.
https ://doi.org/10.1016/j.clnu.2019.07.004.
43. Genton L, Norman K, Spoerri A, Pichard C, Karsegard VL, Herrmann FR, et al. Bioimpedance-derived phase angle and mortality among older people. Rejuvenation Res. 2017;20:118–24.
44. Jayaprakash AD, Benson EK, Gone S, Liang R, Shim J, Lambertini L, et al. Stable heteroplasmy at the single-cell level is facilitated by intercellular exchange of mtDNA. Nucleic Acids Res. 2015;43:2177–87.
45. Rooney JP, Ryde IT, Sanders LH, Howlett EH, Colton MD, Germ KE, et al. PCR based determination of mitochondrial DNA copy number in multi-ple species. Methods Mol Biol. 2015;1241:23–38.
46. Tsuji J, Frith MC, Tomii K, Horton P. Mammalian NUMT insertion is non-random. Nucleic Acids Res. 2012;40:9073–88.
47. Liu B, Du Q, Chen L, Fu G, Li S, Fu L, et al. CpG methylation patterns of human mitochondrial DNA. Sci Rep. 2016;6:23421.
48. Bosy-Westphal A, Danielzik S, Dorhofer R-P, Later W, Wiese S, Muller MJ. Phase angle from bioelectrical impedance analysis: population refer-ence values by age, sex, and body mass index. J Parenter Enteral Nutr. 2006;30:309–16.
49. Russell O, Turnbull D. Mitochondrial DNA disease-molecular insights and potential routes to a cure. Exp Cell Res. 2014;325:38–43.
50. Yue P, Jing S, Liu L, Ma F, Zhang Y, Wang C, et al. Association between mitochondrial DNA copy number and cardiovascular disease: current evidence based on a systematic review and meta-analysis. PLoS ONE. 2018;13:e0206003.
51. Yorns WRJ, Valencia I, Jayaraman A, Sheth S, Legido A, Goldenthal MJ. Buccal swab analysis of mitochondrial enzyme deficiency and DNA defects in a child with suspected myoclonic epilepsy and ragged red fibers (MERRF). J Child Neurol. 2012;27:398–401.
52. Skuratovskaia D, Zatolokin P, Vulf M, Mazunin I, Litvinova L. Interrelation of chemerin and TNF-α with mtDNA copy number in adipose tissues and blood cells in obese patients with and without type 2 diabetes. BMC Med Genomics. 2019;12:40. https ://doi.org/10.1186/s1292 0-019-0485-8. 53. Mengel-From J, Thinggaard M, Dalgård C, Kyvik KO, Christensen K,
Christiansen L. Mitochondrial DNA copy number in peripheral blood cells declines with age and is associated with general health among elderly. Hum Genet. 2014;133:1149–59.
•fast, convenient online submission
•
thorough peer review by experienced researchers in your field
• rapid publication on acceptance
• support for research data, including large and complex data types
•
gold Open Access which fosters wider collaboration and increased citations maximum visibility for your research: over 100M website views per year
•
At BMC, research is always in progress. Learn more biomedcentral.com/submissions
Ready to submit your research? Choose BMC and benefit from:
54. Meng S, Wu S, Liang L, Liang G, Giovannucci E, De Vivo I, et al. Leukocyte mitochondrial DNA copy number, anthropometric indices, and weight change in US women. Oncotarget. 2016;7:60676–86.
55. Short KR, Bigelow ML, Kahl J, Singh R, Coenen-Schimke J, Raghavakaimal S, et al. Decline in skeletal muscle mitochondrial function with aging in humans. Proc Natl Acad Sci USA. 2005;102:5618–23.
56. Liu C-S, Tsai C-S, Kuo C-L, Chen H-W, Lii C-K, Ma Y-S, et al. Oxidative stress-related alteration of the copy number of mitochondrial DNA in human leukocytes. Free Radic Res. 2003;37:1307–17.
57. Shin J, Kim KC, Lee DC, Lee HR, Shim JY. Association between salivary mitochondrial DNA copy number and chronic fatigue according to com-bined symptoms in Korean adults. Korean J Fam Med. 2017;38:206–12. 58. Saenen ND, Provost EB, Cuypers A, Kicinski M, Pieters N, Plusquin M, et al.
Child’s buccal cell mitochondrial DNA content modifies the association between heart rate variability and recent air pollution exposure at school. Environ Int. 2019;123:39–49.
59. Murphy SK, Huang Z, Hoyo C. Differentially methylated regions of imprinted genes in prenatal, perinatal and postnatal human tissues. PLoS ONE. 2012;7:e40924.
60. Fradin D, Boëlle P-Y, Belot M-P, Lachaux F, Tost J, Besse C, et al. Genome-wide methylation analysis identifies specific epigenetic marks in severely obese children. Sci Rep. 2017;7:46311.
61. Rounge TB, Page CM, Lepisto M, Ellonen P, Andreassen BK, Weiderpass E. Genome-wide DNA methylation in saliva and body size of adolescent girls. Epigenomics. 2016;8:1495–505.
62. Smith AK, Kilaru V, Klengel T, Mercer KB, Bradley B, Conneely KN, et al. DNA extracted from saliva for methylation studies of psychiatric traits: evidence tissue specificity and relatedness to brain. Am J Med Genet B Neuropsychiatr Genet. 2015;168B:36–44.
63. Talens RP, Boomsma DI, Tobi EW, Kremer D, Jukema JW, Willemsen G, et al. Variation, patterns, and temporal stability of DNA methylation:
considerations for epigenetic epidemiology. FASEB J Off Publ Fed Am Soc Exp Biol. 2010;24:3135–44.
64. Alves Junior CA, Mocellin MC, Goncalves ECA, Silva DA, Trindade EB. Anthropometric indicators as body fat discriminators in children and ado-lescents: a systematic review and meta-analysis. Adv Nutr. 2017;8:718–27. 65. Fujita Y, Kouda K, Nakamura H, Iki M. Cut-off values of body mass
index, waist circumference, and waist-to-height ratio to identify excess abdominal fat: population-based screening of Japanese school children. J Epidemiol. 2011;21:191–6.
66. de Castro JA, Lima TR, Silva DAS. Body composition estimation in children and adolescents by bioelectrical impedance analysis: a systematic review. J Bodyw Mov Ther. 2018;22:134–46.
67. Silleras B, Marcos S, Alonso-Izquierdo L, Camina-Martín MA, Miguelsanz JM, Río MP. Bioelectrical impedance vector analysis in obese and over-weight children. PLoS ONE. 2019;14:e0211148. https ://doi.org/10.1371/ journ al.pone.02111 48.
68. Meleleo D, Bartolomeo N, Cassano L, Nitti A, Susca G, Mastrototaro G, et al. Evaluation of body composition with bioimpedence A com-parison between athletic and non-athletic children. Eur J Sport Sci. 2017;17:710–9.
69. Zheng LD, Brooke J, Smith C, Almeida FA, Cheng Z. Mitochondrial epi-genetic changes and progression from metabolically healthy obesity to metabolically unhealthy obesity: a cross-sectional study. Lancet Diabetes Endocrinol. 2016;4:S16. https ://doi.org/10.1016/S2213 -8587(16)30371 -0.
Publisher’s Note
Springer Nature remains neutral with regard to jurisdictional claims in pub-lished maps and institutional affiliations.