Journal of Physics: Conference Series
PAPER • OPEN ACCESS
Tunnel fire active protection: improving ventilation system
To cite this article: Laura Cirrincione et al 2019 J. Phys.: Conf. Ser. 1224 012005
36th UIT Heat Transfer Conference
IOP Conf. Series: Journal of Physics: Conf. Series 1224 (2019) 012005
IOP Publishing doi:10.1088/1742-6596/1224/1/012005
Tunnel fire active protection: improving ventilation system
Laura Cirrincione1, Gianluca Scaccianoce1, Michael Scrudato1 Matilde
Pietrafesa2, Gianfranco Rizzo1
1Dipartimento di Energia, ingegneria dell’Informazione e modelli Matematici,
Università degli Studi di Palermo, Italy
2 Dipartimento di Ingegneria Civile, dell’Energia, dell’Ambiente e dei Materiali,
Università Mediterranea di Reggio Calabria, Italy
Laura Cirrincione, email address: [email protected]
Abstract. The main aim of this work is to evaluate how the use of an active protection method, consisting in an improved forced longitudinal ventilation system, can determine a positive impact on heat extraction and people evacuation time in a tunnel fire scenario, by considering a case study which simulations are based on a real gallery.
1. Introduction
Tunnel fire safety has the ultimate goal of reducing the risk of injury and/or mortality for users, also by reducing damage to the tunnel structure and facilitating rescue operations.
With increasing number of fire accidents [1] it is necessary to ancillary improve the current fire protection methods and technologies. Tunnel fires, however, are very complex phenomena because of the interactions among the general causes of fire (combustion, radiation, etc.), the tunnel geometry (tunnel shape, vehicle geometry, arrangement of vehicles, etc.) and the factors that might cause an increase in fire power (presence and kind of ventilation, back layering effect, presence of bituminous conglomerate causing pyrolysis, etc.) [2].
For this reason numerous Computational Fluid Dynamics (CFD) numerical investigations have been carried out in different tunnel scenarios to predict the smoke movement and temperature distribution [3, 4], by considering various aspects such as: different kind of ventilation systems (longitudinal or naturally ventilated tunnels with roof openings) [5, 6, 7, 8, 9], multiple fire sources, the presence of obstacles [10, 11], extinguishing systems [12], passive fire protection layers on the concrete, etc..
The advantage in using CFD is that such complex physical interactions can be modelled at the same time, thus studying their relative influence on fire behavior [13]. Small scale [14, 15] and full-scale [16, 17] experiments were also performed to assess smoke removal efficiency, temperature distribution and compression strength of concrete tunnel lining during a fire.
The main aim of this work is the use of CFD to evaluate how the use of an active protection method, forced longitudinal ventilation, can have an impact on the heat extraction and people evacuation time during a tunnel fire.
In order to analyze the behavior of such improved ventilation system a real gallery (the “Caltanissetta Tunnel” in Italy) was considered as a case study for the simulations.
36th UIT Heat Transfer Conference
IOP Conf. Series: Journal of Physics: Conf. Series 1224 (2019) 012005
IOP Publishing doi:10.1088/1742-6596/1224/1/012005
2. Methodology
In order to analyse the behaviour of the improved ventilation system, different scenarios were implemented, considering a real gallery as a case study for the simulations. In particular, the authors chose to model the active protection system of the tunnel by varying the ventilation capacity of the jet fans in the proximity of the fire occurrences.
The ventilation system chosen for this study consists in the use of piston effect fans, also called accelerators or jet fans, which induce an air flow inside the tunnel along its entire section and length (supporting the air flow already induced by vehicles). By using a forced ventilation of this type, vehicles stacked upstream of the fire are preserved by smoke, that is driven towards the parts of the tunnel from which vehicles have already been removed [18]. In particular reversible axial type stainless steel accelerators operating in pairs (and arranged along the tunnel at a pace of about 100 m) have been considered.
The simulations were carried out through the FDS (Fire Dynamics Simulator), that is indeed a CFD software created by the National Institute of Standards and Technology (NIST) during the investigation of the collapse of the World Trade Center. This program solves the Navier-Stokes equations according to a turbulence LES formulation, using finite volumes, and is particularly effective in predicting the dynamics of fire effluents (heat and smoke) once a suitable fire heat release rate (HRR) curve is prescribed.
2.1. The case study
The gallery considered for the simulations is the “Caltanissetta Tunnel” (in Sicily), part of the extension works of S.S.640 "Porto Empedocle" route, consisting in the adjustment of the existing S.S.640 (extra-urban single carriageway road, double direction) one.
The gallery is double-arched, with one-way traffic; it has a total length of about 8000 m and an average elevation a.s.l. of 519.50 m (with a maximum altitude a.s.l. of 550.81 m). The axes of the two arches are separated from each other by a minimum of 35 m (near the entrances) up to a maximum of 85 m.
The maximum coverage in the shell is 130 m. The road platform has a total width of 11.25 m, organized with 2 lanes (slow and overtaking), 3.75 m wide, flanked by a 0.50 m pier on the left and a 3.25 m pier on the right (emergency lane) along the entire length of the tunnel. Throughout the tunnel, free vertical francs (≥ 5.00 m) are guaranteed on the carriageway [19].
The fire scenario considered in the case study involves a Heavy Goods Vehicle (HGV) and asphalt pyrolysis (to obtain a more realistic burning-fire model).
2.2. Simulation
Given the homogeneous characteristics of the whole road section, to simulate the fire scenario only a 100 meters section of the tunnel was implemented in the CFD software.
Considering that FDS is a computing code, it does not allow to draw curves; for this reason, they have been reproduced using a CAD model, approximating them with rectangles. For the sake of simplicity, the HGV used in the simulation was represented by a parallelepiped, whose characteristic dimensions are 2.5 m x 7 m x 3.5 m.
Concerning the size of the mesh, two types of cells were sat: moderate (of a size of 1 m) and fine (of a size of 0.5 m). By adopting the use of a fine mesh only in the fire proximity, in order to estimate the temperature of the vault more accurately, the calculation domain of 15 m x 100 m x 10 m was divided into 35250 cells distributed as follows:
in the fire zone, with a domain of 15 m 7 m 10 m, 15600 cells of 0.5 m 0.5 m 0.5 m, of which 30 cells in the X (in the transverse direction to the section), 14 cells in the Y (longitudinal direction) and 20 cells in the Z (in height) directions, respectively;
in the adjacent fire zone, for a domain of 15 m 22 m 10 m, 13200 cells of 0.5 m 1.0 m 1.0 m, of which 30 cells in the X (in the transverse direction to the section), 22 cells in the Y (longitudinal direction) and 10 cells in the Z (in height) directions, respectively;
36th UIT Heat Transfer Conference
IOP Conf. Series: Journal of Physics: Conf. Series 1224 (2019) 012005
IOP Publishing doi:10.1088/1742-6596/1224/1/012005
in the two zones, for a domain of 15 m 21/22 m 10 m, 6450 cells of 1 m 1 m 1 m, of which 15 cells in the X (in the transverse direction to the section), 21/22 cells in the Y (longitudinal direction) and 10 cells in the Z (in height) directions, respectively.
Fig. 1 shows the sketch of the tunnel used for simulations.
Figure 1. Sketch of the tunnel implemented into the FDS software (with outline of mesh domains).
Once the mesh size and the calculation domain have been defined, the two extremity portals must be defined in order to provide a continuity solution. To do this, the open mesh boundaries function was used to open the two portals, as if they were ventilation surfaces (i.e. VENTs).
The materials used in the modeling are concrete for the vault and asphalt (or bituminous conglomerate) for the road, which have been inserted in the FDS code by assigning specific heat, conductivity, density and emissivity values.
The duration of the simulations was set to 3000 seconds, given the high computational burden, leading to a calculation time of over 6 hours, using a MacPro 6,1 equipped with a 12-Core Intel Xeon
E5 single processor (2.7 GHz, 30 MB Cache). Regarding the output quantities given by the software,
two boundary quantities were required: temperature and smoke’s height in different positions. In particular it was chosen to report in the present work the values of these parameters evaluated on the vault of the tunnel, in correspondence of the fire. Values of temperature and velocity of gasses have been also evaluated.
To estimate the temperature trend over time, virtual sensors have been used: they were positioned on the vault of the tunnel in correspondence of the fire point, as shown in Fig. 2.
36th UIT Heat Transfer Conference
IOP Conf. Series: Journal of Physics: Conf. Series 1224 (2019) 012005
IOP Publishing doi:10.1088/1742-6596/1224/1/012005
The study of the dynamics of the tunnel fire, here considered, starts from the evaluation of the Heat Release Rate (HRR) from a hypothetical flaming vehicle, which indicates the thermal energy emitted by a fire per unit of time. It can be obtained mathematically, with CFD simulations or by experimental tests in a controlled environment. In this work to simulate the combustion of the material it was used an HRR determined by Carvel et al. [20].
The predetermined HRR was assigned to the fire source by placing proper ventilation surfaces (VENTs) on its surface. The truck was therefore equipped with three VENTs, respectively on the top, right side and left side, to exactly reproduce the thermal release of the same truck that, after 1200 seconds, reaches a peak of about 200 MW (Fig. 3), according to literature data [21]. To do this, it has been hypothesized that all generic VENT cells emit an identical Heat Release Rate per Unit Area – HRRPUA (t) – given by:
𝐻𝑅𝑅𝑃𝑈𝐴 (𝑡) = 𝐻𝑅𝑅(𝑡)
𝐴
where A is the total area of the three VENTs, from which the thermal release comes, which in the case of the truck is equal to 61.6 m2. Such HRRPUA (t) is thus identical for all cells and it is 3295.45
KW/m2.
Thanks to these data it is possible to realize a more realistic scenario, by introducing a model of asphalt pyrolysis and one of forced longitudinal ventilation.
In this regard, as previously mentioned, for the present case study it was chosen to consider a reversible stainless-steel ventilation system, in which the fans operate in pairs and are arranged along the tunnel with a 100 m pace, having a flow rate of 24.0 m³/s. In particular each end side of the tunnel has been equipped with two inlet fans that can be converted into suction fans by simply inverting the flow rate sign. In the FDS software, the fan was represented as a square with a side of 0.75 m.
Regarding the behavior of the bituminous conglomerate (and its ability to increase the load of fire), in order to create a model in FDS, the results of the BRE center for fire safety engineering at the University of Edinburgh were taken into account, concordant with the results of the PAVIREX project [22]. In particular, the following features were implemented in the FDS code:
the asphalt combustion heat is equal to 35166 kJ/kg; the pyrolysis reaction heat is equal to 3000 kJ/kg; the reference temperature is equal to 450°C; a pyrolysis range of 60°C;
a binder content of 6% in bulk.
3. Results
3.1. Base simulation (first scenario)
In order of confirming the value of HRR assumed in our study (that according to the method must be considered as a pre-determined parameter), we have conducted here a basic simulation of the fire phenomenon, in which standard forced longitudinal ventilation has been considered.
The obtained results confirm an HRR slightly exceeding 203 MW (Fig. 3), which ripple is due to the presence of oxygen from forced ventilation.
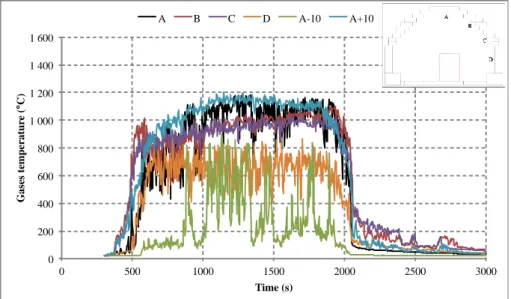
Fig. 4 show the gasses temperatures, where A, B, C and D are the sensors, indicated in Fig. 2, positioned in the fire occurrence point, namely at y = 50 m, while A-10 and A+10 represent the sensors
positioned in A but at a y position of respectively 40 m and 60 m, that is at 10 m from the fire center (y = 50 m).
36th UIT Heat Transfer Conference
IOP Conf. Series: Journal of Physics: Conf. Series 1224 (2019) 012005
IOP Publishing doi:10.1088/1742-6596/1224/1/012005
Figure 3. Heat Release Rate (first scenario).
Figure 4. Gasses temperatures (first scenario).
In order to evaluate the effects of smoke on people, and their ability to react to the fire, the smoke stratification was also analyzed throughout the longitudinal section of the tunnel axis. For this purpose, layer devices have been placed, other than in the point where the fire occurs (HGV), also at 25 m (i.e. y = 25 m and y = 75 m) and at 50 m (y = 0 m and y = 100 m) from the HGV, respectively.
The obtained values (Fig. 5) allow to evaluate the smoke stratification along the longitudinal section of the tunnel.
Although their absolute values are questionable, these results therefore provide a comparison term for the subsequent simulations with improved ventilation.
0 50 100 150 200 250 0 500 1000 1500 2000 2500 3000 H R R ( M W ) Time (s) 0 200 400 600 800 1 000 1 200 1 400 1 600 0 500 1000 1500 2000 2500 3000 G a se s te m p er a tu re ( °C ) Time (s) A B C D A-10 A+10
36th UIT Heat Transfer Conference
IOP Conf. Series: Journal of Physics: Conf. Series 1224 (2019) 012005
IOP Publishing doi:10.1088/1742-6596/1224/1/012005
Figure 5. Smoke stratification (first scenario).
3.2. Simulations of alternative scenarios (second and third scenarios)
As previously reported, the improved ventilation system was modelled by varying the ventilation capacity and characteristics of the jet fans in the proximity of the fire occurrences; the axial fans used in the tunnel, in fact, give the possibility to vary the flow rate and they can also be switched off in conditions of complete evacuation of the tunnel.
This way, despite having the negative effect of providing more oxygen to the combustion reaction, allowing the benefit of removing smoke - which causes suffocation - more quickly, and of having a better visibility for the evacuation of the area. In particular, two different scenarios were used: in the first, an increase of twice the standard airflow was assumed; in the second, the same hypothesis of the base simulation were assumed, but considering all fans working in aspiration.
Since the standard airflow rate is 24.0 m³/s for each fan placed on each portal, in the second
scenario such flow rate was set at a value of 48.0 m³/s. Each simulation lasted almost 7 hours.
The obtained results for the first scenario (Fig. 6) showed a delay of the back-layering effect of about 700 s (almost double respect to that of the base simulation) and a better smoke zoning, albeit slightly, going from a visibility of 1 m to a 2 m one.
The values of gasses’ temperature (Fig. 7) have decreased compared to those of base simulation; anyway, it must be noted that the investigated cases didn’t take into account a fire active protection system for controlling the gasses temperature’s values.
Very variable data were obtained both for the smoke stratification and the gasses temperatures (comparison of Fig. 6 with 5 and Fig. 7 with 4, respectively), probably due to the fan speed acting on the flames. In return though, an increase in the evacuation time and a better smoke stratification have been obtained in the second part of the tunnel, thanks to the contrast between ventilation and back-laying speeds.
Overall, regarding people evacuation time, these results represent a worsening compared to the basic simulation (comparison Fig. 6 with 5); they do not therefore contribute to an increase in tunnel safety from this point of view.
0 1 2 3 4 5 6 7 8 9 0 500 1000 1500 2000 2500 3000 H ei g h t o f sm o k e st ra ti fic a ti o n ( m ) Time (s)
36th UIT Heat Transfer Conference
IOP Conf. Series: Journal of Physics: Conf. Series 1224 (2019) 012005
IOP Publishing doi:10.1088/1742-6596/1224/1/012005
Figure 6. Smoke stratification with improved ventilation – second scenario.
Figure 7. Gasses temperatures with improved ventilation – second scenario
In the third scenario, in an attempt to increase the sliding speed of the smoke, all fans were considered working in aspiration, by inverting the airflow direction of the fan positioned at y = 0.
The results regarding the smoke (Fig. 8) show an obvious increase in their stratification height, which allows a safer evacuation of the tunnel. While, regarding the gasses’ temperatures (Fig. 9) it can be noted an increase of the values in the area near the tunnel ceiling in the point where the fire starts, and a decrease, instead, at lower heights.
Hence, acting on the fans’ airflow rate direction, when a fire begins, actually enables to improve the control of smoke stratification inside a tunnel.
0 1 2 3 4 5 6 7 8 9 0 500 1000 1500 2000 2500 3000 H ei g h t o f sm o k e st ra ti fic a ti o n ( m ) Time (s)
LDy0 LDy25 LDy50 LDy75 LDy100
0 200 400 600 800 1 000 1 200 1 400 1 600 0 500 1000 1500 2000 2500 3000 G a se s te m p er a tu re ( °C ) Time (s) A B C D A-10 A+10
36th UIT Heat Transfer Conference
IOP Conf. Series: Journal of Physics: Conf. Series 1224 (2019) 012005
IOP Publishing doi:10.1088/1742-6596/1224/1/012005
Figure 8. Smoke stratification with improved ventilation – third scenario.
Figure 9. Gasses temperatures with improved ventilation – third scenario.
4. Discussions
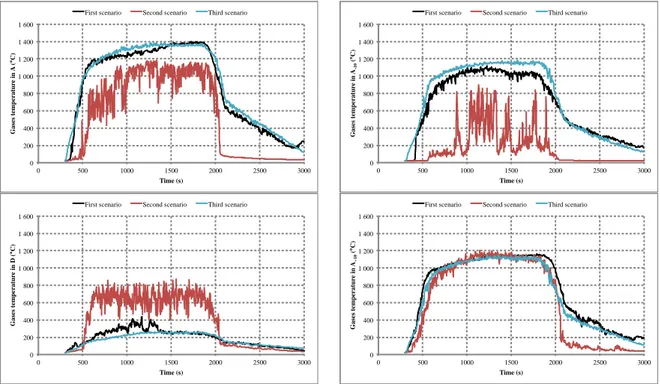
Comparing the results of the first and second scenario, it can be noted how increasing the air flow rate in the second scenario will certainly lower the temperature of the gasses (Fig. 10), especially in the position, A-10, foregoing the point where the fire occurs (considering that the direction of the airflow is
assigned by the fans). Conversely, there is an increase in the smoke temperature at lower altitudes and, above all, the height of smoke stratification in the second scenario often remains below 2 m in positions following the point where the fire occurs (Fig. 11).
Regarding the third scenario, instead, the gasses temperatures are similar to those of the first scenario, but, in some cases, they are even slightly higher. In contrast, however, the height of the smoke stratification is always higher than 4 m.
Consequently, the third scenario would seem to be the most interesting one.
0 1 2 3 4 5 6 7 8 9 0 500 1000 1500 2000 2500 3000 H ei g h t o f sm o k e st ra ti fic a ti o n ( m ) Time (s)
LDy0 LDy25 LDy50 LDy75 LDy100
0 200 400 600 800 1 000 1 200 1 400 1 600 0 500 1000 1500 2000 2500 3000 G a se s te m p er a tu re ( °C ) Time (s) A B C D A-10 A+10
36th UIT Heat Transfer Conference
IOP Conf. Series: Journal of Physics: Conf. Series 1224 (2019) 012005
IOP Publishing doi:10.1088/1742-6596/1224/1/012005
Figure 10. Comparison of gasses temperatures in the sensors A, A+10, A-10 and D for the three
scenarios.
Figure 11. Comparison of smoke stratification in the layer devices positioned at y = 25 m and y = 75
m for the three scenarios.
The previous considerations lead to think that an improvement to the fire safety of tunnels, where there is no an active fire protection system, could be made through a fans direction management, by means of a control system that identifies the position of the fire through some sensors specifically installed along the gallery
Moreover, such a solution, that is a combination of proper sensors and a system for controlling and managing the rotating direction of the fans, should be a fairly simple and a relatively low-cost system to be implemented. 0 200 400 600 800 1 000 1 200 1 400 1 600 0 500 1000 1500 2000 2500 3000 G a se s te m p er a tu re i n A ( °C ) Time (s)
First scenario Second scenario Third scenario
0 200 400 600 800 1 000 1 200 1 400 1 600 0 500 1000 1500 2000 2500 3000 G a se s te m p er a tu re i n A-1 0 ( °C ) Time (s)
First scenario Second scenario Third scenario
0 200 400 600 800 1 000 1 200 1 400 1 600 0 500 1000 1500 2000 2500 3000 G a se s te m p er a tu re i n D ( °C ) Time (s)
First scenario Second scenario Third scenario
0 200 400 600 800 1 000 1 200 1 400 1 600 0 500 1000 1500 2000 2500 3000 G a se s te m p er a tu re i n A + 1 0 ( °C ) Time (s)
First scenario Second scenario Third scenario
0 1 2 3 4 5 6 7 8 9 0 500 1000 1500 2000 2500 3000 H ei g h t o f sm o k e st ra ti fic a ti o n a t L D y 2 5 ( m ) Time (s)
First scenario Second scenario Third scenario
0 1 2 3 4 5 6 7 8 9 0 500 1000 1500 2000 2500 3000 H ei g h t o f sm o k e st ra ti fic a ti o n a t L D y 7 5 ( m ) Time (s)
36th UIT Heat Transfer Conference
IOP Conf. Series: Journal of Physics: Conf. Series 1224 (2019) 012005
IOP Publishing doi:10.1088/1742-6596/1224/1/012005
5. Conclusions
The present work started from considerations regarding the use of CFD to evaluate how the use of an active protection method, that is forced longitudinal ventilation, can have an impact on the heat extraction and people evacuation time during a tunnel fire.
The obtained results confirmed that CFD simulation do provide a powerful analysis tool for tunnel fires protection analysis; geometry, materials and ventilation can, in fact, be represented by taking advantage of a three-dimensional prediction. Thus, when applied to the design of a new and/or improved ventilation system, the CFD simulation provides a local understanding of the general behavior of fire (in terms of heat release rate), smokes stratification and people evacuation time from which an optimal configuration of the system can be developed.
In fact, the analysis of the effects of such active protection system in the tunnel, object of this case study, provided useful data to be taken into consideration in an eventual design phase.
It would be interesting, as further future development of this work, to elaborate the study by implementing a model for the entire tunnel which could also take into account, in addition to the longitudinal ventilation, the use of a behavioral evacuation model, a fire extinguishing system and a material behavior analysis, in order to have a complete representation of the interaction phenomena.
In conclusion, it has been shown that CFD simulations give an enough realistic indication about the physical fire’s phenomenon and protection methods, and therefore provide a good starting point for a suitable design, recovery and restoration of artifacts.
References
[1] Beard A and Carvel R, The handbook of tunnel fire safety, 2005, London E14 4JD, 1 Heron Quay: Thomas Telford Publishing, Thomas Telford Ltd, pp. 127-177.
[2] Ingason H, Li Y Z, Lönnermark A, Runehamar Tunnel Fire Tests, January 2015, Fire Safety
Journal, vol. 71, pp. 134-149.
[3] Ji J, Guo F, Gao Z, Zhu J, Sun J, Numerical investigation on the effect of ambient pressure on smoke movement and temperature distribution in tunnel fires, 2017, Applied Thermal
Engineering, vol. 118, p. 663–669.
[4] Wang F, Wang M, Carvel R, Wang Y, Numerical study on fire smoke movement and control in curved road tunnels, 2017, Tunnelling and Underground Space Technology, vol. 67, p. 1–7. [5] Harish R, Venkatasubbaiah K, Effects of buoyancy induced roof ventilation systems for smoke
removal in tunnel fires, 2014, Tunnelling and Underground Space Technology, vol. 42, p. 195–205.
[6] Li Q, Fang Z, Yuan J, Tang Z, Numerical Simulation on Impacts of Longitudinal Ventilation on Tunnel Fire Detection, 2016, Procedia Engineering, vol. 135, p. 275 – 280.
[7] Wang Q, Tang F, Li L, Zhang X, Fan C, Large eddy simulation on the effect of smoke exhaust openings arrangement on the smoke spread in tunnel fires, 2016, Procedia Engineering, vol.
135, p. 309 – 315.
[8] Barbato L, Cascetta F, Musto M, Rotondo G, Fire safety investigation for road tunnel ventilation systems – An overview, 2014, Tunnelling and Underground Space Technology, vol. 43, p. 253–265.
[9] Gannouni S, Maad R B, Numerical analysis of smoke dispersion against the wind in a tunnel fire, 2016, Journal of Wind Engineering and Industrial Aerodynamics, vol. 158, p. 61–68. [10] Heidarinejad G, Mapar M, Pasdarshahri H, A comprehensive study of two fire sources in a road
tunnel: Considering different arrangement of obstacles, 2016, Tunnelling and Underground
Space Technology, vol. 59, p. 91–99.
[11] Danišovič P, Jančaříková E, Šrámek J, Zuziak M, Fire spread models and Tunnel Traffic & Operation Simulator, 2017, Procedia Engineering, vol. 192, p. 92 – 95.
[12] Liang Q, Li Y, Li J, Xu H, Li K, Numerical studies on the smoke control by water mist screens with transverse ventilation in tunnel fires, 2017, Tunnelling and Underground Space
36th UIT Heat Transfer Conference
IOP Conf. Series: Journal of Physics: Conf. Series 1224 (2019) 012005
IOP Publishing doi:10.1088/1742-6596/1224/1/012005
[13] Vermesi I, Rein G, Colella F, Valkvist M, Jomaas G, Reducing the computational requirements for simulating tunnel fires by combining multiscale modelling and multiple processor calculation, 2017, Tunnelling and Underground Space Technology, vol. 64, p. 146–153. [14] Du S, Zhang Y, Sun Q, Gong W, Geng J, Zhang K, Experimental study on color change and
compression strength of concrete tunnel lining in a fire, 2018, Tunnelling and Underground
Space Technology, vol. 71, p. 106–114.
[15] Tang F, Mei F Z, Wang Q, He Z, Fan C G, Tao C F, Maximum temperature beneath the ceiling in tunnel fires with combination of ceiling mechanical smoke extraction and longitudinal ventilation, 2017, Tunnelling and Underground Space Technology, vol. 68, p. 231–237. [16] Wang F, Wang M, Huo J, The effects of the passive fire protection layer on the behavior of
concrete tunnel linings: A field fire testing study, 2017, Tunnelling and Underground Space
Technology, vol. 69, p. 162–170.
[17] Król M, Król A, Koper P, Wrona P, Full scale measurements of the operation of fire ventilation in a road tunnel, 2017, Tunnelling and Underground Space Technology, vol. 70, p. 204–213. [18] Art Bendelius, Tunnel ventilation — state of the art, Parsons Brinckerhoff, USA, p. 128-140
(https://doi.org/10.1680/hotfs.31685.0007)
[19] Empedocle2 S.C.p.A., Galleria Caltanissetta SS n.640 di “Porto Empedocle”, ANALISI DI RISCHIO.
[20] Carvel R, Beard A, Jowitt P W, How much do Tunnel Enhance the Heat Release Rate of Fires, 2001, Proc. 4th Int. Conf on Safety in Road and Rail Tunnels, Madrid.
[21] Ingarson H, Lonnemark A, Large Scale Fires tests in the Runehamar tunnel – Heat Release Rate, November 2003,nProceedings of the international seminar on catastrophic tunnel fires, Sweden.
[22] Pérez I et al., Asphalt mixture fire performance at full scale. PAVIREX project, June 2016, 6th Eurasphalt & Eurobitume Congress, Prague, Czech Republic.