European
Historical
Economics
Society
EHES
W
ORKING
P
APERS IN
E
CONOMIC
H
ISTORY
|
N
O
.
123
Still a long way to go: decomposing income inequality across
Italy’s regions, 1871 – 2011
Gabriele Cappelli
1Emanuele Felice
2Julio Martínez-Galarraga
3Daniel Tirado
41
Universitat Autònoma de Barcelona
2
Università “G. D’Annunzio” di Chieti-Pescara
3
Universitat de València
4Universitat de València
EHES Working Paper | No. 123|January 2018
Still a long way to go: decomposing income inequality across Italy’s
regions, 1871 – 2011
*Gabriele Cappelli
1, Emanuele Felice
2, Julio Martínez-Galarraga
3,
Daniel Tirado
41
Universitat Autònoma de Barcelona
2Università “G. D’Annunzio” di Chieti-Pescara
3
Universitat de València
4Universitat de València
Abstract
This article is the first study to explore to what extent labour productivity, structural change, participation rates and the age structure of the population contributed to the pattern of Italy’s regional economic inequality over the long run (1871-2011). We provide brand new regional estimates of participation rates and age structures, as well as the most updated figures on per capita GDP, per worker GDP and the employment rate (at ten-year intervals spanning from 1871 to 2011). First, regional inequality in per capita GDP (Y/N) is split into labour productivity (Y/L) and labour-market features (L/N). Then, the Caselli-Tenreyro decomposition is used to explore whether labour-productivity convergence (or divergence) at the NUTS-1 level was determined within or between sectors, and by labour reallocation. While labour productivity was central to the pattern of Italy’s regional development until the 1970s, since then the key factor of North-South divergence has been the participation rate. The results confirm the central role of national and local policies, influencing per capita GDP via productivity, employment, and participation rates.
JEL classification: R1, O11, O25, N9
Keywords: Regional disparities, Italy, convergence, divergence, Caselli-Tenreyro, economic history, productivity.
* Acknowledgements: Gabriele Cappelli and Emanuele Felice gratefully acknowledge financial support from the Spanish Ministry of Economy, Industry and Competitiveness, project HAR2016-76814-C2-1-P (AEI/ FEDER UE).
1Departament d'Economia i d'Història Econòmica, Universitat Autònoma de Barcelona, Edifici B, 08193 Bellaterra, Spain ([email protected]).
2Department of Philosophical, Pedagogical and Economic-Quantitative Sciences, Università “G. D’Annunzio” di Chieti-Pescara, Viale Pindaro, 42, 65127, Pescara, Italy ([email protected]).
3Departament d’Anàlisi Econòmica, Universitat de València, Avda. Dels Tarongers, s/n, 46022, València, Spain ([email protected]).
4Departament d’Anàlisi Econòmica, Universitat de València, Avda. Dels Tarongers, s/n, 46022, València, Spain ([email protected]).
Notice
The material presented in the EHES Working Paper Series is property of the author(s) and should be quoted as such. The views expressed in this Paper are those of the author(s) and do not necessarily represent the views of the EHES or
2
1. Introduction
The long-term growth of regional specialization and the rise of agglomeration economies is common to most European countries (Díez Minguela et al. 2017); yet, in the present day, the extent of Italy’s regional inequality remains unparalleled in western Europe. Southern Italy is the largest underdeveloped area within this region. The so-called Mezzogiorno is twice the size of Portugal or Greece. Currently, the whole area is eligible for the 2014-2020 European Regional funds, given that most of its regions rank below 75% of Europe’s average GDP per capita, while others (Abruzzi, Molise and Sardinia) rank between 75 and 90% (in both cases, at purchasing power parity). Conversely, the whole Centre-North belongs to the club of the most developed European regions.5 No other western European country is characterized by such an extreme regional polarization of income – not even Germany, which was for a long time two separate countries, as well as two distinct economic systems.
Although the North-South divide in terms of income has increased remarkably since the unification of the country in 1861, Italy’s regional pattern of economic development is a history of persistence. Recent estimates of GDP per capita show that the income gap between the South and the North of the country was modest – albeit clear – in 1871 (Felice 2013); yet, other measures of human and economic development suggest that the potential for future economic growth already differed greatly across regions around that time. Literacy rates varied enormously within Italy, probably more than in any other western-European country (Cappelli 2016).6 Regional disparities in schooling and education were coupled by those in innovation capabilities, with the North of the country experiencing a clear-cut advantage in terms of patents granted per million inhabitants (Nuvolari and Vasta 2017). Northerners were also taller than their counterparts from the South, on average, a pattern that suggests higher economic wellbeing north of Rome (A’Hearn and Vecchi 2011). Finally, the length of railroads per squared kilometre that the North exhibited was unmatched in the South (Fenoaltea 2011), and the density of roads was also higher in the former; financial infrastructures were also far more developed in the Centre-North (Zamagni 1993, Felice 2013). – an advantage in infrastructures that, among the others, favoured the rise of manufacturing in the Northwest on the eve of the 20th century, while the South was left behind (Ciccarelli and Fenoaltea 2013).
5 See European Commission, http://ec.europa.eu/regional_policy/en (last access on September 2017). For more
indicators and data, see Eurostat (2014) and Annoni, Dijkstra and Gargano (2017).
6 Adult literacy (people 15 years old or older) ranged between 67% in the province of Turin (Piedmont) and 11%
3
Such a large divide in the preconditions for economic growth (Allen 2011) had an impact on the pattern of regional inequality over the long run. More specifically, human capital and formal institutions – as well as informal norms and social capital – were important determinants of income per capita (Felice 2012; Ciccarelli and Fachin 2016). Nonetheless, many issues about Italy’s North-South divide remain unclear, or under researched – especially as a thorough analysis of the main components of per-capita GDP at the regional level is still lacking. In this article, we use a novel dataset on regional per-capita GDP, employment and labour productivity (Felice 2009, 2011, 2015b) to re-assess some of the aspects of Italy’s regional divide in the long run, which have never been explored so far – despite the huge literature produced about the Questione meridionale (the problem of the South). Furthermore, to this dataset, we add brand-new long-term regional estimates of the participation rate and the age structure of the population (see Tables A.1 and A.2 in the Appendix) which allow us to shed light on a key feature of the pattern of regional inequality in Italy: the predominant role of the labour market and the norms regulating it in the last 40 years. While these new indicators are constructed at the NUTS-2 level, our analysis is mostly conducted for large macroeconomic regions (NUTS-1): on the one hand, this is a necessary step to conduct a thorough investigation on the determinants of regional divergence and convergence in productivity in the long run, particularly (as we will see) for what concerns the use of the Caselli-Tenreyro decomposition; on the other hand, this approach makes it easier to understand the basic features of Italy’s regional development, since over time there has been a polarisation of income in distinct macro-areas of the country.7
First, we analyse the development of Italy’s regional inequality by decomposing the regional dispersion in per capita GDP into labour productivity and labour-market features, for NUTS-1 regions. We find that productivity and labour-market features follow approximately the same trend from Unification until the 1920s: both contributed to the increase of regional dispersion in per-capita GDP, observed from the late nineteenth century. However, we find that labour productivity was responsible for the regional divergence in the 1930s and 1940s, as well as for the steep decline in regional economic disparities during Italy’s Golden Age, from 1951 to 1971. Given its importance for a better understanding of the evolution of Italy’s regional disparities in the long run, we focus on the determinants of labour-productivity convergence – and divergence – by using the Caselli-Tenreyro decomposition (Caselli and Tenreyro 2005).
7 Whenever possible, we have calculated figures at the NUTS-2 level: they are presented in the Statistical
4
This methodology, which we discuss more in detail below, allows the researcher to explore whether convergence or divergence in labour productivity occurred within the same sector and across regions, across sectors or simply because of labour reallocation to more productive sectors.
Once we get the numbers, we connect them to the economic theory and the history of the country’s regional development in four different sub-periods, to identify the determinants of the pattern observed: Italy’s Liberal Age (1871-1911), the early-20th century including the Interwar period (1911-1951), the Golden Age (1951-1971) and the period leading to the second globalization (1971-2011). While exploring convergence and divergence in labour productivity is important to shed light on the long-term evolution of Italy’s regional economic inequalities, demographic factors are equally important to understand their persistence to the present day. Indeed, convergence in per capita GDP has not taken place since the 1970s, despite steady productivity convergence during the last 40 years. Therefore, the participation rate is found to be crucial to understand why regional convergence has come to a halt in the last few decades.
The paper is organized as follows: first we present the long-term pattern of Italy’s regional economic disparities at NUTS-1 level, disentangling the contributions of labour productivity and demographic features; secondly, we focus on convergence in labour productivity across Italy’s regions and present the Caselli-Tenreyro decomposition, which will be used to explore its determinants. Thirdly, we present the results from the decomposition of GDP convergence (or divergence). The last section draws the conclusions, tackling the problem of the persistence of Italy’s regional divide by discussing the role played by labour-market features.
2. Demography and labour market: divergence in the end
To conduct the analysis, we first decompose per capita GDP (Y/N) into labour productivity (output per worker, Y/L) and labour-market features (employment-to-population ratio, L/N), according to the following expression:
𝑌𝑖𝑡 𝑁𝑖𝑡= 𝑌𝑖𝑡 𝐿𝑖𝑡× 𝐿𝑖𝑡 𝑁𝑖𝑡 (1)
where 𝑌𝑖𝑡 is the GDP in region i in year t, 𝑁𝑖𝑡 is the total population in region i in year t and 𝐿𝑖𝑡 is total active population in region i in year t. Figure 1 shows the long-term evolution of an index of σ-convergence: the coefficient of variation of regional (NUTS-1) GDP per capita,
5
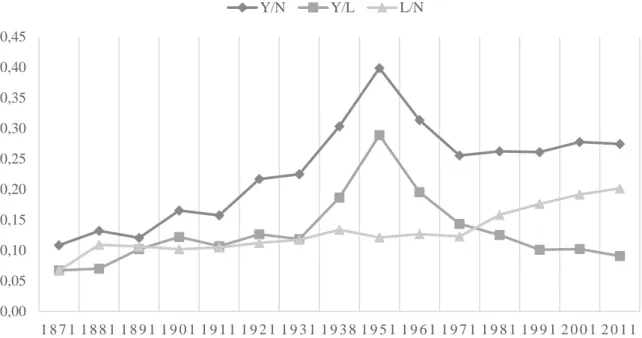
GDP per worker and the economic activity rate.8 From Unification until the 1920s, labour productivity and the employment-to-population ratio followed approximately the same trend, while, at the same time, differences in per capita GDP increased slowly. Then, in the 1930s and 1940s, a remarkable increase of dispersion took place in per capita GDP, and this was driven by differences in productivity; in a specular way, productivity also drove the decrease of dispersion in per capita GDP observed in the 1950s and 1960s: not least because of its prominent role of labour productivity in explaining divergence and then convergence in per capita GDP, most of the paper focuses on further decomposing – and explaining – regional differences in this variable. However, beginning in 1971, steady regional divergence in the employment-to-population ratio caused a divergence in per capita GDP, despite convergence in labour productivity: a long-term analysis of the factors responsible for regional disparities in the employment-to-population ratio can be, therefore, equally useful. The next section focuses on this aspect.
[Figure 1 here]
The understanding of the way that demographic trends influenced Italy’s regional disparities can be improved by decomposing the employment-to-population ratio, L/N, into the participation rate (employment to working-age population, L/WAP: see Table A.1 in the Appendix) and the age structure (working-age population to total population, WAP/N: see Table A.2 in the Appendix). Such indices had to be compiled ex novo from primary sources. Figures on total employment are obtained from Felice (2017), and they refer to today’s borders at census years (1871-2011). Figures on total population (residents where available) are obtained from SVIMEZ (2011): they also refer to today’s borders at census years (1871-2011). The working-age population (WAP) needed to be estimated from Somogyi (1965), in the Annali di statistica, serie 8, volume 17 (1965): these figures refer to population recorded at the time of the census, not residents, at historical borders from 1861 to 1961. Data for the 1961-1981 period were reconstructed through the Sommario di statistiche storiche della popolazione dal 1951 al 1987 (1990). Finally, data from the 1991, 2001 and 2011 were collected from recent censuses.9
8 Results are essentially the same if we use, instead, the standard deviation of the logarithms. If anything, at
NUTS2 (Figure A.1), a more prominent role of labour productivity appears in the period 1871-1931.
9 All the data were compiled (and are presented in the Appendix) at the NUTS-2 level, although, for the reasons
mentioned in the Introduction, here the analysis is performed at the NUTS-1 level. For Figures 1, 2, 6 and 7 at the NUTS-2 level, see the Statistical Appendix (Figures A.1–A.4). Since WAP figures were at the historical borders, as were the estimates in Figure 1, our estimates consider the same territorial units. Among the others, this means
6
This first decomposition (Figure 2) shows that, although the national participation rate fluctuated considerably over the long run, the trend in employment-to-population regional disparities remained stable until 1971. During the last 40 years, however, the regional dispersion in the participation rate increased remarkably.
[Figure 2 here]
Two main forces shaped the age structure of Italy’s regions before the Second World War: migration rates (outflows tend to lower WAP/N) and fertility rates (decreasing fertility rates are linked to a decline in WAP/N). To be sure, internal migration remained very limited until the second decade of the 20th century (Bonifazi and Heins 2011); yet, outward migration characterized the country’s history before World War I. Figure 3 shows emigration rates calculated from ISTAT data as 5-year moving averages (Gomellini and O’Grada 2013). Up to 1900, migration towards foreign destinations was stronger in the North of Italy than in the South, because of more limited budget constraints, as well as the growing wage gap with economies characterized by abundant land and resources compared to their labour supply (Gomellini and O’Grada 2013, see also Williamson 1996). Beginning in 1891 though, migration towards foreign destinations on the other side of the Atlantic soared in the South, so that regional differences in migration rates declined slightly between 1901 and 1921 and remained limited throughout the 1920s. Although the Northwest of the country had come to experience their first wave of industrial growth (Felice 2007, 2011, 2015a), migration was still somewhat sustained and linked to attractive wages and a higher skill premium abroad.
[Figure 3 here]
Despite convergence in outward migration rates, the regional dispersion in the age structure of the population kept growing throughout the first half of the 20th century, until the 1950s. This was due to growing differences in fertility rates: according to estimates provided by Livi Bacci (2015), regional fertility rates had not been characterized by large differences up to 1891; however, from the last decade of the 19th century – and even more from 1901 onwards – the age structure of northwestern regions changed more quickly than elsewhere, as fertility rates rapidly decreased; this regional divergence in fertility rates would end only after World War
that, to keep the results consistent over the long run, L and N figures for the regions of Valle d’Aosta, Trentino Alto Adige and Friuli Venezia Giulia have been excluded from the calculations reported in Figure 2, and from those in table A.1 and A.2 (these areas were not part of the kingdom – or not independent administrative units – at the time of unification). The results are virtually the same if these regions are included, but they bring about “noise” in the long-term trends.
7
II. Therefore, as far as the period 1901-1951 is concerned, this factor alone accounts for the lion’s share of the observed regional divergence in the employment-to-population ratio (see Figure 4).
[Figure 4 here]
After the Second World War, and for the first time since the end of the 19th century, fertility rates across Italian regions started to converge quickly (Vitali and Billari 2017) and did so until the early 1990s.10 This pattern is responsible for the long-term convergence in the age structure observed between 1951 and 2001. Outward migration grew again everywhere after World War II, but it did so more quickly in the South than in other areas: this is behind the short period of regional divergence observed between 1951 and 1961, which in turn was reinforced by rates of internal migration (from South to North) previously un-experienced, lasting up to 1971 (see Figure 5). During the 1970s and up to 2001, decreasing dispersion concerning internal and outward migration reinforced the decline in age-structure regional inequalities brought about by declining regional disparities in fertility rates. Since the 1990s, both rising internal migration and differences in fertility rates (mainly due to inward migration) have brought back divergence in working-age population across Italian regions.
[Figure 5 here]
Although regional disparities in the age structure of the population have declined remarkably since Wold War II, participation rates have diverged considerably across Italian regions since 1971 – while the trend in participation-rate dispersion had been roughly flat from 1871 to 1961. Growing dispersion since the 1970s was mainly due to increasing regional differences concerning labour-market characteristics: male participation rates in the South, which were already very low by international and national standards, declined quickly between 1971 and 2011, while they grew in the Centre and in the North. At the same time, the sluggish growth of female participation rates (from very low levels) in Southern regions brought about further divergence with the North, since in this latter female employment grew more rapidly. It is also worth noting that by-law nominal wage differentials across Italian regions – the so-called gabbie salariali, created in 1945 to cap the nominal price of labour there where the cost of living was lower – were abolished between 1969 and 1972: since then, the nominal cost of labour has been allowed to be the same throughout the country, so that firms started to face
10 To reconcile these figures with those by Live Bacci in only one graph is a difficult task, because in the case of
8
higher real costs in the Mezzogiorno; when coupled with the fact that, in this area, some other costs remained higher than elsewhere (because of longer distances and worse infrastructures, more bureaucracy, lower human and social capital, organized crime, etc.), this may explain why we observe less employment in the South and islands during the last forty years, although the productivity of those employed is not so far from that of workers in the Centre-North, as the remainder of the paper will show.
3. Productivity: a tale of long-term convergence
The analysis of the sources of labour productivity differences is very useful in studying regional inequality – and this is true for Italy too, as shown in the previous section. To approach the overall causes of labour productivity differences across Italian NUTS-1 regions, we compute the Theil T index (Theil 1967) for all fifteen benchmarks considered in this study.11 This index allows us to measure regional inequality in labour productivity using GDP at the industry level and employment figures according to the following equation:
T = ∑ ∑ (Yji Y) log ( Yji Y ⁄ Eji E ⁄ ) = ∑ ∑ (log(xji) − log(x̅)) Yji Y n i=1 3 j=1 , n i=1 3 j=1 (2) 𝑥 ̅ = 𝑌 𝐸
where Y is per capita GDP, E is employment, j indexes industries and i regions. This Theil
index is disaggregated into two components: the within-sector inequality component (TW) and
the between-sector inequality component (TB). Specifically, equation (2) is disaggregated into:
(3)T = TW+ TB= ∑ ( Yj Y) Tj+ 3 j−1 ∑ (Yj Y) log ( Yj Y ⁄ Ej E ⁄ ) , 3 j−1 where (3a)TW = ∑ ( Yj Y) 3 j−1 ∑(log(xji) − log (x̅j) Yji Y n i=1 for j = 1,2 and 3,
11 More specifically, we follow the approach of Akita and Kataoka (2003).
9 and (3b)TB= ∑ (Yj Y) 3 j−1 log ( Yj Y ⁄ Ej E ⁄ ) = ∑ (log(x̅j) − log(x̅)) Yj Y 3 i−1
where TW is the weighted average of regional inequalities in labour productivity within each sector, while TB is the inequality in labour productivity between sectors (agriculture, industry and services). These different Theil T indices are showed in Figures 6 and 7.
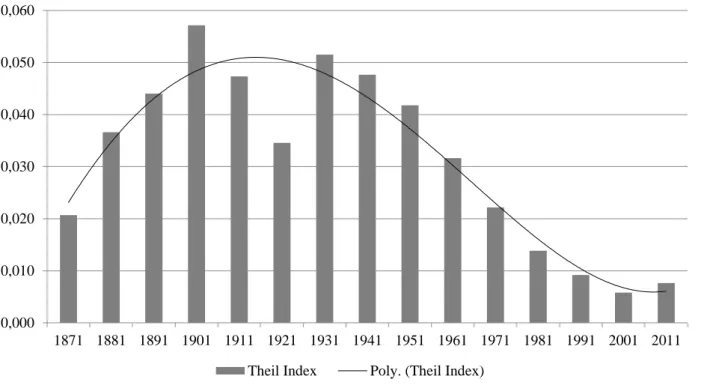
In more detail, Figure 6 captures regional inequalities in labour productivity via the Theil index for Italian NUTS-1 regions at ten-year intervals between 1871 and 2011. The graph shows an initial period of divergence (1871-1901), followed by a decline in 1901-1921, a steady rise to 1931, and then a long period of convergence between 1931 and the present day.12
[Figure 6 here]
As mentioned, we then decompose the Theil index further, into a within and a between-sector component, to improve our quantitative analysis of the proximate sources of the regional productivity divide by linking the observed regional patterns to different economic-growth and trade theories. The within component is the weighted average of regional inequalities in labour productivity within each sector, while the latter is the inequality in labour productivity between sectors: agriculture, industry and services (Rosés, Martinez-Galarraga and Tirado 2010; Martinez-Galarraga, Rosés, and Tirado 2015). Figure 7 presents such decomposition for the period studied, as it shows the role played by each component as a source of the overall regional gap in labour productivity.
Sectoral differences (between component) were blunt at the beginning of the period studied, but regional productivity inequalities within the same sectors (within component) were large. Between 1871 and 1901, productivity differences within sectors declined considerably, but inequalities across sectors grew remarkably, as the regions of the Northwest experienced structural change faster than others. The relative share of said components did not change to a large extent between 1921 and the present day. If anything, the long-term decline in the importance of the within-sector component was reversed in 1931, resumed in 1951 and came to a halt again in 1971; since then, its share has been growing again, albeit marginally.
[Figure 7 here]
10
To explore more formally the contribution of each component to overall regional convergence in productivity, as well as to further disentangle its sources, as a further step we rely on the decomposition of regional labour-productivity inequality proposed by Caselli and Tenreyro (2005). We analyse NUTS-1 regions because this methodology is based on a comparison of a benchmark region – one that is constantly the leader in terms of labour productivity – with all the others. This cannot be done for Italian NUTS-2 regions, as the benchmark would change over time. However, when the NUTS-1 borders are considered, the Northwest of Italy can be used as the leader region, in all the benchmarks; furthermore, as mentioned, working at the NUTS-1 level facilitates the analysis of the general spatial patterns of development in Italy, and it is both historically and economically meaningful (Felice 2010a, 2013, Felice and Vecchi 2015). The sources of overall convergence in the output-per-worker ratio with the Northwest are explored by breaking down overall catch up into within-industry convergence, structural change and between-industry convergence (see Enflo and Rosés 2015 for a similar exercise concerning Sweden since the mid-19th century).
More specifically, within-industry convergence can be defined as the catch up in labour productivity of each sector with the same sector of the Northwest. Convergence via structural change is captured through labour reallocation: it is due to labour moving from sectors characterized by low productivity to others where productivity is higher. There is convergence if the reallocation to more productive sectors happens faster in other regions than in the Northwest. Finally, between-industry convergence captures the contribution to convergence that comes from catching up in productivities across sectors.
Within-industry convergence – catch up within sectors – may be due to several different reasons well established in economic growth literature. First, as the neoclassical growth theory suggests (Solow 1956), the regions with a low capital-to-labour ratio will experience capital accumulation at a more rapid pace than advanced areas: this will bring about convergence in the intensity of capital to labour and, in turn, labour productivity. The same holds for human and – as recent research has shown – social capital. Secondly, within-industry convergence can happen because of technological progress, as the new growth theory outlined (Lucas 1988; Romer 1990): poor regions can effectively imitate existing innovations, or import them when they are embodied in capital goods. The New Growth Theory and New Economic Geography have also provided arguments in support of the idea that differences in the spatial proximity of regions to producers and/or consumers could affect productivity growth trajectories. Regions with the highest market potential would tend to grow faster by allowing scale and
11
agglomeration economies to be used in the generation of knowledge through investment in R&D or in the training of human capital (Martin and Ottaviano 1999; Fujita and Thisse 2002; Baldwin and Martin 2004). The presence of such localized increasing returns could prevent the convergence of distant or more isolated areas (for example, in Spain during the period 1893 – 1913, see Martinez-Galarraga 2012).
Certainly, low levels of human and social capital might have prevented disadvantaged regions from reaping the benefits of being a late-comer (see Caselli-Tenreyro 2005 for a similar argument applied to catch up within Europe). For example, large human capital regional disparities characterized Italy at the time of unification (Cappelli and Vasta 2017): in 1871, the best-performing provinces had literacy rates roughly equal to the average of Prussia, a technological leader at that time; instead, the worst-performing provinces of the South had literacy rates comparable to those of North Africa, per estimates by Prados de la Escosura (2011). Although regional differences in literacy faded out in the very long run, more nuanced measures of education – such as standardized test scores and access to quality schooling – point out the persistence of a strong regional divide in human capital up to the present day (OECD 2014; Save The Children Italia 2014; Felice and Vasta 2015).
Likewise, social capital deserves to be mentioned as one of the potential factors affecting regional convergence in productivity in the long run. Social capital is considered one of the main factors of conditional convergence across modern economies (see the seminal analysis by Knack and Keefer 1997). Recent research shows that social capital – the concept of which can be summarized as the value of social networks, norms and institutions – played a marginal role in the first phase of Italy’s regional divergence, between 1871 and 1911 (Cappelli 2017). However, Felice (2012) has argued that social capital affected regional economic development within Italy in the post-Fordist era, i.e. when manufacturing districts organized as networks became a new paradigm of business organization, one that increasingly relied on cooperative norms, trust and informal institutions to function smoothly. According to this interpretation, the lack of social capital might have contributed to hamper the development of industrial districts and agglomeration economies in the Italian southern regions from the 1970s on. Recently, Di Martino, Felice and Vasta (2017) have argued that differences in formal and informal institutions between the North and the South of the country can be seen as a peculiar case of persistence of two different sets of institutions within the same country.
12
Finally, in line with New Economic Geography economic foundations, A’Hearn and Venables (2013) and Missiaia (2015) have studied the role played by differences in market access between the North and the South as an element preventing productivity convergence across Italian regions. Missiaia (2015) concludes that the consideration of the differences in domestic market potential across northern and southern territories could help to explain the North-South productivity divergence between 1871 and 1911. Additionally, A’Hearn and Venables (2013) argue that, from 1945 on, differences in global, and not only domestic, market access favoured the relative productivity growth of the regions that were more connected to the European economic core (the North), preventing the productivity catch-up of the South.
It is important to note that within-industry convergence can also happen if there is no catch up in capital-to-labour ratios or in technology. For example, if employment does not change but working hours grow, the productivity of labour that we measure will increase as well (since it is measured as Y/L). By the same token, within each sector, low-productivity industries can be replaced by high-productivity ones, which will also lead to increased productivity of labour in the absence of major changes in the regional distribution of capitals or technology. However, this latter aspect should be captured by the reallocation of labour that we consider, so that the decomposition performed should roughly capture the evolution of within-industry productivity convergence over the long run (Enflo and Rosés 2015).
Finally, between-industry convergence captures catch up in labour productivity across sectors of the regional economy. Caselli and Tenreyro (2005) note that this happens when there is convergence of the productivity of the sectors in which the latecomer regions had a disproportionate share of the labour force to the productivity of the sectors in which the benchmark region is specialized. In this respect, different strands of the theoretical literature suggest various explanations about the evolution of productivity differentials along the process of market integration and specialization. On the one hand, neoclassical trade theory has been unable to establish a clear-cut prediction on the effect of the removal of obstacles to trade on the productivity convergence. So, the factor–prize–equalization theorem, within the Heckscher–Ohlin (HO) model is optimistic about the consequences of market integration: the increase in trade and factor movements leads to factor prices equalization across regions, and hence could favor productivity convergence. However, employing the same HO framework, market integration may also lead to increasing regional specialization because regions differ in factor endowments. In this situation, the standard HO model allows the equalization of factor prices but not that of productivity (Rassek and Thompson, 1998; Slaughter, 1997). On the other
13
hand, as has been posed by the New Economic Geography literature, there are relevant forces missing from neoclassical analysis that can affect regional disparities and prevent productivity convergence. NEG theoretical models suggest that the interaction between transport costs, increasing returns and market size can lead to the spatial agglomeration of economic activity (Fujita, Krugman and Venables 1999, Puga 1999, Baldwin and Martin 2004). As far as the spatial agglomeration of production enhances productivity growth, market integration could hamper regional within-sector convergence (Fujita, Krugman and Venables 1999, Puga 1999). With this framework in mind, we can look at the sources of regional convergence in productivity across Italian NUTS-1 regions, from 1871 to 2011. Table 1 shows whether an overall convergence (+) or divergence (-) with the Northwest existed throughout our period of study (column 1). Then, columns (2) to (7) present our decomposition to analyse the sources of regional labour productivity differentials. Column (2) shows the within-industry component, which is further divided in the contribution of the three main sectors of economic activity (agriculture, industry, services) in columns (3) to (5). Columns (6) presents the contribution of labour reallocation and column (7) offers the results for the between-industry component. As Table 1 shows, over the long run there has not been much convergence in labour productivity across Italian NUTS-1 regions. This evidence needs to be reconciled with the long-term decline in the Theil index of regional inequality in value added per worker, which shows that the overall gap in productivity across NUTS-1 regions tended to become smaller over time (Figure 6).13 One may note that this apparent discrepancy merely depends on the different nature of the two indices. The Caselli-Tenreyro methodology is focused on convergence and divergence with respect to the leader, the Northwest in this case. In the long run, Italy’s average labor productivity did not converge with that of the Northwest. However, this does not mean that sigma inequality (overall disparities across all regions) did not drop. Indeed, the dispersion around the national mean of labour productivity declined, as captured by the Theil index.
[Table 1 here]
The first column in Table 1 shows that the Northeast has caught up in the very long run, while the Centre has basically just remained behind compared to its relative position in 1871; the South, instead, has fallen behind compared to where it stood right after the country’s unification. Between 1871 and 2011, the growth of agricultural productivity in the South was slow, to the point that the region lost what had been a comparative advantage in 1871.
14
Furthermore, structural change via labour reallocation proceeded more slowly in the South than elsewhere, which compromised overall catch up. These two factors together more than offset the relative gains in labour productivity that happened within manufacturing and the service sector – where public policy after World War II played an important role. Finally, between-industry convergence, i.e. a decrease in regional inequality in labour productivity between sectors, was marginal over the long run, although – as we shall see – it played a more important role during specific phases of Italy’s development.
Indeed, since the relative importance of the sources of convergence or divergence changes a lot over time and across regions, we define four main periods to be studied more in depth. First, we focus on Italy’s Liberal Age before World War I; the second phase is the one that includes the Great War, the Interwar period characterized by the Fascist regime, and World War II; thirdly, we consider 1951 – 1971, the phase of Europe’s Golden Age and Italy’s “economic miracle” (and the only two decades when the South converged towards the Centre-North); finally, we explore the evolution of sources of convergence and divergence between 1971 and the present day.
4. The Liberal Age before World War I: 1871-1911
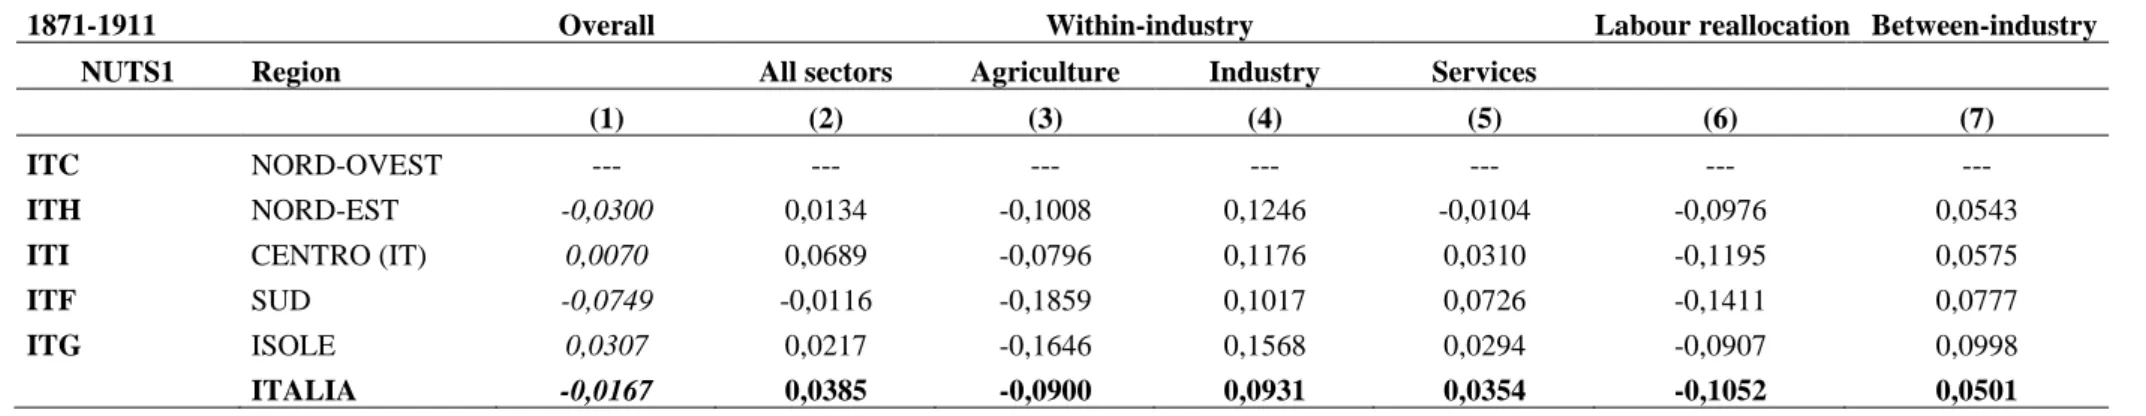
The first phase of Italy’s economic development was a time of slow yet remarkable change. After it had been unified, the Kingdom experienced its first wave of industrial growth along the trajectories of the Second Industrial Revolution. Regional economic disparities grew initially at a blunt pace, although the divide increased when the Industrial Triangle of Turin, Genoa and Milan forged ahead, especially between 1901 and 1911. During this first period, both outward migration and diverging fertility rates affected regional economic divergence, albeit to a minor extent. Between 1891 and 1911, more people emigrated from the South than from the North; at the same time, fertility rates declined more quickly in the North than in the Mezzogiorno, prompting regional divergence via the employment-to-population ratio (L/N). Divergence in labour productivity was also modest, yet it is worth noting how several forces influenced the sign of convergence in various ways. Table 2 presents the results based on the Caselli-Tenreyro decomposition of the sources of labour-productivity convergence during this first phase.
15
Overall, from 1871 to 1911, there was moderate divergence in productivity. The South, excluding Sicily and Sardinia, experienced the strongest divergence with respect to the Northwest of the country. Convergence in productivity across sectors of the economy (between-industry) did not play a prominent role. Instead, structural change – the reallocation of labour from low to high-productivity sectors – prompted regional divergence, as the years from 1891 to 1911 (especially the second decade) mark the first wave of industrial and economic growth in the Northwest – what Gerschenkron called the big spurt (Gerschenkron 1962). Labour was employed in new sectors, and the difference between the North and the South is striking: the share of the labour force in agriculture within the South grew in the late-19th century, while the productivity of this sector increased slowly. At the same time, the Northwest allocated more labour to industry and services, characterized by a higher productivity with respect to agriculture. Natural resources and domestic as well as foreign markets certainly played some role in the rise of industry in the Industrial Triangle (A’Hearn and Venables 2013); yet, recent research has placed more emphasis on human capital as a key feature that attracted more “mobile” factors of production, like labour and physical capital (Missiaia 2016, Basile and Ciccarelli 2017, see also Fenoaltea 2011).
Our calculations also suggest that within-agriculture productivity diverged strongly across regions. This reinforces the hypothesis put forward by Zamagni that land-tenure institutions – which differed greatly across areas of Italy – cast a shadow on regional long-term economic growth, especially before WWI (Zamagni 1993). Despite an initial advantage in agricultural labour productivity in the South – likely due to favourable global-market prices for its high-value-added crops – productivity in agriculture within the Northwest and the Northeast grew faster than elsewhere due to technological progress and capital deepening, while latifundia remained widespread in the South, hampering a more rapid increase in productivity. Sharecropping performed better in the Centre and Northeast of the country, yet the rise in productivity there did not match that experienced by the Northwest.
Despite divergence in terms of within-agriculture productivity, most regions experienced within-industry productivity convergence towards the level characterizing the Northwest; yet, this happened while the South was falling back in terms of industrial employment. This was likely to be the result of the increasing liberalization of trade worldwide, which hampered the less productive manufactural firms – especially those in Southern regions, where entrepreneurs faced growing competition from both within the country and abroad. As noted earlier, those were also years of remarkable foreign emigration – again, especially from the South –, which
16
brought about at least two important consequences concerning the productivity of labour. First, thanks to remittances, more modern financial institutions developed (Massullo 2001; Esteves and Khoudour-Castéras 2011), thus helping the growth of modern industrial firms through capital accumulation and allocation. Second, returning migrants played a positive role in the growth of labour productivity. They often reinvested their financial capital in their regions of origin, contributing to the local economy – an effect already noted by coeval scholars like Benedetto Croce (Croce 1925, 207-231, see also Giffoni and Gomellini 2015). They also possessed higher human capital and managerial skills compared to those who had decided to stay.
Another point worth noting is that, between 1871 and 1911, the share of illiterates in the South and islands remarkably declined, from 84 to 59%. Although at the national level the decrease was more remarkable (from 69 to 38%, see Felice 2012), these figures mean that, while in 1871 southern workers in industry and services were mostly illiterate (unlike in the North), by 1911 they were mostly literate (more similarly to the North). This change may have also contributed to reduce the gap in per worker productivity in industry and services.14 It is interesting to note that this change in human capital did not occur in agriculture (in line with our results), since southerner workers within this sector remained illiterate, while those of the Centre-North made the best out of increasing mass education. Productivity in services converged across regions as well. Together with the positive effects of emigration and growing literacy that operated for industry, the unification of the administration, transport and communication systems, as well as the (albeit small) growth in intra-regional trade, likely prompted productivity convergence within the tertiary sector.
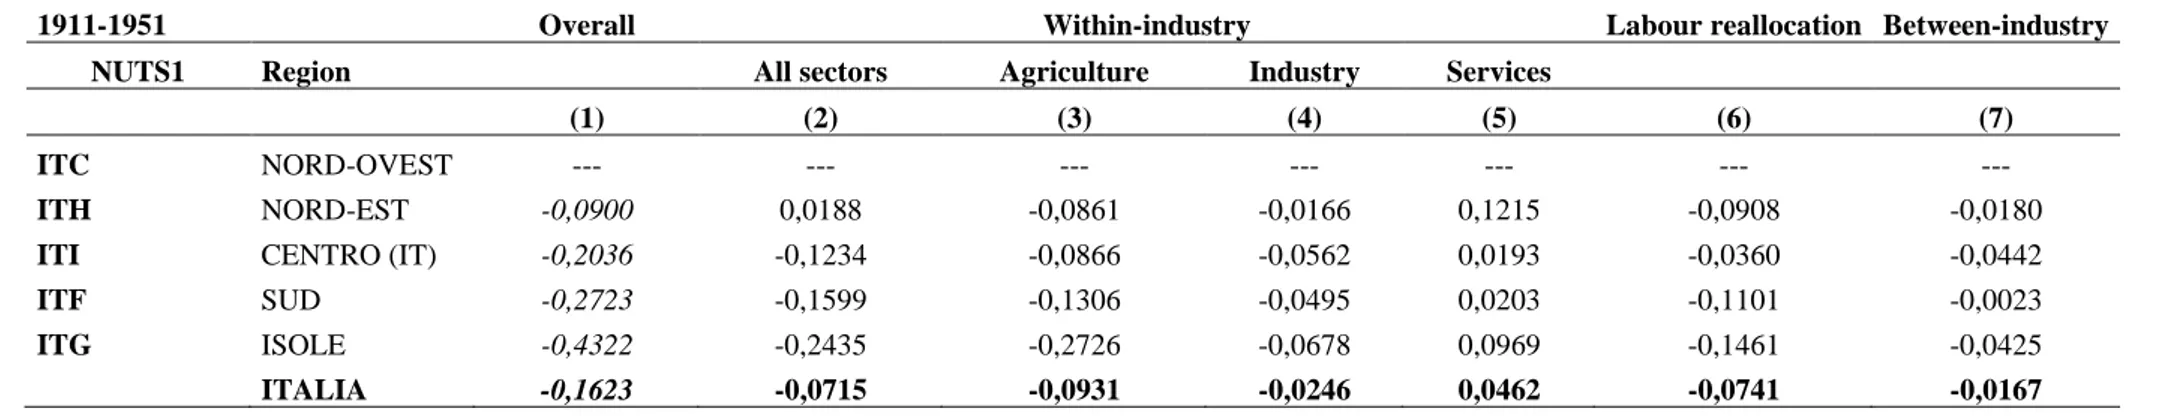
5. The World Wars and Fascism: 1911-1951
This phase was characterized by a troubled global context, with the rise of nationalisms and the First World War, later followed by the demise of the first globalization and the Great Depression, which ultimately led to World War II. Within Italy, these tensions brought about the rise of the Fascist Regime, which would rule the country for more than twenty years. This is the period of strongest regional divergence in labour productivity. This pattern tallies with
9 Emigration also affects our indices. The outflow of workers reduced industrial employment in the South while
increasing the wages of those who remained: this affects our estimates, as national GDP is allocated to regions via employment and wages under the hypothesis of unitary elasticity between capital and labour.
17
the one underlined by Felice (2011, 2013) for GDP per capita across NUTS-2 regions. Labour productivity in the Northwest forged ahead, although the Northeast kept up with it to some degree; yet, other macro-regions fell behind to a remarkable extent.
Again, divergence in productivity within agriculture plays the lion’s share. The autarky introduced by the Fascist Regime, with its focus on grain production towards alimentary self-sufficiency, hampered the growth of labour productivity in the South by limiting the functioning of comparative advantages and by bringing to the fore the enormous – and persistent – differences in land tenure across the country’s regions. At the same time, increasing industrial progress in the Northwest meant an additional positive impact on agricultural productivity, reinforcing divergence with respect to the rest of the country. By contrast, the industrial sector brought about only moderate regional divergence in labour productivity. The public support for companies and industries (starting with World War I and later with the Istituto per la Ricostruzione Industriale, IRI) in the Northwest further increased the gap across regions, especially as Northwestern companies consolidated their initial advantage from the pre-war decade – which tallies with the figures concerning labour reallocation, as they show a growing gap between the pace of structural change in the Northwest and the South (Ciocca 2015); yet, the government’s involvement favoured convergence in labour productivity within services. One case worth mentioning is the nationalization of the railway companies in 1905, when the private regional companies previously operating across the country were unified under the new Azienda Autonoma delle Ferrovie dello Stato, which may have prompted convergence in productivity within the sector. More in general, it is the share of workers and the value added within the public administration (mostly the central one) which grew in this period – in the education system, for instance, because of the Daneo-Credaro law in 1911, in the bureaucracy at various level – favouring convergence in this sector (Battilani, Felice, and Zamagni 2014). At the same time, as emigration was no longer possible due to changing internal and international conditions, and the Great-war effort and later autarky relied on manufactural firms in the North-West, the South and the islands fell back again in terms of industrial productivity.
Finally, it is worth noting that between-industry divergence occurred, but was weak. Labour productivity did not converge across sectors. Productivity in industry (where the share of workers was growing quickly) in the Northwest grew faster than productivity in agriculture in the South, were most workers were employed, contributing to the growing gap in the
18
Interwar period; yet, labour reallocation was important in different phases of Italy’s regional growth, as the next section will discuss in more detail.
6. The era of steady regional convergence: Italy’s Golden Age, 1951-1971
The post-WWII era represented a remarkable change with respect to the previous period. A new economic order was established with Bretton Woods, while international cooperation was helped by the rise of international trade and by unseen rates of economic growth in the developed world. Italy, now a Republic characterized by a progressive and modern constitution, experienced remarkable rates of yearly income growth, averaging 5.5 percent per annum over the period 1951-1971. Despite this “economic miracle”, growth was more equally distributed across the country’s regions than ever before. Not only did the South of the country keep the pace with the North; for the first time, southern regions converged towards the per-capita income level of the northwest – a trend that would have remained unparalleled in the economic history of Italy since its unification. This section explores some of the determinants of this phase of strong convergence, which lasted until the oil crisis of 1973.
Overall, labour productivity in the South and the Center of Italy quickly converged towards the level experienced by the Northwest. The Northeast converged as well, less prominently (but also from higher levels). In this phase, within-industry patterns account for most of the productivity convergence. While all NUTS-1 regions converged towards the level of labour productivity in agriculture and the service sector that characterized the Northwest in 1951, convergence was more noticeable within industry. In the latter, indeed, the performance of the southern regions was truly remarkable. Recently, Felice and Lepore (2017) have re-assessed the role played by the Cassa del Mezzogiorno (1950-1984) in this phase: the state-owned agency financed both privately-owned and public firms, especially in capital intensive sector, while carrying out infrastructural work that was very much needed in the South and islands. In the first two decades of its existence, when it was independent from Italy’s government under the external constraint of the International Bank for Reconstruction and Development, the Cassa had a significant impact on the economy of the South. Its strategy, although expensive (the Mezzogiorno, rich in labour but poor in capital, industrialized in the heavy sectors), explains the remarkable southern convergence in industrial productivity resulting from our estimates. Beginning in the second half of the 1960s, however, the Cassa was increasingly affected by national political issues, and it came to be an instrument to carry out ordinary
19
interventions that the state should have taken care of. When this happened, the ordinary administrations and institutions of the South further deteriorated. Also, the oil shocks and the subsequent stagflation crisis, while hampering mostly the capital-intensive plants in the South, made regional administrations call for more intervention by the Cassa, for unproductive uses and indiscriminate aids that had nothing to do with long-term economic planning.
During this phase, both internal and outward migration helped the South to catch up with income per capita levels in the North. However, as the convergence due to labour reallocation shows, the influx of labour force to the northern regions offset the structural change that was taking place in the South, thus partially reducing the positive impact of increased capital-to-labour ratios brought about by the government’s regional industrial policy. Between-sector convergence played some role. The industrial structure across Italian macro-regions did converge, and so did productivities across sectors: labour productivity within agriculture and the service sector in all macro-regions converged towards the levels experienced by the industrial sector in the North.
7. Diverging incomes, converging labour productivity? The last phase, 1971-2011
The last phase stretches between the onset of the oil crisis and the aftermath of the 2007-8 economic crisis. During this era, characterized by financial deregulation and the rise of a new globalization, sustained economic growth finally spread to Asia and, particularly, to China, which experienced double-digit growth rates. Given its relatively poor endowments of human capital, its industrial structure based on traditional sectors and its limited competitiveness in knowledge-based and hi-tech sectors, Italy struggled to remain at the frontier of economic development and structural change (Federico and Vasta 2010; Vasta 2010; Di Martino and Vasta 2017). Slow institutional transformations, as well as lacking reforms aimed to strengthen the country’s position in terms of innovation capabilities, further undermined its capacity to react to the challenges that – together with clear benefits – came from the adoption of the Euro on the eve of the 21st century.
As far as regional labour productivity is concerned, this phase witnessed limited regional convergence – and if anything, regional divergence – in per capita income; yet, this was not caused by growing differences in labour productivity across Italian macro-regions. Indeed, in this respect, convergence continued very steadily, with the South closing the gap further
20
between 1971 and 2011. As we mentioned before, income divergence across regions was the result of labour-market features.
The rapid change that characterized the functioning of the Cassa del Mezzogiorno, especially during the 1970s, coupled with the stagflation crisis of that period and the decline of state-owned enterprises (Felice 2010b), certainly affected the development of industry in the southern regions, by damaging the capital-intensive sectors which had been in the past (but now no longer) financed by the state. In fact, within-industry convergence was halted in the last 40 years, while within-convergence in agriculture and the service sector continued unabated from the post-war period. The reallocation of labour to the service sector, and especially to the public administration, further pushed the South on a path of steady convergence in overall labour productivity with the North – even though the between-industry convergence that had characterized the previous historical phase was jeopardized (and partly reversed) by a growing productivity gap between sectors where the South retained larger share of the labour force (agriculture) and those that became prominent in the Northwest (services, but also industry, which importance persists to the present day, contrary to what is observed in the South).
Conclusions
In this article, we have measured and discussed – for the first time – the contributions of labour productivity, structural change, the participation rate and the age structure of the population to the pattern of Italy’s regional inequality in per capita GDP over the long run – roughly from the unification of the country until the present day. To this scope, we have provided brand new regional estimates of the participation rate and the age structure of the population, in ten-year intervals from 1871 to 2011, which we use together with the most updated estimates of per capita GDP, per worker GDP and employment rate. After decomposing regional inequality in per capita GDP (Y/N) into labour productivity (Y/L) and labour-market features (L/N), we have employed the Caselli-Tenreyro decomposition to disentangle the effects of within-industry productivity, labour reallocation and between-industry productivity, on overall labour-productivity convergence (and divergence) in the different historical periods.
Our main results are the following. First, until the 1970s, labour productivity was central to the pattern of Italy’s regional development: during the Liberal Age (1871-1911)
within-21
industry and within-services convergence helped to maintain regional inequality low, in spite of growing divergence in labour productivity within agriculture and structural change (labour reallocation), brought about by the industrial take-off of the North-West; in the Interwar period (1911-1951), within-industry divergence also took place and the magnitude of Italy’s regional disparities peaked; instead, regional convergence during the Golden Age (1951-1971) was led by convergence in labour productivity (especially within-industry); yet, labour productivity is not central to the persistence of the North-South divide in the long run. Indeed, in the last forty years (1971-2011) the key factor of divergence has been the participation rate, which remained in the South far below that of the Centre-North – while convergence in labour productivity continued unabated. To this broad picture, we may add that demographic factors played some role in favouring divergence during the Liberal Age and, to a minor degree, convergence during the Golden Age.
We discuss these results through the lens of the updated literature about regional inequality and the North-South divide in Italy. The role of geographical factors, and in particular of access to markets (Daniele, Malanima, and Ostuni 2016), which can be connected to economies of scale, appears to have been limited to specific periods, mostly the Interwar years: this is suggested, first, by the result that within-industry convergence in productivity (rather than divergence) occurred during the Liberal Age and the economic miracle; secondly, and more indirectly, by the fact that the persistence of the North-South divide in the last period is due to the participation rate and not to long-term divergence in productivity.
Broadly speaking, our results confirm instead the relevance of national and local policies to account for the observed patterns of regional development, through the different historical periods: providing human capital through public schools after the turn of the 20th century; either making possible or preventing international and interregional migration; promoting top-down industrialization, then supporting unproductive expenditures in the backward regions during and after Italy’s “economic miracle”; adopting policies that reinforced the divide in terms of two different socio-institutional settings, in the Centre-North and the South respectively (Di Martino, Felice, and Vasta 2017). Among the others, these policies were crucial, and significantly impacted on the observed pattern of regional inequality in Italy – via productivity, employment, and the participation rate.
22
Figures
Figure 1. The decomposition of Italy’s regional disparities in per capita GDP (Y/N) into labour productivity (Y/L) and labour-market features (L/N), 1871–2011
Sources: elaborations from Felice (2009), Felice (2011), Felice (2015b) and Felice (2017). Note: the Y axis represents the coefficient of variation of Italy’s NUTS-1 regions around the mean national income.
0,00 0,05 0,10 0,15 0,20 0,25 0,30 0,35 0,40 0,45 1 8 7 1 1 8 8 1 1 8 9 1 1 9 0 1 1 9 1 1 1 9 2 1 1 9 3 1 1 9 3 8 1 9 5 1 1 9 6 1 1 9 7 1 1 9 8 1 1 9 9 1 2 0 0 1 2 0 1 1 Y/N Y/L L/N
23
Figure 2. The decomposition of the dispersion around the mean (NUTS-1) in the employment-to-population ratio (L/N) into the dispersion concerning the participation rate (L/WAP) and that caused by the working-age population (WAP/N), 1871–2011.
Sources: Table A.1 and Table A.2. Note: the dispersion around the mean is measured through the coefficient of variation. The 1891 is missing because there was no census in 1891 (and thus the WAP figures were not available for that year).
0,00 0,05 0,10 0,15 0,20 0,25 1 8 7 1 1 8 8 1 1 8 9 1 1 9 0 1 1 9 1 1 1 9 2 1 1 9 3 11 9 3 6 / 3 81 9 5 1 1 9 6 1 1 9 7 1 1 9 8 1 1 9 9 1 2 0 0 1 2 0 1 1 Dispersion L/WAP Dispersion WAP/N
24
Figure 3. Migration abroad % total residents in the Northwest (NW), Northeast and Center (NEC), and South and Islands (SI), 1876–2005.
Source: Gomellini and O’Grada (2013) and Serie Storiche ISTAT, Espatri e rimpatri per regione e ripartizione
geografica: anni 1876-2005 (2016a) (http://seriestoriche.istat.it/). Population figures at ten-year intervals were obtained from censuses, while yearly population figures were calculated by means of linear interpolation. NW refers to the Northwest (Piemonte, Lombardia, Liguria), NEC to the Northeast and Center (Trentino Alto Adige, Friuli Venezia Giulia, Veneto and Emilia Romagna, Toscana, Marche, Umbria and Lazio), SI to South and Islands (Abruzzo, Molise, Campania, Calabria, Basilicata, Puglia, Sicilia and Sardegna). 5-year Moving Averages (MA) are reported. 0,00% 0,50% 1,00% 1,50% 2,00% 2,50% 1 8 7 6 1 8 8 0 1 8 8 4 1 8 8 8 1 8 9 2 1 8 9 6 1 9 0 0 1 9 0 4 1 9 0 8 1 9 1 2 1 9 1 6 1 9 2 0 1 9 2 4 1 9 2 8 1 9 3 2 1 9 3 6 1 9 4 0 1 9 4 4 1 9 4 8 1 9 5 2 1 9 5 6 1 9 6 0 1 9 6 4 1 9 6 8 1 9 7 2 1 9 7 6 1 9 8 0 1 9 8 4 1 9 8 8 1 9 9 2 1 9 9 6 2 0 0 0 2 0 0 4 NW NEC SI
25
Figure 4. Standardized fertility rates across Italy’s NUTS-1 regions, 1871–1961.
Source: Livi Bacci (2015). Notes: fertility rates are standardized by comparing them to the fertility of married Hutterite women (marriages of 1921 – 30), which Livi Bacci describes as “a very high fertility level, probably close to the maximum attainable in a large population”.
0,00 0,05 0,10 0,15 0,20 0,25 0,30 0,35 0,40 0,45 1 8 6 1 1 8 7 1 1 8 8 1 1 8 9 1 1 9 0 1 1 9 1 1 1 9 2 1 1 9 3 1 1 9 3 6 1 9 5 1 1 9 6 1 NW NE C S I
26
Figure 5. Internal migration rates in Italy’s NUTS-1 regions, 1952–2009
Source: Serie Storiche ISTAT, Tasso migratorio interno per regione e ripartizione geografica: anni 1952-2008 (2016b). -15 -10 -5 0 5 10 15 20 NW NE C S I
27
Figure 6. The Theil index of labour productivity in Italy’s regions, 1871–2011 (NUTS-1 level).
0,000 0,010 0,020 0,030 0,040 0,050 0,060 1871 1881 1891 1901 1911 1921 1931 1941 1951 1961 1971 1981 1991 2001 2011 Theil Index Poly. (Theil Index)
28
Figure 7. Within- and between-sector component of the Theil index of labour productivity, 1871–2011 (NUTS-1 level). 0% 10% 20% 30% 40% 50% 60% 70% 80% 90% 100% 1871 1881 1891 1901 1911 1921 1931 1938 1951 1961 1971 1981 1991 2001 2011 Within Between
29
Table 1. Caselli-Tenreyro exercise, Italy 1871–2011, NUTS-1
1871 – 2011 Overall Within-industry Labour reallocation Between-industry
NUTS1 Region All sectors Agriculture Industry Services
(1) (2) (3) (4) (5) (6) (7)
ITC NORD-OVEST --- --- --- --- --- --- ---
ITH NORD-EST 0,0367 0,3103 -0,0653 0,1555 0,2201 -0,2747 0,0012
ITI CENTRO (IT) -0,0034 0,2028 -0,0501 0,0948 0,1581 -0,2080 0,0018
ITF SUD -0,0337 0,2777 -0,1148 0,1136 0,2789 -0,3239 0,0124
ITG ISOLE -0,1185 0,3191 -0,1869 0,1337 0,3723 -0,4358 -0,0018
30
Table 2. Caselli-Tenreyro exercise, Italy 1871–1911, NUTS-1
1871-1911 Overall Within-industry Labour reallocation Between-industry
NUTS1 Region All sectors Agriculture Industry Services
(1) (2) (3) (4) (5) (6) (7)
ITC NORD-OVEST --- --- --- --- --- --- ---
ITH NORD-EST -0,0300 0,0134 -0,1008 0,1246 -0,0104 -0,0976 0,0543
ITI CENTRO (IT) 0,0070 0,0689 -0,0796 0,1176 0,0310 -0,1195 0,0575
ITF SUD -0,0749 -0,0116 -0,1859 0,1017 0,0726 -0,1411 0,0777
ITG ISOLE 0,0307 0,0217 -0,1646 0,1568 0,0294 -0,0907 0,0998
31
Table 3. Caselli-Tenreyro exercise, Italy 1911–1951, NUTS-1
1911-1951 Overall Within-industry Labour reallocation Between-industry
NUTS1 Region All sectors Agriculture Industry Services
(1) (2) (3) (4) (5) (6) (7)
ITC NORD-OVEST --- --- --- --- --- --- ---
ITH NORD-EST -0,0900 0,0188 -0,0861 -0,0166 0,1215 -0,0908 -0,0180
ITI CENTRO (IT) -0,2036 -0,1234 -0,0866 -0,0562 0,0193 -0,0360 -0,0442
ITF SUD -0,2723 -0,1599 -0,1306 -0,0495 0,0203 -0,1101 -0,0023
ITG ISOLE -0,4322 -0,2435 -0,2726 -0,0678 0,0969 -0,1461 -0,0425
32
Table 4. Caselli-Tenreyro exercise, Italy 1951–1971, NUTS-1
1951-1971 Overall Within-industry Labour reallocation Between-industry
NUTS1 Region All sectors Agriculture Industry Services
(1) (2) (3) (4) (5) (6) (7)
ITC NORD-OVEST --- --- --- --- --- --- ---
ITH NORD-EST 0,1053 0,0375 0,0294 0,0207 -0,0126 0,0402 0,0275
ITI CENTRO (IT) 0,1937 0,1092 0,0090 0,0628 0,0374 0,0416 0,0429
ITF SUD 0,2075 0,1393 0,0318 0,0841 0,0234 0,0245 0,0437
ITG ISOLE 0,2238 0,1650 0,0286 0,0914 0,0450 0,0102 0,0486
33
Table 5. Caselli-Tenreyro exercise, Italy 1971–2011, NUTS-1
1971-2011 Overall Within-industry Labour reallocation Between-industry
NUTS1 Region All sectors Agriculture Industry Services
(1) (2) (3) (4) (5) (6) (7)
ITC NORD-OVEST --- --- --- --- --- --- ---
ITH NORD-EST 0,0514 0,0516 0,0040 0,0105 0,0372 0,0075 -0,0077
ITI CENTRO (IT) -0,0005 0,0029 0,0102 -0,0210 0,0136 0,0185 -0,0219
ITF SUD 0,1060 0,0422 0,0213 -0,0206 0,0415 0,0894 -0,0256
ITG ISOLE 0,0592 0,0322 0,0126 -0,0182 0,0377 0,0588 -0,0318
34
STATISTICAL APPENDIX
Table A.1. Labour-force participation rates (L/WAP) across Italian NUTS-2 regions, 1871–2011
L/WAP 1871 1881 1901 1911 1921 1931 1936 1951 1961 1971 1981 1991 2001 2011 Piemonte 72.24 91.30 91.42 87.09 81.87 68.33 77.08 71.67 71.08 64.64 65.63 64.40 68.80 70.96 Val d’Aosta 90.09 79.13 69.83 76.15 75.83 74.31 78.62 Lombardia 73.01 90.53 88.63 81.55 79.39 65.80 71.31 68.00 68.15 63.43 64.75 68.05 70.22 71.26 Liguria 72.57 79.85 83.26 75.48 69.32 60.01 65.54 58.35 60.35 56.17 60.23 61.86 67.43 68.68 Trent.-Alto A. 82.10 65.59 76.61 69.82 71.05 65.88 76.34 77.37 78.49 76.94 Veneto 66.90 77.91 83.81 79.79 76.33 60.28 70.69 64.95 63.62 58.85 64.75 67.32 70.73 73.42 Friuli-V. Giu. 47.46 47.83 73.44 63.43 62.08 60.61 66.51 65.52 68.97 72.98 Emilia-Rom. 72.36 76.56 84.23 80.53 80.77 64.92 73.75 62.62 63.21 60.43 69.58 72.25 77.03 78.05 Toscana 74.49 77.61 82.00 78.01 72.86 63.15 68.13 64.71 64.31 58.18 66.03 66.60 71.27 71.31 Umbria 79.35 77.80 82.57 76.41 78.60 66.67 75.29 64.09 61.46 53.73 61.06 63.43 67.33 67.26 Marche 75.64 83.90 90.42 81.82 84.16 71.27 78.66 67.42 67.13 59.81 69.36 67.16 68.58 73.29 Lazio 74.57 80.11 80.76 71.69 72.68 64.09 67.96 63.44 59.54 54.90 55.38 60.24 64.24 66.83 Abruzzo 67.90 77.47 86.04 76.73 76.10 63.24 74.84 61.88 62.26 54.46 57.44 58.16 59.57 58.65 Campania 72.87 76.71 81.35 75.76 78.43 61.24 65.35 56.73 54.86 47.87 50.57 46.85 46.00 42.15 Puglia 69.18 72.56 76.63 71.45 74.61 58.09 64.11 63.59 60.76 55.51 51.40 50.72 49.28 47.65 Basilicata 63.88 77.48 89.68 85.73 88.77 65.47 77.10 74.49 67.87 54.52 52.69 46.70 49.29 53.57 Calabria 69.14 69.67 91.09 80.54 90.17 61.20 70.39 68.34 60.04 52.94 49.52 47.51 47.51 48.83 Sicilia 66.81 69.69 67.40 60.68 68.59 55.17 56.97 52.64 52.96 48.17 47.62 47.52 46.25 44.46 Sardegna 59.80 64.57 65.76 62.98 61.97 58.50 62.29 62.71 59.05 53.19 50.88 53.30 51.29 54.35 Italy 70.67 77.73 82.81 76.64 75.79 62.27 70.53 65.74 63.63 57.53 60.84 61.10 62.98 64.17
35
Table A.2. Working-age population as a share of total population (WAP/N) across Italian NUTS-2 regions, 1871–2011
WAP/N 1871 1881 1901 1911 1921 1931 1936 1951 1961 1971 1981 1991 2001 2011 Piemonte 62.30 61.70 60.40 62.00 66.90 69.60 68.20 70.43 69.39 66.00 66.31 69.86 66.70 64.86 Val d’Aosta 67.80 69.27 67.62 67.89 70.71 67.62 67.56 Lombardia 63.30 62.60 60.30 60.10 64.20 67.50 66.00 68.91 69.39 66.41 67.46 71.58 68.64 68.73 Liguria 61.20 62.20 62.20 64.00 68.00 70.30 69.20 71.09 70.15 65.93 65.66 67.84 63.80 60.24 Trent.-Alto A. 64.00 64.80 63.70 64.79 66.02 63.06 65.57 69.04 66.95 70.01 Veneto 61.30 60.80 57.50 54.90 59.40 60.50 59.00 64.65 66.33 64.28 66.27 70.50 68.25 68.87 Friuli-V. Giu. 64.50 66.90 66.10 68.04 69.49 65.90 65.53 68.78 67.11 64.38 Emilia-Rom. 62.60 63.90 59.90 59.10 61.10 63.50 62.90 68.76 69.58 67.14 66.49 68.67 65.68 68.38 Toscana 61.90 63.40 59.60 60.50 63.40 65.30 64.40 68.51 68.81 66.12 65.73 68.12 65.85 65.49 Umbria 62.60 64.00 59.30 59.50 60.10 60.80 59.80 66.92 68.34 67.31 66.36 67.02 64.95 66.77 Marche 62.10 63.60 58.10 58.00 59.60 60.70 59.50 66.74 67.66 66.24 66.70 67.97 66.08 65.82 Lazio 65.80 67.50 62.80 63.50 64.50 63.50 62.30 66.51 66.99 65.60 67.00 70.49 68.17 70.01 Abruzzo 62.20 62.30 58.00 57.00 58.60 57.60 56.00 64.27 64.89 63.79 64.24 66.40 65.40 66.05 Campania 63.40 63.80 59.10 59.10 60.40 58.80 57.10 61.91 61.62 60.84 63.12 67.37 67.21 67.06 Puglia 61.90 62.40 59.00 59.10 59.40 58.80 57.10 60.33 60.94 60.93 62.75 67.35 67.40 65.89 Basilicata 63.20 62.20 58.10 57.00 58.70 57.40 55.00 62.15 61.21 61.38 63.16 66.56 65.72 63.23 Calabria 62.10 62.80 57.40 56.70 57.50 56.60 54.30 60.32 59.49 60.29 62.45 65.89 66.23 64.06 Sicilia 61.60 61.50 59.90 60.80 61.40 60.40 58.80 62.60 61.94 61.65 62.88 66.08 65.96 65.68 Sardegna 62.40 63.20 61.90 60.50 61.50 60.40 58.70 59.49 60.09 60.26 63.23 69.05 70.05 67.23 Italy 59.30 59.71 56.52 56.74 62.05 62.88 61.45 65.66 65.96 64.29 65.32 68.81 67.10 66.96