1 a.a. 2009/2011
Università degli Studi di Catania
Scuola Superiore di Catania
International PhD
in
STEM CELLS
XXIV cycle
Exploring Cancer Stem Cells (CSCs) pathways to design novel therapies for
glioblastoma treatment
Simona di Martino
Coordinator of PhD
Tutor
2 a.a. 2009/2011
Index
Abstract 4 Introduction 4 Glioblastoma Multiforme. 5 Epidemiologic Features 6 Pathological Features 7Cancer stem cells 9
Isolation and characterization of Glioblastoma Stem Cells 13
Expression profiling of microRNAs in GBM-SCs 14
MicroRNAs and cancer 16
Cancer stem cells therapeutic implication 18
Reverse Phase Protein Array and drug screening 19
UCN-01 20
Methods 21
Glioblastoma stem cells isolation and culture 21
Lentiviral Vectors 22
Glioblastoma stem cells lentiviral infection 22
RNA isolation
andReal-Time PCR 23
MicroRNA analysis for identification of newtarget of GBM-SCs 23
In vitro Growth Curve 24
Soft agar colony formation assay 24
In vitro cell migration assay 24
Clonogenical assay 25
Tube formation assay 25
Tumor formation in vivo 25
Phosphoproteomic analysis 25
Kinase inhibitors library in vitro screening 29
Positive hits titration and combination with chemotherapeutics or commercially
available inhibitors 29
Viability assay 29
3 a.a. 2009/2011
Western blotting 31
Intracranial implantation of glioblastoma neurosphere cells (GNCs). 32
Histological assessment of tumor xenografts. 33
Statistical analysis 33
Results 33
Expression profiling of miRNAs in GBM-SCs revealed that miR-135b is
significantly downregulated 33
MiR-135b overexpression inhibits GBM-SCs malignancy 41
Phospoproteomic analysis of GBM-SCs 42
Screening of a kinase inhibitors library revealed 4 compounds that negatively
affect the viability of GBM-SCs 43
Only the RO 31-8220 analog UCN-01 significantly inhibits GBM-SCs proliferation/survival 48
UCN-01 induces apoptosis in GBM-SCs 52
Effects of UCN-01 on GBM-SCs intracerebral xenografts 53
Discussion 56
4 a.a. 2009/2011
Abstract
Glioblastoma multiforme (GBM) is the most aggressive and common form of primary brain tumor in adults, with a median survival rate of 14 months (Taphoorn et al.;2005 ). GBM is characterized by rapid diffusely infiltrative growth and high level of cellular heterogeneity, which are fueled by dysregulation of multiple signaling pathaways. It is also characterized by multiple genetic alterations: the most frequent is the loss of heterozygosity (LOH) 10q; there are also epidermal growth factor receptor (EGFR) amplifications, TP53 and phosphatase and tensin homolog (PTEN) mutations. GBM is classified into primary glioblastoma developing rapidly de novo and secondary glioblastoma, usually developing from lower grade astrocytomas. Despite major therapeutic improvements made by combining neurosurgery, radiotherapy and chemotherapy, the prognosis and survival rate for patients with GBM remains poor (A.F.Carpentier and J.Y. Delattre. ;2005). There is a recognized need for new approaches based on increased understanding of the biological and molecular nature of these tumors.
In recent years, it has been demonstrated that GBM possesses a hierarchical organization of heterogeneous cell populations which differ in their tumor-forming potential: there are both cells with a limited lifespan that are destined to abortive differentiation and will eventually stop dividing, and a small subset of self-renewing tumoral cells capable of initiating and maintaining tumor growth. These cells are called Glioblastoma Stem Cells (GBM-SCs) and share several features with neural stem cells (NSCs) including: the expression of neural markers such as Nestin and Sox2, the ability to migrate within the brain, the capacity to self-renew and to undergo multilineage differentiation and the responsiveness to similar signalling cues. Moreover, when compared to their non-stem progeny, GBM-SCs also show increased resistance to drugs and to the apoptosis-inducing mechanisms that are effective in conventional tumoral cell lines. The isolation of GBM-SCs has introduced a new and revolutionary paradigm in cancer therapy, since these cells are likely to include a population able to support tumor relapse and should therefore be considered a primary therapeutic target (Hirschmann-Jax, C. et al.;2004, Dean, Fojo, & Bates; 2005).
Current therapeutic strategies do not take into account potential differences in drug sensitivity between the tumorigenic and the more abundant non-tumorigenic cells in the tumor. The opportunity to study GBM-SCs adds a radical change to the perspective by which the neoplastic phenomenon is observed and prompts for a detailed analysis of the molecular determinants of
5 a.a. 2009/2011
tumorigenicity. Indeed it has been suggested that tumor relapse after conventional chemotherapeutic treatment might be a consequence of an expansion sustained by Cancer Stem Cells (CSCs) that are spared by virtue of their relative quiescence and the expression of drug-effluxing membrane transporters. In this project, we proposed to identify therapeutic agents that efficiently kill GBM-SCs and might be useful to set up more effective treatments for GBM . To this aim, we analyzed the expression profiling of microRNAs (miRNAs) in samples in order to identify those with potential importance in tumor biology and we performed in vitro citotoxicity assays on our GBM-SC lines using a library of 80 kinase inhibitors, in order to identify and target pathways involved in tumor progression and maintenance.
MiRNAs are emerging as important regulators of many biological processes, such as cellular differentiation and proliferation and have been implicated in the etiology of a variety of cancer. Libraries of synthetic compounds with known specificity have been screened in-vitro with the aim to study the sensitivity of tumor cells to the inhibition of a specific signal transduction pathway and the consequent development of targeted therapies.
Introduction
Glioblastoma Multiforme
Glioblastoma Multiforme (GBM) is the most common and aggressive tumors derived from glial
cells and include tumors of astrocytic, oligodendrial, ependymal, or mixed origin. The standard name
for this brain tumor, as defined by yhe World Health Organization (WHO), is glioblastoma.
The term was coined by Mallory in 1914 and consolidated in the lexicon of surgery by Bailey
and Cushing neuropathology in 1926. The designation "multiforme" suggests that the GBM
shows marked intratumor heterogeneity on the cytopathological, transcriptional and genomic
levels (Miller & Perry, 2007). In other words, the cellular composition can considerably vary
and histological features of mixed type typical. This complexity, combined with the hypothesis of the existence of a subpopulation of cancer stem cells and an incomplete injury (epi) genetic basis , has made GBM one of the most complex to understand and treat cancer (Frank. et al ., 2008).
6 a.a. 2009/2011
Figure 1.Image obtained by magnetic resonance imaging of a glioblastoma in the left side of the brain. The tumor presented active infiltration into the surrounding areas including the corpus callosum, the arrows indicate the directions of the tumor infiltrative fronte.
Epidemiologic Features
Glioblastoma multiforme may present at any age, but typically affects adults, with increasing incidence until aged 85 and above. The median age at diagnosis is 64 years, with more than 80 % of diagnosed GBM patients being older than 55 years and only 1 % younger than 20 years. Males are more commonly affected, with an incidence rate almost 1.6 times higher than in females. The glioma incidence is generally higher in the Western world com-pared to less developed countries (Curado, Edwards, Shin, et al.,2007). The major reason of the higher glioma incidence in developing countries is currently under ascertainment but is related to limited access to health care, variations in diagnostic practices, and incomplete reporting of glioma cases (Fisher., et al 2007). Moreover, some reports also indicate that ethnic differences in glioma susceptibility may exist. For example, in the United States GBM is more frequent in Caucasians than in people of African and Asian descent. A 1-2 % annual increase in the total brain tumor incidence occurred through the 1980s and 1990s, which pri-marily is thought to reflect the improved clinical diagnosis of neurological diseases after introduction of high-resolution neuroimaging in the early 1980s. However, a true rise in incidence for at least some types of brain tumors cannot be excluded, but such evidence are yet to be demonstrated for GBM.
For the majority of gliomas no underlying carcinogenetic causes can be identified. So far, the only established environmental risk factor reported is exposure to high-dose, ionizing radiation
7 a.a. 2009/2011
(Il’ yasova, et al., 2008). Several epidemiological studies have also demonstrated an association between increased glioma risk and other environmental factors, including severe head injury, dietary risk factors, occupational risk factors, and exposure to electromagnetic fields. However, the data regarding the suggested risk factors remain inconclusive, since other studies failed to identify any link to glioma development. (Wiemels., et al., 2007 and Berger., et al 2002). More consistent reports suggest a protective effect of allergic diseases and infections, indicating that immune surveillance mechanisms stimulated by these conditions, inhibit glioma development . Genetic predisposition has been observed in 5-10 % of glioma cases (Wiemels., et al., 2007). Rare genetic syndromes associated with an increased risk of glioma such as neurofibromatosis 1 and 2, tuberous scle-rosis, retinoblastoma (RB) 1, Li-Fraumeni syndrome, Turcot’s syndrome, and multiple harmatoma only account for few cases. Gliomas have also been observed to run in families, not affected by the listed syndromes, but implicated susceptibility genes remains yet to be identified. In addition, the causal relationship between glioma and common polymorphisms in genes involved in detoxification of carcinogens, cell cycle regulation, and DNA repair mechanisms, have been investigated only to reveal vague or no association. (Wiemels., et al., 2007 and Il’ yasova, et al., 2008 )
Pathological Features
Glioblastoma multiforme lesions are typical large at the time of diagnosis and may occupy much of a brain lobe. The lesions are often located in the subcortical white matter of the cerebral hemispheres and frequently extend across the border of the frontal lobe into the temporal lobe. Tumor infiltration has often progressed into the adjacent cortex and through the corpus callosum into the contralateral hemisphere. (Cavenee., et al., 2007).
The tumor mass of GBM is characterized by being poorly delineated and having a high degree of regional heterogeneity. Highly proliferating cancer cells are usually found in the peripheral, hypercellular zone of the tumor, whereas the central tumor area mainly consists of necrotic tissue, comprising up to 80 % of the total tumor mass. Histopathologically, the lesions typically exhibit cellular hyperplasia in peripheral zones harboring cancer cells with atypical nuclei, in-creased mitotic activity, cellular pleomorphism and poor stages of differentiation. A diagnostic feature of GBM is the presence of areas with vascular hyperplasia, necrosis or both in the tumor tissue. Another hallmark of GBM is rapid invasion of the surrounding brain tissue,
8 a.a. 2009/2011
especially along myelinated brain structures such as the corpus callosum or within perivascular spaces. Infiltrating tumor cells are dispersed within the normal brain tissue surrounding the contrast-enhancing tumor border at high-resolution scans. These satellite cancer cells are thought to be the origin of local tumor recurrence after therapy, since the infiltrating cells escape surgical resection and high-dose radiotherapy of the primary tumor mass. Despite the highly infiltrative nature of GBM, it does not tend to invade neither the subarachnoidal space nor the vessel lumen, and therefore distant metastases are rarely found, both within and outside the Central Nervous System (CNS). (Cavenee., et al., 2007).
GBM lesions most commonly occur as primary GBM a without clinical evidence of a preceding lesion within the CNS (Ohgaki, Kleihues., 2007 and Stegh., et al ., 2007). Only about 5 % of GBM cases progress from lower grade astrocytomas into secondary GBM (Ohgaki, Kleihues., 2007). The time to progression is highly variable, ranging from less than 1 to more than 5 years before occurrence of GBM. Primary lesions typically affect older patients with a mean age of 62 years at diagnosis, whereas secondary GBM in contrast develop in younger patients with a mean age of 45. Phenotypically, primary and secondary GBM are indistinguishable. However, the two GBM subtypes display distinct genetic abnormalities, suggesting that their malignant transformation occurs through different genetic pathways. Primary GBM in adults is associated with epidermal growth factor receptor (EGFR) overexpression and mutation, loss of heterozygosity (LOH) of chromosome 10q, mutation of the phosphatase and tensin homology (PTEN) gene, and deletion of the p16 gene. Mutations in the p53 gene, LOH of chromosome 10q, and abnormalities in the pathway regulating the tumor suppressor Rb are frequently found in secondary GBM. Overall, these genetic alterations in both primary and secondary GBM result in overactivation of several mitogenic signaling pathways that ultimately leads to uncontrollable growth of the affected cells. (Ohgaki, Kleihues., 2007 and Stegh., et al., 2007 )
The cellular origin of GBM is subject of intense investigation. Traditionally, it was believed that GBM arose from mature astrocytes, and that expression of progenitor cell markers was the result of de-differentiation during the process of malignant transformation. However, recent research suggests that the tumors may originate from malignant transformation of neural stem cells or related progenitor cells (Das, Srikanth, Kessler., 2008). In agreement with this theory, cancer cells with stem cell-like properties have been isolated from GBM tumors and cell lines. These so-called cancer stem cells (CSCs) only account for a small fraction of the tumor, but
9 a.a. 2009/2011
exhibit classical stem cell properties such as an extensive proliferative potential, self-renewal, and multipotency. Furthermore, the isolated CSCs display pronounced tumorigenic behavior when implanted into immunocomprised mice, giving rise to tumors mimicking the phenotype and recapitulating all the different cell types of parent tumors. CSCs may therefore be the driving force of GBM growth through their unlimited growth potential. Accumulating evidence suggest that the CSCs may represent descendents of neural stem cells or related progenitor cells that suffered the initial carcinogenic insult, but still the possibility of de-differentiation of more mature astrocytes have not been disproved (Stiles, Rowitch., 2008). Thus, distinct proof of the cellular origin of GBM as well as their inherent CSCs still remains to be found.
Cancer stem cells
Normal adult stem cells have been described in small quantities in most of the body tissues, where they carry out functions of tissue maintenance and regeneration (Verstappen, J., et al.,
2009). There are two properties that help to define a stem cell:
•self-renewal. Stem cells have unlimited replicative potential.
• multipotency. Stem cells have the ability to differentiate into the different cell types that compose the tissue of origin.
These properties are due to the ability of stem cells to perform both symmetrical and asymmetrical mitotic divisions. The former produces two identical daughter stem cells, while the latter give rise to a stem and to a more differentiated cell. This allows stem cells to provide cell replacement for the whole lifespan.
The idea that a subpopulation of stem cells may guide the development of the tumor dates back
from the early twentieth century (Becker., Mc, and Till, 1963 andFurth, and Kahn 1937). This
hypothesis arises from studies that assessed cancer cells heterogeneity in terms of both morphological and proliferative potential (Heppner., 1984.). Indeed, in cancer cell population only a small fraction is able to form colonies in semisolid culture. It is also known that xenotransplantation experiments (into immunocompromised mice) requires a large number of cells, indicating that only a small fraction of cells is equipped with tumorigenic capacity
10 a.a. 2009/2011
(Hamburger and Salmon, 1977). Two models have been proposed to explain this heterogeneity (Figure2). The "stochastic" model proposes that all the cells within a tumor have tumorigenic capacity. The explanation why only a small part of them is able to regenerate the tumor in vitro and in vivo is therefore due to extrinsic factors such as experimental or microenvironmental conditions.
According to "cancer stem cells" (CSC) model, instead, there is a specific subpopulation of cells capable of expressing tumorigenic properties. CSC in fact shares with normal tissue stem cells the ability to self-renew and generate differentiated progeny responsible for tumor formation and maintenance.
CSC existence was confirmed in 1997 by John Dick and colleagues who first isolated human
leukemic CSC (Bonnet, and Dick,1997) . The experimental procedure adopted is analogous to
that used for hematopoietic stem cells (HSC) isolation (Baum, et al., 1992 and Osawa, et al.,
1996). CD34+/CD38- cells were isolated by Fluorescence Activated Cell Sorting( FACS) from
patients with acute myeloid leukemia and inoculated in immunodeficient mice (NOD/SCID) to
test their tumorigenicity. The authors found that CD34+/CD38- were able to regenerate the
Figure 2. Two general models to explain cellular heterogeneity in solid tumors. According to
the stochastic model there is a degree of heterogeneity among the tumor cells and most of them have the ability to form new tumors. According to the CSC model only a small population of cells (represented in yellow) can give rise to new tumors (Reya , et al.,2001).
11 a.a. 2009/2011
leukemic compartment whereas, the CD34+/CD38+ more differentiated population, lack this
ability. This study was followed by other leading to the possibility to identify CSC populations also in solid tumors including breast, central nervous system, prostate, lung, liver and colon cancer (Table1).
Table1. Cancer stem cells associated markers
Once having identified cancer cells with stem-like properties several assumptions about their possible role in cancer development have been made. One possibility is that mutations occur that alter renewing regulation in normal stem cells given the ability of stem cells to self-renew indefinitely while maintaining replicative potential. A second hypothesis is that these cells are more likely to accumulate mutations over time increasing chances of neoplastic transformation. However, CSC model identification has, led to new approaches in cancer experimental research. This is true especially in light of recent works that have been demonstrated CSC resistance to chemotherapy and radiotherapy. One of the most commonly
12 a.a. 2009/2011
used methods for CSC enrichment from primary cultures of tumor cells, is the Hoechst 33342
dye exclusion (Goodell, et al.,1996 and Kondo, Setoguchi, and Taga, 2004) . Goodell and
colleagues demonstrated that this phenomenon involves the multidrug resistance transporter
(MDR1), a member of the ABC (ATP Binding Cassette) family transporters (Hirschmann-Jax,
et al.,2004). Several studies (Nakai, et al.,2009 and Shervington, and. Lu, 2008 ) showed that the CSC associated chemoresistance is due to increased expression or activity of MDR1. Other gene expression studies have identified a correlation between CSC chemotherapy resistance and high expression levels of Breast Cancer Resistance Protein (BCRP1) multidrug resistance gene. Similarly, genes involved in DNA mismatch repair system as MGMT (methyl-guanine methyl transferase) and genes encoding antiapoptotic proteins such as Bcl-2, Bcl-XL and FLIP
have been associated with chemoresistance (Liu, et al.,2006). As with chemotherapy,
radiotherapy resistance has been linked to the CSC. In a recent paper has been shown that the stem cell subpopulation contributes to tumor radioresistance through more efficient checkpoint
activation by DNA damage, compared to the remaining tumor population (Bao, et al., 2006). For
the aforementioned reasons, CSC subpopulation can be considered responsible for tumor initiation, progression and spreading to other organs. Thus, CSC must be considered as a new target for therapy aimed at complete tumor healing (Figure 3).
13 a.a. 2009/2011
Figure 3. (A) Conventional therapy was mainly addressed towards the more mitotically active
cells, thus resulting less effective on resting cells such as CSC. After an initial shrinkage the tumor tends to recur because of the small stem cell population remained alive. (B) A targeted therapy can selectively kill CSC thus eliminating tumor regenerative capacity ( Ricci-Vitiani, L., et al.,2009) .
Isolation and characterization of Glioblastoma Stem Cells
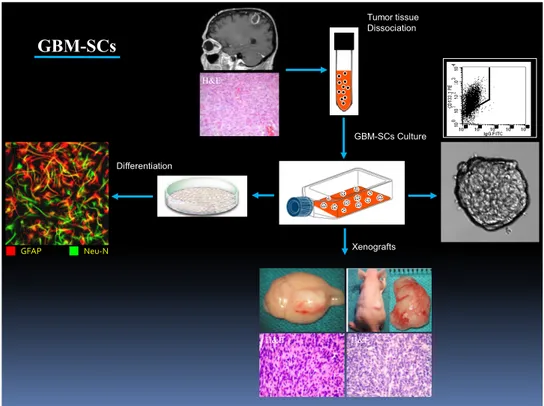
In our laboratory, we have set up a procedure for the isolation of stem cells from glioblastoma specimens. We isolated undiffrentiated GBM-stem cells (GBM-SCs) from surgical specimens through mechanical dissociation of the tumor tissue and after several passages in a serum free medium supplemented with epidermal growth factor (EGF) and basic fibroblast growth factor (bFGF). Isolated GBM-SCs were expanded and characterized both in vitro and in vivo. We characterize the pool of GBM-SCs obtained, for the expression of stem cell markers, especially
the transmembrane glycoprotein CD133/Prominin and for the presence of genetic alterations
typical of GBM. Normal and malignant primitive neural cells express the transmembrane glycoprotein CD133, whose expression increases considerably in neural tumor tissues (Singh.,et al., 2003 and 2004 ). Previous reports suggested that tumorigenic cells in GBM are
confined into the CD133+ population (Singh.,et al., 2003 and 2004). These initial findings have
been revisited in light of
recent studies showing that CD133 cells isolated from human and mouse gliomas are tumorigenic (Lochhead., et al 2008 and Wiesner., et al 2008). However, tumor xenografts
generated in immunocompromised mice by CD133+ cells showed higher resistance to radiation
and chemotherapy, suggesting that CD133+ cells could be a more aggressive tumorigenic
population (Zeng., et al 2006 and McLendon., et al 2006). The complexity of the stem cell
compartment in glial tumors is confirmed by the demonstration that CD133+ cells isolated from
human glioma coexpress the glial fibrillary acid protein (GFAP), a marker for differentiated glial cells (Phillips., et al 2008). Although the stem cell compartment of GBM may be not entirely defined by CD133 expression, Zeppernick et al. (2008) have shown that both the
proportion of CD133+ cells and their topological organization in clusters were significant
prognostic factors for glioma patients, thus providing clinical support to the claim that these
14 a.a. 2009/2011
We also characterize the GBM-SCs for their specific multilineage differentiation capacity in a matrigel plus stem cells medium without growth factors or in serum medium: under these conditions they are able to generate a progeny of neural lineages.
The tumorigenic properties of GBM-SCs are confirmed in vivo by intracranical or subcutaneous cell injection in immunocompromised mice. GBM-SCs were able to generate a tumor identical to the human tumor in terms of antigen expression and histological tissue organization.
Altogether, these features of GBM-SCs indicate that they may provide a riliable in vitro and in
vivo model for studying GBM response to treatments and for to identify specific transcripts
enriched in GBM-SCs (Figure 4). Tumor tissue Dissociation GBM-SCs Culture Xenografts Differentiation GFAP Neu-N MRI H&E H&E H&E IF GBM-SCs R3 C D 133
Figure 4. Schematic representation of isolation and characterization of GBM-SCs.
Expression profiling of microRNAs in GBM-SCs
We propose to identify therapeutic agents that efficiently kill GBM-SCs and we believe that this might lead to more effective treatments for the prevention of GBM relapse. For this purpose, we analyzed the expression profiling of microRNAs (miRNAs) in GBM samples in
15 a.a. 2009/2011
order to identify those with potential importance in tumor biology. MiRNAs are small noncoding regulatory RNA molecules, with profound effects on a wide array of biological processes (Lee RC.;2004). After the discovery of the first miRNA in the roundworm Caenorhabditis elegans, these short regulatory RNAs have been found to be an abundant class of RNAs in plants, animals, and DNA viruses. MiRNAs are evolutionarily conserved, endogenous, small (19-25nt) non-coding single-stranded RNA molecules that negatively regulate gene expression in a sequence-specific manner. The human genome is predicted to encode as many as 1000 miRNAs, accounting for approximately 3% of the total number of human genes. The 5’ portion of miRNA sequence containing bases two to eight, termed the “seed” region, is important in target messenger RNA (mRNA) recognition. MiRNAs negatively regulate target gene expression through complementarity between the miRNA seed sequence and the target mRNA 3’ untraslated region (UTR). MiRNAs that bind with perfect complementarity to the protein encoding mRNA target the mRNA for destruction, whereas miRNAs with imperfect complementarity to the 3’ UTR of the mRNA target, repress mRNA translation. Expression of approximately 30% of human proteins appears to be regulated by miRNAs. Through interactions with 3’ UTR, miRNAs can modulate the expression of many genes simultaneously, often regulating individual signalling pathways at multiple levels.
MiRNAs are encoded by genes that are presumably transcribed into single or clustered miRNA precursors (pri-miRNAs) by RNA polymerase II or, in some cases, by RNA polymerase III and are converted in ~80 nucleotide pre-miRNA hairpin transcripts. The pre-miRNAs are processed to produce mature miRNAs that are incorpored in a ribonucleoprotein complex called the RNA-induced silencing complex (RISC). The core component of RISC is a member of Argonaute (Ago) subfamily proteins, of which there are four paralogs (Ago 1-4) in humans. RISC assembly follows a multi-step pathway. MiRNAs act by guiding the RISC complex to the target mRNA and direct RISC to down-regulate gene expression by mRNA cleavage or translational repression, depending on the specific RISC complex they assemble and the degree of complementary between the miRNAs and their mRNA targets. In humans, miRNAs mainly inhibit protein traslation of their target genes and only infrequently cause degradation or cleavage of the messenger RNA.
The biological role and in vivo functions of most mammalian miRNAs are still poorly understood.
16 a.a. 2009/2011
In invertebrates, miRNAs regulate developmental timing, neuronal differentiation, cell proliferation, growth control, and programmed cell death (Johnston, Hobert., 2003 and Ambros et al., 1993). In mammals, miRNAs have been found to play a role in embryogensis and stem cell maintenance (Hannon et al., 2003), hematopoietic cell differentiation (Bartel et al 2004 ), and brain development (Miska et al .,2005 and Horvitz et al., 2004). MiRNA expression has been found to be deregulated in wide range of human diseases including cancer. However, it remains uncertain whether altered miRNA expression is a cause or consequence of pathological processes. The underlying mechanisms of why and how miRNAs become deregulated are largely unknown. Although bioinformatics approches can predict thousands of genes that are potentially targeted and regulated by miRNAs based on sequence complementary , only very few miRNA target genes have been functionally validated.
MicroRNAs and cancer
MicroRNAs have been recently demonstrated to play an important role in tumorigenesis.
Three important observations early in the history of miRNAs suggested a potential role in human cancer. Firstly, the earliest miRNAs discovered in the roundworm C. Elegans and the fruit fly Drosophila were hown to control cell proliferation and apoptosis. Their deregulation may therefore contribute to proliferative diseases such as cancer. Secondly, when human miRNAs were discovered, it was noticed that many miRNA genes were located at fragile sites in the genome or regions that are commonly amplified or deleted in human cancer. Thirdly, malignant tumors and tumor cell lines were found to have widespread deregulated miRNA expression compared to normal tissue (Lu, et al., 2005). The question remained whether the altered miRNA expression observed in cancer is a cause or consequence of malignant trasformation.
Several studies have shown that miRNAs could represent ideal therapeutic targets because of their involvement in biological processes such as development, cell differentiation, cell
proliferation and cell death, all processes that are aberrant in cancer. The importance of
miRNAs in cancer is highlighted by the observation that ~50% of miRNA genes are located in cancer associated genomic regions or fragile sites (Calin, 2004) which are frequently amplified
or deleted in tumorigenesis. Moreover abnormal expression of miRNA has been linked with
17 a.a. 2009/2011
During, the last decade, a unique set of cancer regulator miRNAs have emerged and these are divided into oncomiRs and anti-oncomiRs.
Up-regulated miRNAs may function as oncogenes by targeting and decreasing the expression
of tumor-suppressorgenes, while down-regulated miRNAs may function as tumorsuppressors,
impacting tumorigenesis by increasing the expression of oncogenes (Chen, 2005).
One example of miRNA with a tumorsuppressor function is miR-7. MiR-7 expression is frequently found decreased in GBM, while over-expression reduces cell proliferation, survival and invasiveness in cultured glioma cells (Kefas et al., 2008). The list of miR-7 confirmed targets include the epidermal growth factor receptor (EGFR) that play a major role in GBM tumorigenesis.
In contrast, miR-21 is almost invariably over-expressed in The list of miR-7 confirmed targetsinclude the epidermal growth factor receptor (EGFR) that play a major role in GBM tumorigenesis.
and a number of other tumor types (Calin and Croce, 2006), resulting in enhanced cell
motility, migration and decreased apoptosis (Zhu et al., 2008; Gabriely et al., 2008). Growing
evidences support the concept that miRNAs regulate oncogenes implicated in brain tumor
formation. Godlewski and colleagues (2008) found that miR-128 levels were downregulated in glioma cells compared with normal brain tissue. They reported that increasing miR-128 expression leds to a decrease in the expression of the oncogene Bmi-1. Overexpression of miR-128 in glioma neurosphere cultures specifically blocks glioma self-renewal consistent with
Bmi-1 downregulation. Silber and colleagues (2008) were the first to discover that miR-124 and
miR-137 are downregulated in high-grade gliomas compared with normal controls. These
miRNAs are also upregulated during adult neural stem cell differentiation.The upregulation of
miR-124 and miR-137 in tumor stem cell populations promotes neuronal differentiation of the
tumor stem cells and inhibits their proliferation by inducing G0/G1 cell-cycle arrest. Gal and
colleagues (2008) examined GBM stem (CD133-positive) and nonstem (CD133-negative) cells and found that miR-451, miR -486, and miR -425 were significantly upregulated in CD133-negative cells compared to CD133-positive cells. Transfection of GBM cells with these miRNAs inhibited neurosphere formation, and transfection with miR-451 resulted in
neurosphere dispersion and inhibited GBM growth. MiRNAs have recently been shown to
function as bona fide tumor suppressors. Shi et al.(2008) reported on downregulated miR-181a and miR-181b involved in glioma formation. Their study showed that these miRNAs
18 a.a. 2009/2011
functioned as tumor suppressors. Transfection of these miRNAs into GBM cells inhibited proliferation in vitro, resulted in loss of anchorage-independent growth, induced apoptosis in
glioma cell lines, and depressed the invasion of glioma cells in vitro.Although the investigation
of miRNAs in brain tumors is still in its infancy, there is strong evidence mounting that miRNAs are integrally involved in brain tumor development and progression.
For these reasons , in the present project, we have planned to define the subset of miR genes that is aberrantly expressed in our GBM-SC lines when compared to normal neural stem cell lines. In a panel of hundreds of miR genes, we have identified miR-135b whose expression resulted downregulated in GBM-SCs when compared to neural stem cells. Functional evaluation of the dysregulated miR-135b has been performed by restoring its normal expression level in GBM-SCs using the inducible vector PTRIP-Zred. We studied the role of miR-135b in GBM-SCs and we found that miR-135b might exert a Tumor Suppressor function (TsmiR).
Cancer stem cells therapeutic implication
The most important therapeutic treatment for GBM is surgery. This procedure based on the premise that, although surgery is not a curative procedure, a major resection provides for a longer survival and better quality of life. Radiotherapy increases the duration of survival , but again is not a curative intervention. In the last 40 years, several clinical trials have examined the role of adjuvant chemoterapy in improving the survival of brain tumor patients. Chemotherapeutic agents have been administrated before (neo-adjuvant), during (concomitant) or after (adjuvant) radiotherapy. The additions of temozolomide to radiotherapy , resulting in a survival benefit with minimal additional toxicity., has became the standard treatment for newly diagnosed GBM.
CSC ability to maintain multipotency and tumorigenicity and their ability to faithfully reproduce the parental tumor in mice models of xenotransplantation, makes them an excellent model to study tumorigenesis and to evaluate the effectiveness of new cancer therapies. The development of new targeted therapy strategies will require a better CSC characterization in terms of their genomic and proteomic characteristics. Recent advances in cancer research have led to a better understanding of the molecular biology of cancer and the mechanisms that enable cancer cells to proliferate and survive. Target therapies for cancer refer to the use of drugs that preferentially target and inhibit specific molecular pathaways that allow cancer cells to continue to grow out of control and spread. Examples of targeted drug therapies for GBM
19 a.a. 2009/2011
that are currently being evaluated in clinical trials include: tyrosine kinase inibitors, these drugs target a growth factor called EGFR that plays an important role in the growth and proliferation of GBM, angiogenesis inhibitors, these drug are designed to inhibit one or more of the growth factors that promote the formation of new blood vessels that provide essential nutrients for tumor cells and inhibitors of mTOR, the mammalian target of rapamycin that act as a central regulator of cell proliferation , angiogenesis and cell metabolism. There is accumulating evidence that the specific inhibition of molecules involved in proliferation and survival of
cancer cells could lead to effective antitumour therapies.Phosphorylation, in particular, plays a
major role in the regulation of signal transduction pathways that control proliferation, survival and cell death processes.
Reverse Phase Protein Array and drug screening
Post-translational modifications, such as phosphorylation, drive most of the cellular signal cascades and it has been shown that blockade of specific kinase activities is able to induce apoptosis in cancer cells. The analysis of the phosphorylation status of various proteins involved in survival/proliferation could eventually lead to the identification of new therapeutic targets. We have analyzed the activation of survival pathways associated to cancer and possibly contributing to GBM-SCs chemoresistance by the high throughput semi-quantitative technique, Reverse Phase Phosphoproteomic Array (RPPA) approach. RPPA represents a novel approach
designed to conduct large-scale phosphoproteomic quantitative analysis. (Spurrier et al., 2008
and Ramalingam, and Nishizuka et al., 2008). This technology is a larger scale extension of western or dot blotting. Nano-amounts of protein lysates or laser capture microdissected biological sections are automatically spotted on nitrocellulose coated slides and then proteins of interest are detected by using specific antibodies. The high detection sensitivity permits to print on each spot less than one microgram of material, much less than that required in a Western blotting experiment. In addition this technology allows users to analyze hundreds of samples simultaneously on a single slide in a relatively short time. RPPA great potential lies in the possibility of molecularly characterize a large number of tumor samples, allowing the identification of prognostic/diagnostic factors as well as potential targets for novel therapies. RPPA has allowed us to obtain high content information about intracellular signaling networks and to define activated pathways in GBM samples from a large number of patients. We have
20 a.a. 2009/2011
analyzed the expression and phosphorylation level of several proteins involved in signalling and cell physiology pathways that are abnormal in GBM and activate a cascade of intracellular events leading to cell proliferation, inhibition of apoptosis, angiogenesis, invasion and cytoskeletal rearrangement, such as EGFR-VEGFR, PI3K/Akt and Ras pathways.
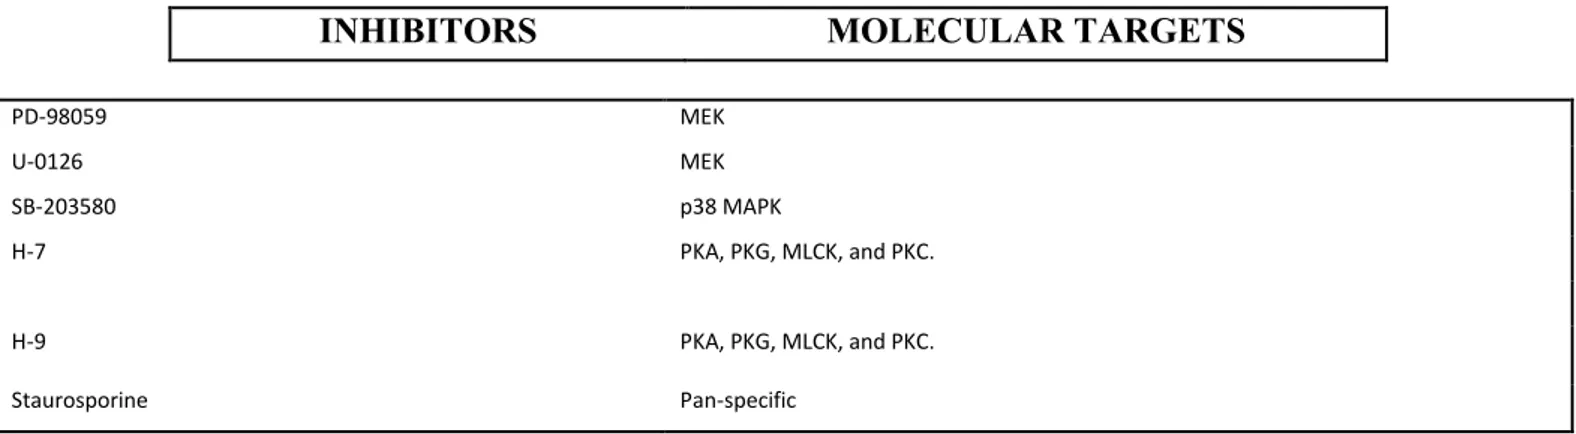
We have treated GBM-SCs with 80 specific kinase inhibitors of those survival pathways in order to identify molecular mechanisms whose inhibition could overcome chemoresistance of these cells.
A synthetic derivative of staurosporine with antineoplastic activity, named UCN-01 or 7-hydroxystaurosporine, exerts a cytotoxic effect on the majority of our GBM-SC lines and it shows potent in vivo activity against a broad range of tumor types .
UCN-01
Seven-hydroxystaurosporine (UCN-01) is a derivative of the nonselective protein kinase inhibitor staurosporine that exhibits significant selectivity for protein kinase C (PKC) in comparison to a variety of other intracellular kinases and appears to be well tolerated in vivo at
concentrations sufficient to achieve effective inhibition of PKC (Figg., et al 2005). UCN-01
was originally identified as a potent (<100 nmol/L) inhibitor of calcium-dependent protein kinase C (PKC)-α, -β, and -γ isoforms. It has also been described for, UCN-01 an antiproliferative activity in several human tumor cell lines ( Akinaga et al., 1991; Seynaeve et al.,1993). Subsequent studies revealed that it also potently inhibits the DNA damage response regulatory kinases chk1(protein kinase that regulates the G2 checkpoint) (Ic50= 5-11nM) possibly chk2 (Ic50>1000nM ) (Sarkaria., et al 2000.; Pommier Yet al 2002.; Schwarz., et al 2000) and phosphatidylinositide-dependent kinase 1 (PDK1) (Sato., Fujita ., Tsuruo ., 2002 ). Several studies suggest that UCN-01 is not only able to abrogate the G2 checkpoint induced by DNA-damaging agents but also, in same circumstances, UCN-01 is able to abrogate the DNA damage-induced S phase checkpoint (Bunch and Eastman,1997; Shao et al., 1997). Another interesting property of UCN-01 is its abitity to arrest cells in the G1 phase of the cell cycle. Several study in human epidermoid carcinoma or lung carcinoma have demonstrated that after incubation with UCN-01, these cells were arrested in G1 phase with Rb hypophosphosphorylation and p21/p27 accumulation (Akiyama et al., 1997). Chen et al (1999) suggest that Rb, but not p53, function is essential for UCN-01- mediated G1 arrest, but the exact role of Rb or p53 in the G1 arrest induced by UCN-01 is still unknown. In summary,
21 a.a. 2009/2011
three different effects has been described for UCN-01 on tumor cells: (1) cell cycle arrest (This agent arrests tumor cells in the G1/S transition of the cell cycle and preventions of nucleotide excision repair by inhibition of chk1); (2) induction of apoptosis and (3) sensitization to DNA-damaging agents. Moreover, it has been demonstrated that UCN-01 is able to inhibit invasion and migration of human glioma cells (Fan., et al 2005) and to increase Temozolomide efficacy in both p53 wild-type and p53 mutant glioma cells (Pieper., et al 2001). UCN-01 inhibits cell growth in several in vitro and in vivo human tumor preclinical models. Several lines of evidence suggest that UCN-01 shows antitumor activity and might be a novel anticancer drug, which regulates the cell cycle of tumor cells. Therefore, phase I studies of UCN-01 as a single agent or as a modulator of several standard anticancer drugs have been conducted in the United States and Japan (Sausville et al, personal communication, 2002). UCN-01 showed unusual pharmacokinetic features in patients with cancer, which could be explained, at least in part, by the extremely high affinity with human alpha-1 acid glycoprotein
(AAG). On the basis of these results, we propose the use of UCN-01 as a possible therapeutic
strategy against GBM-SCs.
Methods
Glioblastoma stem cells isolation and culture.
Glioblastoma tissue specimens were obtained from adult patients undergoing craniotomy at the Institute of Neurosurgery, Catholic University School of Medicine in Rome. Glioblastoma stem cells were isolated through mechanical dissociation of the tumor tissue and grown as semiadherent neurospheres in a serum-free medium supplemented with epidermal growth factor (EGF) and basic fibroblast growth factor (bFGF) as previously described. Isolated cells were expanded and characterized both in vitro and in vivo for their stem-cell properties according to the following criteria: (1) ability to grow in clusters and maintain an undifferentiated state, as indicated by morphology and expression of stem-cell markers such as CD133, SOX2, musashi and nestin; (2) ability to differentiate under serum stimulation both into GFAP-positive astrocyte-like cells and into neurofilament expressing neuron-like cells; (4) generation of glial tumors upon orthotopic (intracerebral) transplantation in immunodeficient mice; (5) maintenance of chromosomal aberrations of the parental tumor.
22 a.a. 2009/2011
Lentiviral Vectors
We used the pTRIPZ vector which has been engineered by Open Biosystems to be a Tet-On vector. The Tet-On® technology equips the pTRIPZ vector to provide for induced expression of a shRNAmir in the presence of doxycycline (www.clontech.com). For pTRIPZ-Red135b generation (TPZred), miR-135b precursor DNA was amplified from human genomic DNA. We subcloned the amplified fragment spanning 650 bp into the lentiviral vector pTRIPZred under the control of the cytomegalovirus promoter (CMV). The primers used for amplification of pri-mir-135b are: CGGTCTAGACCATTGTGTGAGGCCTTT (Fw) and
CCCGATATCACCCCCCAAATCT (Rv). PCR was performed under the following
conditions: initial denaturation for 2 minutes at 94 oC, 35 cycles of denaturation for 15 second
at 94 oC, annealing for 30 second at 56 oC, extension for 1minute and 30 second at 68 oC and 10
minutes at 68 oC for final extension. Then, the PCR products were determined by 1% agarose
gel electrophoresis. For Tet-On inducible system pTRIPZ red vector act as responders to rtTA by inserting, in a lentiviral backbone, a tetracycline response element (TRE) upstream of a minimal promoter driving the transcription of Red Fluorescense Proteins RFP or RFP/mir-135b
respectively. TRE consists of seven repeats of tet operator (tetO).
Glioblastoma stem cells lentiviral infection
Lentiviral particles were produced by calcium phosphate transfection protocol in 293T
packaging cell line. The day before transfection 293T cells were plated at density of.. 1.2x10⁶
cells in a T75 cell culture flask. Cells were transfected with 20 µg of lentiviral vector, 13 µg of packaging vector (pPAX) and 7 µg of vescicular stomatitis virus protein G vector (pMD2G).
CaCl2 (125 mM) and HBS (2XHBS: NaCl 280 mM, KCl 10 mM, Na2HPO4 1.5 mM,
D(+)glucosio 12 mM, HEPES 50 mM, pH 7.1) were included in transfection mix to promote calcium phosphate/DNA precipitates formation. 12 hours post-transfection culture medium, full of calcium phosphate precipitates, was replaced with fresh growth medium. 48 hours post-transfection, viral supernatant were filtered with 0.45 µm filter and used for the following GBM-SC samples infection.
For lentivirus infection GBM-SCs were plated as single cells in a 6-well culture plate at 80% of confluence. The day of infection the cells growth medium was replaced with 2 ml of filtered viral supernatant. Polybrene (4 μg/ml) was used to improve infection efficiency. Cell plates
23 a.a. 2009/2011
were first centrifuged for 45 min at 1800 RPM at 37 0C and then were incubated over night at
37 0C. At the end of the infection, the cells were washed extensively and maintained in a
serum-free medium supplemented with growth factors . The transduction efficiency was evaluated by cytofluorimetric analysis.
After lentiviral infection , GBM-SCs were selected by antibiotic resistance to puromycin. Successively infected cells were induced with the tetracycline analog doxycycline and, after two days, RFP-positive cells were flow-sorted and used for functional assay and target analysis. Cells were sorted by BD FACSAria cell sorter according to manufacturer’s from facility instrument technicians. Several stable stem cell lines were developed from independent viral productions/infections and exhibited identical behaviors.
RNA isolation
andReal-Time PCR
Total RNA was extracted with TriZol reagent at different time point (for a period of two weeks post-sorting). Fifty nanograms of RNA were reverse transcribed with M-MLV reverse transcriptase (Invitrogen) or TaqMan reverse transcriptase (Applied Biosystems) and cDNA was diluted 1:10 in the PCR reactions. Housekeeping gene and target gene reverse transcription was performed using oligo-dT primers (Invitrogen), while miRNA specific looped-primer was used for miR-135b reaction.
Relative quantitative Real-Time PCR was performed in a Real-Time Thermocycler (MX 3000, Stratagene) using the Brilliant SYBR Green QPCR Master Mix according to manufacturer’s instructions. All PCR reactions were coupled to melting-curve analysis to confirm the ampli-fication specificity. Non-template controls were included for each primer pair to check for any significant levels of contaminants. Each experiment was performed in duplicate for three times.
MicroRNA analysis for identification of newtarget of GBM-SCs
We used TargetScan (http://genes.mit.edu/targetscan), miRanda (http://www.microrna.org), and PicTar (http://pictar.bio.nyu.edu) for mir-135b target prediction. The targets were confirmed by BLAST alignment with the corresponding NCBI DNA data base for homologies between miRs and their target. Moreover, putative target were selected for their involvement in glioblastoma pathogenesis.
24 a.a. 2009/2011
In vitro Growth Curve
Spheres were mechanically dissociated. Cells were then plated in 96-well plates in triplicate,
and incubated at 37°C in a 5% CO2 incubator. Cells proliferation was monitored by counting
the cell and confirmed by using the CellTiter-Blue Viability Assay (Promega). Experiments were repeated three independent times.
Soft agar colony formation assay
Assays of colony formation in soft agar were done using standard protocols. Briefly, transduced GBM-SCs (500-1000 cells per well) were suspended in 0.35% Noble agar and were plated onto a layer of 0.7% Noble agar in 24-well tissue culture plates (Corning). The agar containing cells was allowed to solidify overnight at 37°C in 5% CO2 humidified atmosphere. Additional medium was overlaid on the agar and the cells allowed growing undisturbed for 2 weeks. Plates were stained with 0.5ml of 0.005% Crystal Violet for 1 hour. Visible colonies were counted with the aid of a microscope. Experiments were repeated three independent times.
In vitro cell migration assay
The motility of transduced GBM-SCs was evaluated in 24-well transwell chambers (Costar), as directed by the manufacturer. Briefly, the lower chambers of the 24-well plate were filled
with 500 μL of stem cell medium containing EGF and FGF2; 1 × 10⁴ cells in 500 μL of the
same medium was placed into the upper compartment of wells. The transwell chambers were incubated at 37°C in 5% CO2 humidified atmosphere for 24 h. The cells that had invaded to the lower surface of the polycarbonate membranes (8 μm pore size) were fixed, stained with Coomassie blue, and quantified by counting five microscopic fields (at ×100 magnification) per filter. Experiments were repeated three independent times.
25 a.a. 2009/2011
Clonogenical assay
Glioblastoma spheres were dissociated by gently pipetting up and down to obtain a single cell suspension. In all, 3 and 10 cells were seeded in each well of 96-well plates in stem cell medium plus doxiciclina. After 3-4 weeks, each well was examined and the number of sphere/well was counted. Experiments were repeated three independent times.
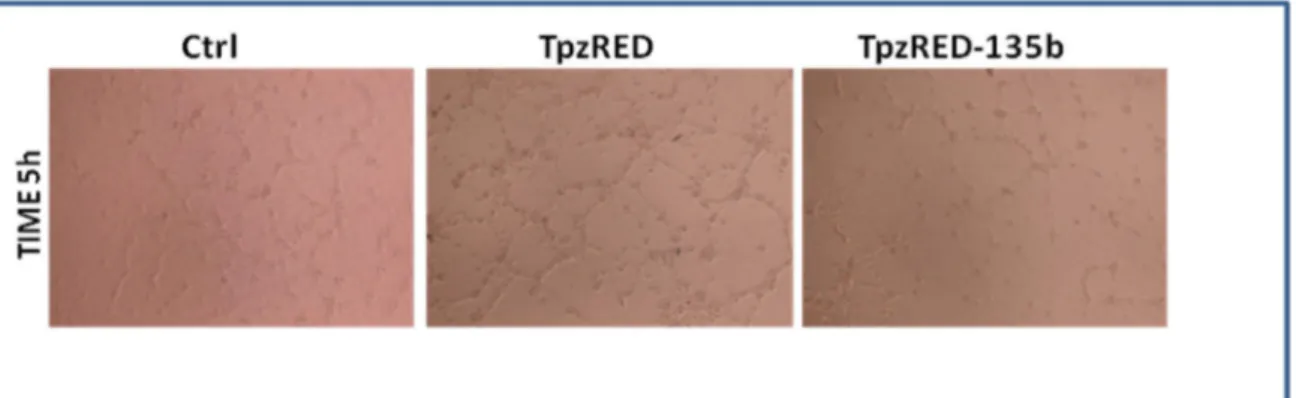
Tube formation assay
The human umbilical vein endothelial cells (HUVECs) were seeded on MATRIGEL (BD Biosciences).
HUVECs were suspended in normal medium and in the conditioned medium derived from TPZred-135b infected cells with respect to the control cells. After several time, images of the cells were taken using an Electron microscope.
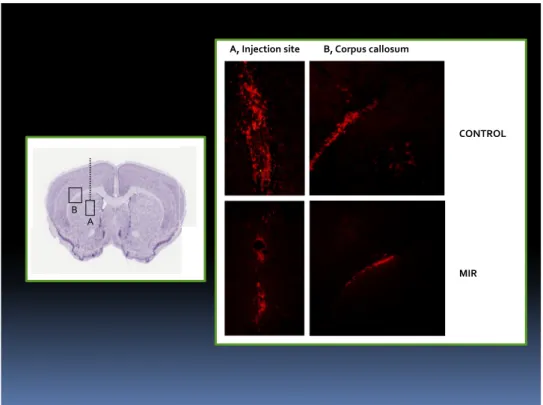
Tumor formation in vivo
The effects of miR-135b on in vivo tumor growth were tested in an intracranial glioma
xenograft model. Infected GBM-SCs (5x10⁵) were implanted intracranically into
immunodeficent mice (n=6). The animals were sacrificed after 3 week of tumor implantation. The brains were removed,sectioned, and stained.
Phosphoproteomic analysis
A RPPA (Reverse Phase Protein Array) module consists of a solid support that can quantify proteins of interest previously immobilized onto nitrocellulose coated slides through the use of specific antibodies. Sample proteins immobilization was obtained through the use of an "Arrayer" tool that deposit (printing) microspot (about 30 nanoliters of sample) onto nitrocellulose slides. The immunostaining procedure, (staining) is automatically performed by an Autostainer. A portion of the printed slides are processed to detect the amount of total protein (used to normalize the antibody signal) by a fluorescence method. Once generated,
26 a.a. 2009/2011
signal, is detected by a high resolution scanner. The images obtained are analyzed by a software that can automatically identify the spots and quantify their relative intensity.
Printing
This procedure is performed by an Aushon 2470 Arrayer that takes advantage from a 20 "pin" head (5x4) that permits samples spotting onto nitrocellulose coated slides. Samples are diluted 1:2 with print loading buffer (Tris-glycine 2x SDS, Invitrogen) containing 2.5% β-mercaptoethanol (Sigma-Aldrich). After being heated at 100°C for 5 minutes and loaded in four different dilutions (1:1, 1:2, 1:4 and 1:8) on a 384-well plate (Genetix), samples are then spotted on the appropriate slide (FAST slides, Whatman, Fisher) by the instrument. Protein concentration is one of the most important parameter, in fact, too small amounts of protein per-spot can give rise to false negative results, while to high amounts can cause signal saturation.
Protein quantification
All protein signals were normalized on the basis of total protein values. This parameter has been estimated by SYPRO Ruby Protein Blot Stain (Invitrogen). After slides printing some of them were selected for total protein determination as described below:
• Fixing solution incubation (7% acetic acid and 10%methanol).
• Washes (water) and SYPRO Ruby Blot Stain incubation for 30 minutes. • One minute wash.
Slides are then dried at room temperature and then scanned with a fluorescence scanner (Vidar Systems Comporation, Revolution 4550).
Staining
Staining was performed using the TSA and DAB (Tyramide Signal Amplification, Diaminobenzidine, DAKO, Denmark) system of signal amplification. In this procedure, a primary antibody is detected with a biotinylated secondary antibody. This process allows a significant signal amplification useful for the detection of femtomolar antigen amount. Before the immunostaining, slides are incubated for 15 minutes with a stripping solution (Reblot mild antibody stripping solution, Chemicon) to promote antigenic sites exposure. After two PBS washes slides are treated for two hours with PBS containing powder I-block 0.2% (Applied
27 a.a. 2009/2011
Biosystems/Tropix) and Tween-20 0.1%, in order to saturate nitrocellulose a specific binding sites. Before primary antibody staining, slides are subjected to a streptavidin pretreatment in order to saturate endogenous biotin eventually present in the sample. The entire staining procedure is automatically carried out using a DAKO Autostainer.
Data analysis
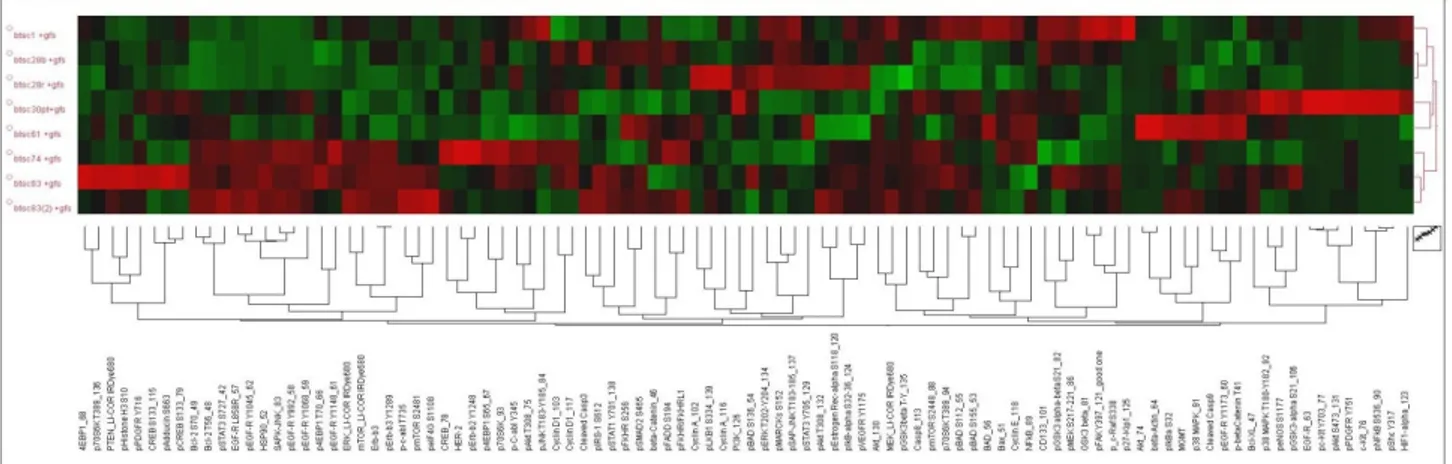
After staining, slides are scanned with a flatbed scanner (UMAX PowerLook, UMAX, Dallas, TX) at a 1800 dpi resolution and saved as *.TIFF image file using Photoshop 6.0 (Adobe , San Jose, CA). Images are then analyzed with the MicroVigene software 2.9.9.9 (Vigen Tech, North Bedford, MA).
Expression levels of each protein in the GBM-SC lines were "standardized" as follows: (xn-μ)/σ, where xn represents the intensity of the single protein in the sample n, μ is the mean value and σ the standard deviation of the individual proteins intensity calculated for all samples analyzed. In this way data are represented as relative expression values between the several lines in a range between -1.5 and 1.5 standard deviations. Data hierarchical clustering was performed through the T-MEV (http://www.tm4.org) open-source program.
28 a.a. 2009/2011
29 a.a. 2009/2011
Kinase inhibitors library in vitro screening
For in vitro screening experiments GBM spheroids were subjected to mecchanicaly dissociation .After being counted with Trypan Blue dye in a Burker chamber to exclude death cells, 2000 cells per well were plated onto 96-well microplates in 80 µL of culture medium. Each different treatment were performed 24 hours after plating by adding 20 µL of culture medium.
Inhibitors included in the Biomol Library (Enzo Life Sciences/Biomol http://www.enzolifesciences.com/BmL -2832/kinase-inhibitor-library) were initially tested at a 5µΜ concentration. All inhibitors were resuspended in DMSO (dimethyl sulfoxide, Sigma-Aldrich Inc., Saint Louis, MO). Some samples were therefore treated with DMSO 0.1% as a vehicle control. Staurosporine was used as positive control.
Positive hits titration and combination with chemotherapeutics or commercially available inhibitors
Compounds that resulted effective in the first screening were then titrated using scalar concentrations (5µM , 2,5µM, 1,25 µM, 0,6µM, 0,3µM, 0,15 µM, 0,07 µM, 0,03 µM), in addition to the vehicle control (0.1% DMSO).
Again, selected compounds were tested in vitro in combination with conventional chemotherapeutic agent temozolomide (Sigma-Aldrich Inc.) at 500µM, 250µM and 125µM concentrations. In the same experiment, cells were treated individually and in combination with commercially available inhibitors. DMSO 0.1% was used as a vehicle control. UCN-01 (Sigma-Aldrich Inc.) dose-response treatment was conducted for the fourtheen lines of GBM-SCs at 10 μM, 5 μM , 1,25 μM, 0,6 μM, 0,3μM, 0,15 μM, 0,07μM and 0,03μM. DMSO 0.1% was used as a vehicle control.
Viability assay
In vitro viability was assayed measuring cellular ATP content by luminometry. To this end we
30 a.a. 2009/2011
manufacturer instructions. This method takes advantage of cells ATP content to convert luciferin, the substrate of the enzyme luciferase, in an unstable compound. Before undergoing spontaneous oxidation the compound is able to emit photons in the 510-650 nm range of wavelength.
Viability was tested at different times of treatment. The intensity of the luminescence, proportional to cell viability, was measured by Victor 2™ (Wallac, Perkin Elmer Inc., Norwalk, CT) microplate reader. Vehicle control (DMSO 0.1%) luminescence values were averaged and arbitrarily set to 100%. The absolute values of luminescence for each treatment were then normalized with respect to vehicle control and then expressed as a percentage.
Tunel assay
Following procedure of a Roche protocol (Version 2, October 2001) for use with paraffin embedded sections, paraformaldehyde fixed material. Use at least two control
and two test sections per slide (two groups – they should not be too close, that the reagents don’t
mix during the reaction). We examine sections under the microscope with dark field illumination
before starting the experiment to choose sections you want to use for TUNEL staining (better looking sections) and for control sections. Tunel assay was performed on cells fixed in 4%
paraformaldehyde-PBS at 20 min RT. Permeabilization of cells with 0,1% Triton-100 and
incubate 5 minutes at room temperature. Washing cell in PBS and prepare the Tunel cocktail:
-40 μl of Labeling solution for one control
-180 μl of Labeling solution in a new eppendorf tube, plus 20 μl of Enzyme solution.
Mix thoroughly, but take care not to create many bubbles (vortex on medium, then spin down briefly). We added 50 μl of TUNEL cocktail on test sections, we put 40 μl of Labeling solution to control sections on one slide, we put PBS on the control sections on other slides.
Cover with parafilm pieces. Incubate in humidified chamber for 60 min. at 37ºC in dark (cover water bath with aluminum foil). Remove parafilm coverslips off the sections by pipeting PBS around the edge of parafilm until it floats, then lift it with tweezers. Wash 3 times in PBS for 3
minutes . Add DAPI staining as a final step for 60 min. at 37ºC in dark. Drain excess solution
31 a.a. 2009/2011
lower the coverslip on sections. Let stand in dark for few minutes. We then observed DAPI stain with UV excitation, and observed TUNEL signal with Death Detection kit, Fluorescein, following the manufacture's instructions ( Roche)
Western blotting
To determine, phospho-Akt (S473) (Cell Signaling), phospho-PKCα/βII (T638/641) (Cell Signaling), phospho-PDK1 (S241) (Cell Signaling) and phospho-cdc25 (Cell Signaling) expression levels, GBM spheroids were subjected to mechanical dissociation, after being
counted 5x10⁵ cells were plated 6-well in 2 mL of culture medium. Samples were subsequently
treated with 0.1% DMSO (Sigma-Aldrich), UCN-01 (Sigma-Aldrich) 1 μM.. Protein lysates were prepared by resuspending cells in a T-PER lysis buffer (Pierce) with 300 mM NaCl and Protease Inhibitor Cocktail and Phosphatase Inhibitor Cocktails I and II (Sigma-Aldrich) according to manufacturer instruction. After a 30 minutes of-ice incubation, cells were centrifuged for 10 minutes at 13000 RPM at +4°C. The recovered supernatant was then directly used for Western blotting experiments or stored at 80°C.
Protein concentration has been assessed using Bradford protein assay (Bio-Rad Laboratories, Richmond, CA), which is based on Coomassie Blue G-250 dye ability to change its maximum absorption wavelength from 465 nm to 595 nm in response to protein binding.
Proteins were subjected to electrophoresis on acrylamide gel containing SDS (Sodium Dodecyl Sulfate). NuPage Novex Bis-Tris gel 1.0 mm x 15 well 4-12% (Gibco Invitrogen Inc) were used. An equivalent of 20 μg of protein, supplemented with loading buffer NuPage LDS sample buffer (25mM Tris-HCl, pH 6.8, SDS 10%, 50% glycerol, 5% β-mercaptoethanol, 0.01% bromophenol blue, (Gibco Invitrogen Inc.) was incubated at 95°C for 3 minutes and loaded. SeeBlue Plus 2 (Gibco Invitrogen Inc.) was used as molecular weight marker. Electrophoresis were performed in MOPS (3-[N-morpholino]-propansulfonico) buffer at 120 V for about 2 hours.
32 a.a. 2009/2011
Intracranial implantation of glioblastoma neurosphere cells (GBM-SCs).
Experiments involving animals were approved by the Ethical Committee of the Catholic
University School of Medicine, Rome. NOD-SCID mice (4–6 weeks of age; CD1 NOD-SCID mice, Charles Rives, Italy) were implanted intracranially with 2 x 10⁵ green fluorescence protein (GFP)-expressing GBM-SCs resuspended in 5 µl of serum-free medium containing 1 uM of UCN-01. Control mice were injected with equal number of GBM-SCs suspended in 5 µl of serum-free medium without adding UCN-01. For grafting, the mice were anesthetized with intraperitoneal injection of diazepam (2 mg/100 g) followed by intramuscular injection of ketamine (4 mg/100 g). The animal skulls were immobilized in a stereotactic head frame and a burr hole was made 2 mm right of the midline and 1 mm anterior to the coronal suture. The tip of a 10- µl Hamilton microsyringe was placed at a depth of 3.5 mm from the dura and the cells were slowly injected. After 8 weeks of survival, the mice were deeply anesthetized and transcardially perfused with 0.1 M PBS (pH 7.4), followed by 4% paraformaldehyde in 0.1 M PBS. The brain was removed, stored in 30% sucrose buffer overnight at 4°C, and serially
cryotomed at 20 µm on the coronal plane. Sections were collected in distilled water, mounted
on slides, and cover-slipped with Eukitt. Images were obtained with a Laser Scanning Confocal Microscope (IX81, Olympus Inc, Melville, NY).
33 a.a. 2009/2011
Histological assessment of tumor xenografts.
The cranio-caudal extension of the brain area invaded by GFP-expressing GBM-SCs was
assessed on serial coronal sections. Then, histological sections 120 mm apart were digitized;
on each image, the brain region containing GFP+ cells was demarcated with the cursor and its
area calculated by using commercially available software. To assess the tumor volume, each
area of infiltrated brain was multiplied for the distance to the consecutive digitized section starting from the tumor epicentre to the cranial and caudal poles of the tumor, and partial
volume values were added. The density of tumor cells was assessed by counting the number
of GFP-positive GBM-SCs in 10 non-superimposing high power fields across the grafted striatum. Alternate sections were stained with hematoxylin and eosin (H&E) for morphological analysis.
Statistical analysis.
All statistical analyses were conducted using GraphPad Prism 4 program (GraphPad Software Inc., www.graphpad.com). In vitro experiments statistical significance was calculated by
ANOVA test. In vivo experiments the differences in tumor volume and density of GBM-SCs
between the UCN-01 treated group and control group were evaluated using the Student’s t-test. Statistical significance was assigned to p values <0.05.
Results
Expression profiling of miRNAs in GBM-SCs revealed that miR-135b is significantly downregulated
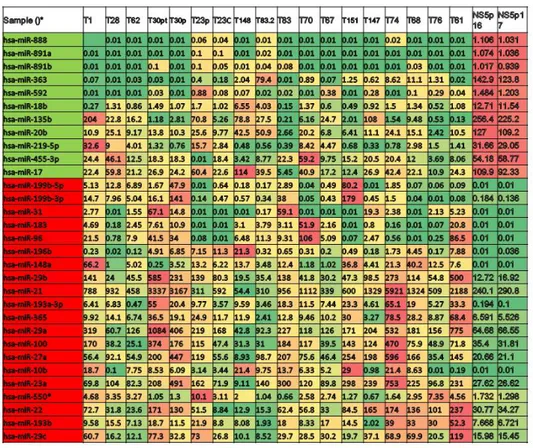
We first studied the expression levels of miRNA in GBM-SC lines in comparison to two neural stem cell lines. Total RNA was extracted from 33 stem cell lines cultured in their standard (serum free) medium and biological replicates were analysed by microarray hybridization (Agilent microarray core facility-University of Ferrara, Italy) in duplicate experiments. MicroRNAs were ranked by relative dysregulation and a cutoff was set living approximately 10% of the total as “significantly dysregulated” miRNA genes for further analyses. More in
34 a.a. 2009/2011
detail, we estimated the absolute level of our miRNAs in tumors and in normal samples based on the assumption that, as miNAs act by stoichometric pairing with target mRNAs, their absolute expression levels are a key factor for inferring their function in a given context. Approximately 10% of the miRNA genes analysed resulted dysregulated by a factor of two or more. Based on our microarray platform, we analysed 40-50 transcripts for absolute quantification. To identify those miRNAs involved in the tumorigenesis of GBM-SCs, we mesasured their expression by a quantitative Real-Time PCR approch. We found that several miRNAs are consistently down-regulated in GBM-SC lines.
Among these, miR-135b resulted one of the most significantly down-regulated miRNA with the most homogeneous profile (Figure 1A).
Figure 1. A) Expression profiling of miRNAs in GBM-SC lines compared to NSC lines. In
green, miRNAs down-regulated, in red miRNAs upregulated. MiR-135b resulted the most down- regulated with the most homogeneous profile.
35 a.a. 2009/2011
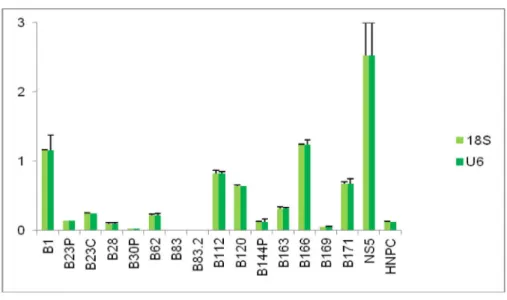
Relative quantification by Real time PCR confirmed the downregulation of miR-135b in GBM-SCs (Figure 1B).
Figure 1. B) Relative miR-135b expression levels in GBM-SCs. Histogram shows
down-regulated levels of miR-135b mRNA .
At this point we decided to investigate miR-135b function in the biology of GBM.
Functional evaluation of the dysregulated miR-135b was performed with a strategy aimed at restoring its normal expression levels in GBM-SCs.
For this purpose, we used a lentiviral inducible system in order to observe the effects of miR-135b soon after its enforced expression, avoiding possible counter selection phenomena. We used the pTRIPZ vector (Figure 2A) which has been engineered by Open Biosystems to be
a Tet-On vector.The Tet-On® technology equips the pTRIPZ vector for induced expression of
a shRNAmir in the presence of doxycycline (www.clontech.com). There are two main components on the pTRIPZ vector enabling induction: the tetracycline response element (TRE) and the transactivator. The TRE, modified from its natural state to consist of a string of operators fused to the CMV minimal promoter, exhibits reduced basal expression and tighter binding to the second component, the transactivator. The pTRIPZ transactivator, known as the reverse tetracycline transactivator 3 (rtTA3), binds to and activates expression from the TRE promoter in the presence of doxycycline.
36 a.a. 2009/2011
The rtTA3 transactivator is a modified version of the wildtype in two ways. First, unlike the original tetracycline transactivator, the rtTA3 is modified to bind to thr TRE in the presence of doxycycline rather than in its absence. Secondly, there are three mutations within the transactivator that increase its sensitivity to doxycycline by 25-fold over the initial rtTA, without increasing background activity (Das, et al. 2004).
GBM-SCs were infected either with the pTRIPZred and with its derivative pTRIPZred-135b vector, where the pri-mir-135b was cloned in the 3’untranslated region of the Red Fluorescent Protein (RFP). After infection, cells were selected with puromycin and then, induced with the tetracycline analog doxycycline and, after four days in culture, RFP‐positive cells were flow‐sorted and used for functional assays (Figure 2B). Overexpression of miR-135b (>500-fold) was confirmed on doxycycline induced GBM-SCs by real-time-PCR one day post-sorting and monitored over 3 weeks (Figure 2C).
A)
B) C)
37 a.a. 2009/2011
Figure 2. A) Schematic description of the pTRIPZ vector which has been engineered by Open
Biosystems B) Facs analysis of flow-sorted GBM-SCs infected with pTRIPZred and pTRIPZred135b vectors 4 days after doxycycline induction C) Relative quantification of miR-135b on infected GBM-SCs.
MiR-135b overexpression inhibits GBM-SCs malignancy
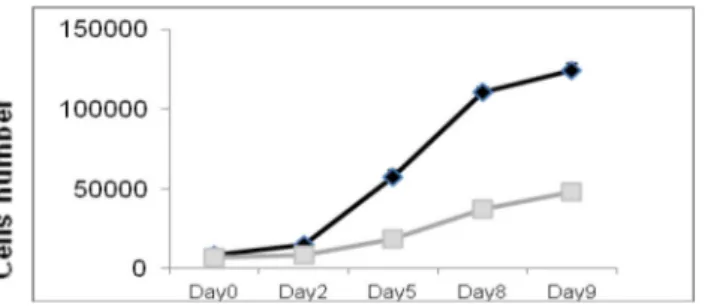
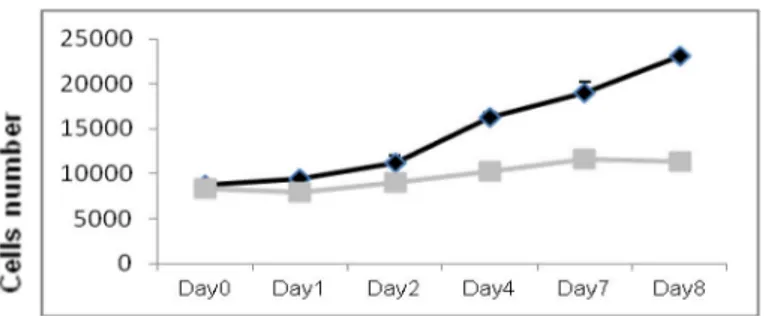
We assessed the effects of miR-135b ovrexpression on GBM-SCs proliferation, migration and colony-forming ability. We performed functional assays on flow-cytometry sorted RFP-positive cells. The proliferation assay showed that pTRIPZred-135b-transduced (pTRIPZred-135b) cells have a significantly reduced growth compared to TRIPZred-transduced cells (pTRIPZred).
MiR-135b overexpression inhibits cell proliferation in GBM-SC lines # 30pt, # 83, and # 1 ( Figure 3).
GBM-SC line # 30 pt
38 a.a. 2009/2011
GBM-SC line # 1
Figure 3. Overexpression of miR-135b significantly reduced the in vitro proliferation of
GBM-SCs. Growth curves of GBM-SCs infected with pTRIPZred (black) and pTRIPZred-135b (grey) vectors.
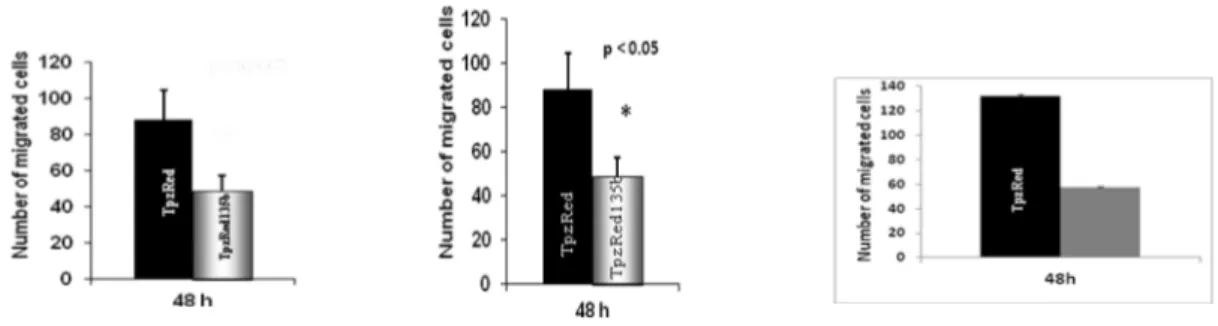
High-grade gliomas exhibit aggressive behavior, which is manifested by rapid cellular migration under specific in vitro culture conditions (Chuang., et al .2004.; Manning and Sontheimer et al ., 1999). Using a standard “transwell chamber” assay where it is possible to count migrating cells through Comassie Blue staining, we found that enhanced expression of miR-135b significantly reduced the migration rate of pTRIPZred-135b cells compared to control pTRIPZred cells ( Figure 4 ).
A) p<0.005