DOI 10.1140/epjc/s10052-014-3053-6 Regular Article - Experimental Physics
Measurement of pseudorapidity distributions of charged particles
in proton–proton collisions at √s = 8 TeV by the CMS
and TOTEM experiments
The CMS and TOTEM Collaborations∗
CERN, 1211 Geneva 23, Switzerland
Received: 4 May 2014 / Accepted: 31 August 2014 / Published online: 29 October 2014
© CERN for the benefit of the CMS and TOTEM collaborations 2014. This article is published with open access at Springerlink.com
Abstract Pseudorapidity (η) distributions of charged
parti-cles produced in proton–proton collisions at a centre-of-mass energy of 8 TeV are measured in the ranges|η| < 2.2 and 5.3 <|η| < 6.4 covered by the CMS and TOTEM detectors, respectively. The data correspond to an integrated luminos-ity of L = 45 µb−1. Measurements are presented for three event categories. The most inclusive category is sensitive to 91–96 % of the total inelastic proton–proton cross section. The other two categories are disjoint subsets of the inclusive sample that are either enhanced or depleted in single diffrac-tive dissociation events. The data are compared to models used to describe high-energy hadronic interactions. None of the models considered provide a consistent description of the measured distributions.
1 Introduction
Measurements of the yields and kinematic distributions of particles produced in proton–proton (pp) collisions at the Large Hadron Collider (LHC) can provide a better under-standing of the mechanisms of hadron production in high-energy hadronic interactions. Two types of processes con-tribute to the production of most of the final-state particles at LHC energies. Semi-hard (multi)parton scattering, with exchanged momenta of a few GeV, is the dominant contribu-tion. Diffractive scattering in more peripheral pp interactions, where one or both protons survive the interaction and/or are excited into a low-mass state, accounts for 15–40 % [1,2] of the pp inelastic cross section. As the particle multiplicity pro-duced in these processes is modelled phenomenologically in the existing Monte Carlo (MC) event generators of hadronic interactions, experimental results provide an important input for tuning of the models.
∗e-mails: [email protected]; [email protected]
The results presented here focus on the charged-particle multiplicity density (dNch/dη, also referred to as the pseu-dorapidity distribution) corrected down to zero transverse momentum ( pT), in the pseudorapidity ranges|η| < 2.2 and 5.3 <|η| < 6.4, where η is defined as − ln[tan(θ/2)], with θ being the polar angle of the particle trajectory with respect to the anticlockwise-beam direction. Inclusive measurements of the η and pTdistributions of charged particles have pre-viously been performed in pp and pp collisions for different centre-of-mass energies and phase space regions [3–14].
In this paper, the data samples were collected with a mini-mum bias trigger generated by at least one arm of the TOTEM T2 telescopes, which also triggered the readout of the Com-pact Muon Solenoid (CMS). Three event samples with dif-ferent final-state topologies are selected offline: a sample of inclusive inelastic pp events, a sample dominated by non-single diffractive dissociation (NSD) events and a sample enriched in single diffractive dissociation (SD) events. The measured data are compared to the predictions of MC event generators that model pp collider data and high-energy cos-mic ray hadronic interactions.
2 Experimental setup
The CMS and TOTEM experiments use a right-handed coor-dinate system, with the origin at the nominal interaction point (IP), the x-axis pointing to the centre of the LHC ring, the y-axis pointing upwards and the z-axis pointing along the anticlockwise-beam direction. The azimuthal angle, φ, is
measured in the (x, y) plane, where φ = 0 is the +x and
φ= π/2 is the +y direction.
A complete description of the CMS detector can be found in Ref. [15]. The central feature of the CMS apparatus is a superconducting solenoid of 6 m internal diameter, providing a uniform magnetic field of 3.8 T parallel to the beam axis. Inside the magnetic field are the pixel tracker, the silicon-strip tracker, the lead tungstate electromagnetic
calorime-ter and the brass/scintillator hadron calorimecalorime-ter. Muons are measured in gas-ionisation detectors embedded in the steel return yoke outside the solenoid. In addition to the barrel
and endcap detectors, which extend up to|η| = 3.0, the
steel/quartz-fibre hadron forward calorimeters (HF) cover the region 2.9 < |η| < 5.2. The tracking detector consists of 1440 silicon pixel and 15 148 silicon strip detector mod-ules. The barrel is composed of 3 pixel and 10 strip layers around the interaction point at radii from 4.4 to 110 cm. The forward and backward endcaps each consist of 2 pixel disks and 12 strip disks in up to 9 rings. Three of the strip rings and four of the barrel strip layers contain an additional plane, with a stereo angle of 100 mrad, to provide a measurement of the r-coordinate and z-coordinate, respectively. The tracker is designed to provide a longitudinal and transverse impact
parameter resolution of about 100 µm and a pT resolution
of about 0.7 % for 1 GeV/c charged particles at η= 0 [16].
The TOTEM experiment [17,18] is composed of three
subdetectors: the Roman pots and the T1 and T2 telescopes. Minimum bias events are triggered by the two T2 telescopes, which are placed symmetrically on each side of the IP at about|z| =14 m. They detect charged particles produced in the polar angular range of≈3–10 mrad (5.3 < |η| < 6.5), with full azimuthal acceptance. Each telescope consists of two half-arms, with each half-arm composed of 10 semicir-cular planes of triple-GEM (gas electron multiplier) cham-bers, arranged within a 40 cm space along the z-axis. Each chamber provides two-dimensional information on the track position covering 192◦in azimuthal angle with a small ver-tical overlap region between chambers of two neighbour-ing half-arms. Every chamber has a double-layered read-out board containing two columns of 256 concentric strips (400 µm pitch, 80 µm width) to measure the radial
coordi-nate and a matrix of 1560 pads, each covering ∆η× ∆φ ≈
0.06× 0.018 rad, to measure the azimuthal coordinate, and for triggering. The radial and azimuthal coordinate resolu-tions are about 110 µm and 1◦, respectively [19]. Local angles of single tracks are reconstructed with an average res-olution of 0.5 mrad, and the track pseudorapidity resres-olution for charged particles is better than 0.05 [20], once the track is identified as coming from the vertex.
The detailed MC simulations of the CMS and TOTEM detectors are based on Geant4 [21]. Simulated events are processed and reconstructed in the same manner as collision data.
3 Monte Carlo models
Various MC event generators for hadronic collisions are used for data corrections and for comparison with the final, fully corrected results. The pythia6 (version 6.426) [22] generator is used with tune Z2* and pythia8 (version 8.153) [23] with
tune 4C [24]. These programs provide different descriptions of the diffractive component and they both use a model [25] in which multiple partonic interactions are interleaved with parton showering. The Z2* tune [26] uses the CTEQ6L1 [27] parton distribution function (PDF) set. Tune 4C of pythia8 is based on early LHC data [24]. Parton showers in pythia are modelled according to the Dokshitzer–Gribov–Lipatov– Altarelli–Parisi (DGLAP) [28–30] prescription and hadro-nisation is based on the Lund string fragmentation model [31]. Diffractive cross sections are described by the Schuler– Sjöstrand model [32]. In pythia6, particle production from a low-mass state, X, with MX < 1 GeV/c2is treated as an
isotropic two-body decay, while for high-mass states it is based on the string model. In pythia8, the same model is used to generate the cross section and the diffractive mass, but particle production is modelled differently. For low-mass states, the string model is used, but for higher low-masses (MX >10 GeV/c2) a perturbative description of pomeron–
proton scattering is introduced, based on diffractive PDFs [33–35], which represent probability distributions for par-tons in the proton under the constraint that the proton emerges intact from the collision. The non-perturbative string model introduces a mass dependence on the relative probability for a pomeron to couple to a quark or a gluon [36]. The perturba-tive treatment of pomeron–proton scattering results in harder pTspectra and higher multiplicity for diffractive events gen-erated with pythia8 than for those obtained with pythia6.
The herwig++ (version 2.5.0) [37] MC event generator, with a recent tune to LHC data (UE-EE-3 with CTEQ6L1 PDFs [27,38]), is also used for comparison with the data. This generator is based on matrix element calculations simi-lar to those used in pythia. However, herwig++ features DGLAP-based parton showers ordered in angle and uses cluster fragmentation for the hadronisation [39]. The descrip-tion of hard diffractive processes also makes use of diffractive PDFs; however, soft diffraction is not implemented.
The data are also compared to predictions from two MC event generators used in cosmic ray physics [40]: epos [41] with the LHC tune (based on epos 1.99) [42] and qgsjetII-04 [43]. Both models include contributions from soft- and hard-parton dynamics. The soft component is described in terms of the exchange of virtual quasi-particle states, as in Gribov’s Reggeon field theory [44], with multi-pomeron exchanges accounting for underlying-event effects. At higher energies, the interaction is described in terms of the same degrees of freedom, but generalised to include hard processes via hard-pomeron scattering diagrams, which are equivalent to a leading-order perturbative Quantum Chromodynamics (QCD) approach with DGLAP evolution. These models are retuned to LHC data [45], including cross section measure-ments by TOTEM, and charged-particle multiplicity mea-surements in the central region, by ALICE and CMS, at √s
4 Datasets
The data were collected in July 2012 during a dedicated run with low probability (∼4 %) of overlapping pp interac-tions in the same bunch crossing (pileup) and a non-standard β∗= 90 m optics configuration, where β∗is the amplitude function of the beam at the interaction point. These data
cor-respond to an integrated luminosity of L = 45 µb−1. A
minimum bias trigger was provided by the TOTEM T2 tele-scopes and contributed to the CMS global trigger decision, which initiated simultaneous readout of both the CMS and the TOTEM detectors. The CMS orbit-counter reset signal deliv-ered to the TOTEM electronics at the start of the run ensures the time synchronisation of the two experiments. Events are combined offline by requiring that both the CMS and the TOTEM reconstructed events have the same LHC orbit and bunch numbers. The minimum bias trigger required at least one track candidate (trigger track) in the T2 detector, in either z-direction [46]. With this selection the visible cross section seen by T2 has been estimated to be 91–96 % of the total pp inelastic cross section at √s = 8 TeV [47]. Zero bias data, obtained by triggering on random bunch crossings, are used to measure the trigger efficiency and to cross-check the pileup probability estimate.
MC samples were used to determine the event selec-tion efficiency and the tracking performance. The efficiency corrections and related uncertainties for the CMS tracker are based on the pythia6, pythia8, and epos samples. The MC-based corrections for the TOTEM T2 detector and the corresponding uncertainties were determined by using pythia8 and epos, which were found to bracket the mea-sured dNch/dη distributions in the forward region.
5 Event selection and track reconstruction
The T2 track reconstruction is based on a Kalman filter-like algorithm, simplified thanks to the small amount of material in the GEM planes and the weak magnetic field in the T2 region [20]. In these conditions, the particle trajectory can be successfully reconstructed with a straight-line fit. Single tracks are reconstructed with almost 100 % efficiency for pT >20 MeV/c, but because of multiple scattering and the magnetic field, tracks can be identified as coming from the IP with an efficiency that increases as a function of pTand is greater than 80 % for pT>40 MeV/c [18]. The pseudorapid-ity of a track in T2 is defined as the average pseudorapidpseudorapid-ity of all T2 track hits, calculated from the angle between the z-axis and the line joining the hit and the nominal IP. This definition is adopted on the basis of MC simulation studies and gives an optimal estimation of the pseudorapidity of the selected primary (i.e. produced at the IP) particle. Because of the small scattering angle of the particles reconstructed
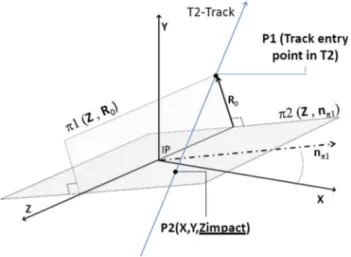
Fig. 1 Definition of the zimpactparameter
in T2, the position of the vertex does not affect significantly the reconstruction of the track pseudorapidity. Due to the limited number of primary particles in T2 per event, no ver-tex reconstruction based on T2 information is used for the analysis. The pseudorapidity region 5.4 <|η| < 5.6 is not included in the analysis because of the large effect that the
beam pipe cone at|η| ≈ 5.5 has on the propagation of the
primary particles.
About 80 % of the reconstructed tracks in T2 are due to non-primary particles, hereafter referred to as secondary particles, that are mainly electrons and positrons generated by photon conversions at the edge of the HF calorimeter of CMS and in the conical section of the beam pipe at |η| ≈ 5.5. It is therefore important to discriminate these par-ticles from the primary charged parpar-ticles. The most effective primary/secondary-particle separation is achieved by using the zimpacttrack parameter (see Fig.1), which is defined as the z coordinate of the intersection point between the track and the plane “π2”. This is the plane which contains the z-axis and is orthogonal to the plane “π1” defined by the z-axis and containing the track entry point in T2 [9]. This parameter is found to be stable against residual misalign-ment biases. Simulation studies demonstrate that the zimpact distribution in the primary-particle region can be described by the sum of two Gaussian distributions plus an exponen-tial distribution. The Gaussians, hereafter referred to as a “double-Gaussian” distribution, are mainly due to primary particles, whereas the exponential distribution accounts for most secondary particles. Simulations predict a contamina-tion of the double-Gaussian distribucontamina-tion by secondary parti-cles of about 20 %, primarily given by photons converted in the material between the IP and T2, with a contribution from decay products of strange particles; the zimpact distribution of these particles is a Gaussian centred around zimpact = 0.
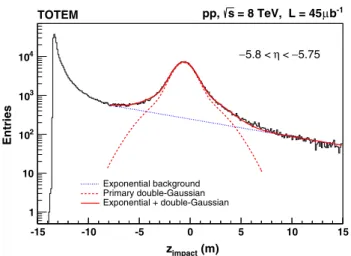
Figure 2 shows the zimpact distribution at the median η of the inclusive forward pseudorapidity distribution. A
(m) impact z Entries 1 10 2 10 3 10 4 10 -15 -10 -5 0 5 10 15 TOTEM pp, s= 8 TeV, L = 45 µb-1 Exponential background Primary double-Gaussian Exponential + double-Gaussian 5.75 − < η 5.8 < −
Fig. 2 The zimpact parameter distribution measured in the data, for
tracks reconstructed in one T2 half-arm in the range−5.8 < η < −5.75. A global (double-Gaussian + exponential function) fit, performed in the range from−8 to 15 m is shown by the solid curve. The dotted curve represents the exponential component from secondary particles, while the dashed curve is the double-Gaussian component, mainly due to primary tracks
bined fit is performed for each η bin of the dNch/dη dis-tribution with the sum of a double-Gaussian and an expo-nential function, yielding standard deviations (amplitudes) of both Gaussian functions that increase (decrease) with η. The mean, required to be the same for both Gaussian dis-tributions, the standard deviations and the amplitudes of the two Gaussian functions, as well as the mean and the ampli-tude of the exponential, are left free in the fit. The widths of the double-Gaussian distributions are consistent with the observed angular resolution of about 0.5 mrad for the T2 track reconstruction. The relative abundance of secondary particles is found to be smaller for higher|η|. The fit of the zimpactdistribution is also repeated by using a second degree polynomial for the description of the background. The results are found to be stable with respect to the choice of the back-ground function. The integral of the fitting function approx-imates the area of the zimpactdistribution to within 1 %.
The T2 tracks are considered “primary candidates” if they are in the zimpactrange corresponding to 96 % of the area of the double-Gaussian, taken symmetrically around the mean. The standard CMS track reconstruction algorithm is based on a combinatorial track finder (CTF) [16]. The collection of reconstructed tracks is produced by multiple iterations of the CTF track reconstruction sequence, in a process called iter-ative tracking. The reconstruction of the interaction vertices in the event uses the available reconstructed track collection. Prompt tracks are selected based on given quality criteria, and the selected tracks are then clustered in z using a “deter-ministic annealing” (DA) algorithm [48]. After identifying candidate vertices based on the DA clustering, the candi-dates containing at least two tracks are fitted by means of an
adaptive vertex fit, where tracks in the vertex are assigned a weight between 0 and 1 based on their compatibility with the common vertex. In the central region, covered by the CMS tracker, high-purity primary tracks [49] are selected with pT >0.1 GeV/c and relative pTuncertainty less than 10 %. To maximise the track-vertex association efficiency, a selection is applied on the track impact parameter, both along the z-axis and in the transverse plane. The impact parameter with respect to the beam spot in the transverse plane, dx y, is
required to be|dx y/σx y| < 3, while for the point of closest
approach to the primary vertex along the z-direction, dz, the
requirement|dz/σz| < 3 is imposed. Here σx yand σzdenote
the uncertainties in dx y and dz, respectively. The analysis is
restricted to|η| < 2.2, to avoid effects from tracks close to the geometric edge of the tracker. Events with more than one reconstructed vertex are discarded, thus reducing the effect of pileup to a negligible level (<1 %).
The pseudorapidity distributions of the charged particles are measured in the central and forward regions for three different event samples, with topologies corresponding to three different event selection criteria. An inclusive sam-ple of events is selected by requiring at least one primary-track candidate in T2. Event samples enhanced in non-single diffractive dissociation (NSD) and single diffractive disso-ciation (SD) events are also selected, the former defined by requiring a least one primary candidate in each of the two T2 telescopes and the latter by selecting events with at least one primary candidate in one T2 telescope and none in the other. Therefore, the intersection of the Nenhanced and SD-enhanced samples is empty, while the union is the inclusive sample.
The inclusive sample includes∼99 % of non-diffractive
events. The reconstruction efficiency for diffractive events is
50 % for a diffractive mass M ∼ 3.6 GeV/c2and increases
rapidly to 99 % for M > 10 GeV/c2. Most of the
non-diffractive and double non-diffractive events, as well as the single diffractive events with masses larger than 1.3 TeV/c2, produce particles in both T2 telescopes and are therefore included in the NSD-enhanced sample. Simulation studies based on pythia8 and epos show that the fraction of NSD events in the SD-enhanced sample amounts to 45–65 %.
6 Data analysis
The pseudorapidity density measurements presented here refer to “stable” primary charged particles, with an average lifetime longer than 3×10⁻¹¹s, either directly produced in pp collisions or from decays of particles with shorter lifetimes. Such a definition, consistent with that of previous studies [3–7,9], considers as secondary particles the decay products of K0
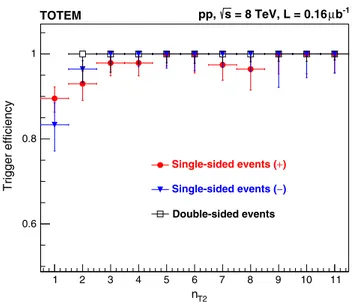
gener-T2 n 1 2 3 4 5 6 7 8 9 10 11 Trigger efficiency 0.6 0.8 1 Double-sided events ) − Single-sided events ( ) + Single-sided events ( TOTEM pp, s= 8 TeV, L = 0.16 µb-1
Fig. 3 Trigger efficiency as a function of the total track multiplicity
in the T2 telescopes for single-sided events with primary candidates in only the z > 0 (+) or z < 0 (−) telescope and for double-sided events with primary candidates in both telescopes
ated by interactions with the material in front and around the detectors.
6.1 Trigger efficiency correction
The trigger efficiency is determined with a zero bias event sample separately for events with primary-track candidates reconstructed offline in both arms of T2 and in only one arm. All zero bias data taken were used to determine the trigger inefficiency. The inefficiency of the trigger is mainly due to non-operating and noisy channels. For each event cate-gory, the trigger efficiency is calculated as a function of the total number of tracks reconstructed offline in T2, nT2, as ϵtrig = N(nT2)trig/N (nT2)zb, where N (nT2)trigis the num-ber of events with the total T2 track multiplicity nT2passing the trigger selection and N (nT2)zb is the number of events with nT2tracks selected with the zero bias trigger. The mea-sured trigger efficiency is shown in Fig.3.
The trigger efficiency correction, 1/ϵtrig, is applied sep-arately for the three event categories and is significant for events with nT2= 1, while it approaches unity for nT2≥ 3. The overall trigger inefficiency results in a 0.1–0.2 % rel-ative correction to the total dNch/dη distributions for the three event categories. The value of the associated system-atic uncertainty is conservatively assumed to be equal to this relative correction.
6.2 Event selection correction
In order to take into account the differences between the sample defined at the MC-particle level (“gen selected”) and
the one selected based on the reconstructed tracks (“reco selected”), a correction factor needs to be introduced. This correction is calculated for each η bin and event category from the ratio
Csel(η)= dNch/dηgen|gen selected
dNch/dηgen|reco selected, (1)
where the numerator is the pseudorapidity density obtained from the MC simulation for events selected based on the charged particles within the T2 acceptance, while the denom-inator is the density obtained by selecting the simulated events according to the topology of the primary candidates in T2, as explained in Sect.5. In general, Cselis different from unity because of migrations between the different event cate-gories. Because of misidentification of secondary particles as primaries and of track reconstruction inefficiencies, an event can be classified (according to the configuration of its recon-structed tracks) in a category that does not reflect its true charged-particle content.
For the inclusive and NSD-enhanced analysis, Cselis eval-uated with pythia8 and epos. Moreover, to quantify possi-ble biases related to this correction, the analyses are repeated with the same selection method defined in Sect.5but without the primary candidate zimpactrequirement.
As the SD-enhanced multiplicity is smaller than the NSD-enhanced multiplicity, a larger selection inefficiency is expected for the former class of events. Moreover, as the SD-enhanced sample represents only 26 % of the inclusive sample, the NSD events that are wrongly identified as SD can introduce a large bias in the measured SD-enhanced dNch/dη distributions. Additional studies of the event selection strat-egy for the SD-enhanced analysis are therefore performed. The analysis is repeated with different event selection strate-gies and Cselis reevaluated for each as a function of η and of the track multiplicity in T2. The selection methods differ in the maximum number of tracks and of primary candidates reconstructed in T2 on each side of the IP. Simulation studies show that, depending on the method and the MC generator used, the selection efficiency is in the range of 70–90 %. The purity of the SD-enhanced sample, defined as the fraction of the selected events with primary charged particles in only one arm of T2, varies between 66 and 81 %. The dependence of the SD-enhanced dNch/dη distributions on the selection methods is used to evaluate the systematic uncertainty related to the event selection. More details on the numerical values of Cselare given in Sects.6.3and6.4.
6.3 Measurement of dNch/dη in the central region
The charged-particle pseudorapidity distributions in the cen-tral region are obtained from the raw distributions of charged tracks after applying a number of corrections according to the formula:
dNch dη = Csel(η) ! evtωevt(nCMS,nT2)!trk∈Sωtrk(nCMS,pT, η) ∆η!nCMSNevt(nCMS,nT2)ωevt(nCMS,nT2) , (2) where S is the sample of tracks that pass the selection criteria for a given η bin, nCMSand nT2is the total number of recon-structed tracks in the CMS tracker and T2, respectively, Nevt is the number of triggered events in the corresponding track multiplicity bins, ωevtcorrects for the trigger and the vertex reconstruction efficiencies, ωtrkcorrects for the tracking effi-ciency and the effect of non-primary tracks and Cselcorrects for the effect of the event and primary-track selection with T2. The bin width in η is ∆η= 0.2.
The event correction, ωevt, depends on the track multi-plicity in T2, nT2, as well as on the multiplicity in the CMS tracker because of the minimum number of tracks required in the vertex reconstruction. It is given by
ωevt(nCMS,nT2)= 1
ϵtrig(nT2)ϵvtx(nCMS), (3)
where ϵtrig is the trigger efficiency (Fig.3) and ϵvtxis the primary vertex reconstruction and selection efficiency, cal-culated with pythia6 as the ratio of the number of recon-structed events satisfying the primary vertex selection to the total number of generated events.
The correction for the tracking efficiency and non-primary tracks, ωtrk(nCMS,pT, η), is defined as:
ωtrk(nCMS,pT, η)
= 1− fnp(nCMS,pT, η)
ϵtrk(nCMS,pT, η) (1+ fm(nCMS,pT, η)). (4) Here, ϵtrkcorrects for the geometric detector acceptance and the reconstruction tracking efficiency; the correction factor fnpaccounts for the fraction of non-primary tracks, i.e. sec-ondary and misidentified tracks, while fm corrects for the effect of single charged particles that are reconstructed mul-tiple times. These quantities are obtained from a detector simulation in bins of nCMS, pT and η. The effect of bin migrations is found to be negligible. Reconstructed events are required to pass the event selection and the generated particles are matched to the reconstructed tracks by using spatial and momentum information.
The tracking efficiency, ϵtrk, is determined as the ratio of the number of all reconstructed tracks that are matched to generated particles and satisfy the track selection criteria in an (nCMS,pT, η) bin to the number of generated primary charged particles in that bin. As shown in Fig.4(top), ϵtrk approaches unity for tracks with pT>0.5 GeV/c and|η| < 1.5.
The correction for non-primary tracks, fnp, is estimated as the ratio of the number of reconstructed tracks not matched
η -2 -1 0 1 2 (GeV/c) T p 0.5 1 1.5 2 0 0.1 0.2 0.3 0.4 0.5 0.6 0.7 0.8 0.9 1 = 8 TeV s CMS Simulation, pp trk ∈ η -2 -1 0 1 2 (GeV)T p 0.5 1 1.5 2 0.02 0.04 0.06 0.08 0.1 0.12 0.14 0.16 0.18 0.2 = 8 TeV s CMS Simulation, pp np f
Fig. 4 Top Tracking efficiency, ϵtrk, as a function of pTand η and
aver-aged over all multiplicity bins (nCMS), for tracks with pT>0.1 GeV/c and|η| < 2.2. Bottom Correction factor, fnp, for non-primary tracks as
a function of pTand η and averaged over all multiplicity bins (nCMS),
for tracks with pT>0.1 GeV/c and|η| < 2.2
to a generated primary particle in a nCMS,pT, ηbin to all reconstructed tracks in that bin. The correction varies as a function of η and pTof the tracks, as shown in Fig.4 (bot-tom), and reaches its lowest values of about 2 % for|η| < 1.5 and pT>0.5 GeV/c. It becomes as large as 20 % at very low transverse momentum ( pT <0.2 GeV/c) and large pseudo-rapidity (|η| > 1.8).
The correction factor for multiply reconstructed particles, fm, is estimated as the ratio of the number of generated pri-mary charged particles that are associated to multiply recon-structed tracks in a given nCMS, pT, η bin to the number of generated charged particles in that bin. It is found to be below 1 %.
The model dependence of the corrections is determined by using pythia6, epos and pythia8. The corrected data, based on correction factors derived from each generator
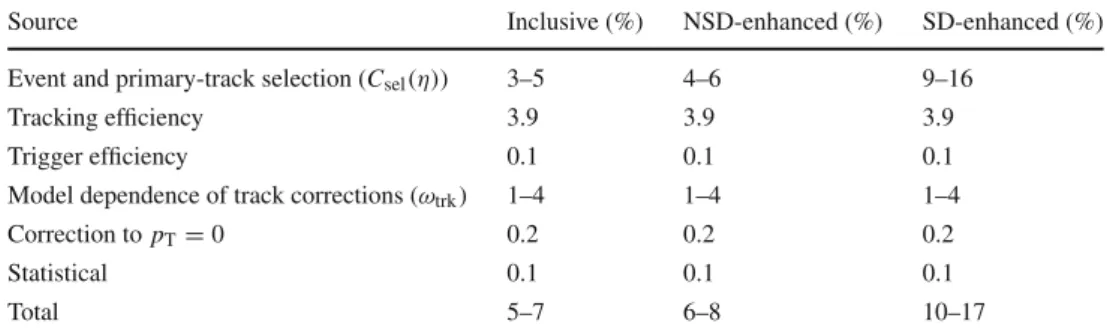
indepen-Table 1 Systematic and
statistical uncertainties of the dNch/dη measurement in the
central region. The given ranges indicate the η dependence of the uncertainties
Source Inclusive (%) NSD-enhanced (%) SD-enhanced (%)
Event and primary-track selection (Csel(η)) 3–5 4–6 9–16
Tracking efficiency 3.9 3.9 3.9
Trigger efficiency 0.1 0.1 0.1
Model dependence of track corrections (ωtrk) 1–4 1–4 1–4
Correction to pT= 0 0.2 0.2 0.2
Statistical 0.1 0.1 0.1
Total 5–7 6–8 10–17
dently, are found to differ by 1–4 % depending on the pseudo-rapidity bin. This amount is taken as a systematic uncertainty. The average correction factor for the event selection, Csel(η), defined in Sect.6.2, is found to be 1.01, 1.025, and 0.94 for the inclusive, NSD-enhanced and SD-enhanced sam-ples, respectively, independent of pseudorapidity. The cor-rection factor is obtained from epos and pythia8. The aver-age value of the correction factors from the two generators is applied to the data, while the relative difference between the two generators is taken as a systematic uncertainty. In addition, the event selection bias and the corresponding sys-tematic uncertainty is estimated for each η bin as described in Sect.6.2by comparing the pseudorapidity distributions obtained with different methods. For the inclusive and NSD-enhanced samples, the systematic uncertainty in the event selection is found to be 3–5 and 4–6 %, respectively, while for the SD-enhanced sample it is 9–16 %.
Corrections of 4–6 % are applied to the final results to extrapolate to pT= 0. The corrections are determined from the dN/d pTspectrum of primary charged particles predicted
by pythia6 and pythia8. The corrections obtained from the two MC generators differ by about 3 %, resulting in a sys-tematic uncertainty in the dNch/dη distributions of about 0.2 %. The same corrections are also estimated from Tsallis fits [50] to the pTdistributions for each η bin, giving consis-tent results.
A summary of the systematic uncertainties is given in Table1. The uncertainties associated with the tracking effi-ciency are treated as uncorrelated between the η bins. For the inclusive and the NSD-enhanced samples, the most sig-nificant systematic uncertainties are those due to the uncer-tainty in the tracking efficiency and the event selection. The model dependence of Cseland the uncertainty in the event selection are dominant for the SD-enhanced sample. The total uncertainty in the tracking efficiency is estimated to
be 3.9 % from a comparison of two-body and four-body D0
decays in data and simulated samples [51]. The uncertain-ties related to the primary vertex selection, the trigger effi-ciency and pileup events are found to be around 0.1 % and are neglected.
6.4 Measurement of dNch/dη in the forward region
The pseudorapidity density in the forward region is mea-sured for each T2 half-arm independently, thus providing a consistency check, as each half-arm differs in its align-ment and track reconstruction efficiency. The number of primary-track candidates passing the zimpactparameter selec-tion criteria is calculated for each η bin as a funcselec-tion of the zimpact-value with the double-Gaussian and exponential fits described in Sect.5. The fraction of tracks associated to the double-Gaussian distribution core ranges from about 74 % (lower|η| bins) to about 92 % (higher |η| bins), and is used to weight each track by the probability for the track to be primary.
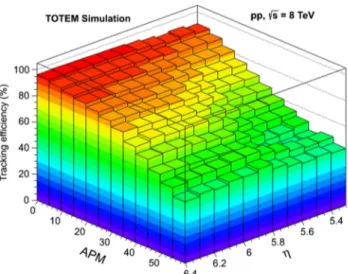
Each track is also weighted by the primary-track effi-ciency, which depends on η and on the average pad cluster multiplicity (APM) per plane in the corresponding half-arm. This efficiency, evaluated from MC generators, is defined as the probability to successfully reconstruct, with a zimpact parameter within the allowed region, a generated primary particle that falls within the acceptance of the detector. As shown in Fig.5for one of the T2 half-arms, the tracking effi-ciency decreases with increasing APM, since the reconstruc-tion of tracks with sufficient number of hits becomes more difficult with larger occupancy. The average primary track efficiency ranges from about 73 % (lower|η| bins) to about 87 % (higher|η| bins), as shown in Fig.5for one of the T2 half-arms. The APM probability is a rapidly decreasing dis-tribution, with average∼ 24 and rms ∼ 29, for the inclusive selection. The rate of multiple associations of reconstructed tracks to the primary particle is negligible (<0.4 %) once the zimpactrequirement is imposed.
Conversion of photons from π0 decays in the material
between the IP and T2, as well as decay products of strange particles, also contribute to the double-Gaussian peak. The overall non-primary contribution, to be subtracted from the double-Gaussian peak, was estimated as a function of η with pythia8, epos and sibyll 2.1 [52]. The first two genera-tors bracket the data in the forward region, while sibyll is introduced to also enclose the measurements from the LHCf
Fig. 5 Primary-track efficiency as a function of η and average pad
cluster multiplicity (APM) in one T2 half-arm for the inclusive pp sam-ple. The efficiency includes the track primary-candidate condition. Only particles with pT>40 MeV/c are considered
experiment of the photon dN/dE distribution [53]. The value of this correction is about 18 % and is obtained as the average of the three MC predictions.
The correction factors for the event selection bias (Csel(η)) are about 1.05, 1.06 and 1.00 for the inclusive, NSD-enhanced and SD-NSD-enhanced event samples, respectively.
Bin migration effects in η are corrected for with pythia8, which gives the best description of the slope of the measured dNch/dη distribution. The effects are typically at the few percent level.
Events characterised by a high T2 hit multiplicity, typi-cally due to showers generated by particles interacting with the material before T2, are not included in the analysis. These events, for which track reconstruction capability is limited, are characterised by an APM value larger than 60 and consti-tute 13.5, 16.5 and 6.3 % of the inclusive, NSD-enhanced and SD-enhanced samples, respectively. The effect of removing these events is evaluated in a MC study, which yields over-all correction factors of about 1.05, 1.04 and 1.06 for the inclusive, NSD-enhanced and SD-enhanced samples, respec-tively. To verify the stability of this correction, the analysis is also repeated after excluding events with APM values larger than 45 and re-evaluating the corresponding MC corrections. The results of the two analyses agree within 1 %. In addi-tion, this correction is also estimated by extrapolating the measured average multiplicity obtained as a function of the maximum APM included in the sample and without correct-ing for the misscorrect-ing fraction of the sample. The extrapolation, performed with a second degree polynomial, gives a correc-tion that is within the MC uncertainty.
The fully corrected dNch/dη distributions in each η bin are determined from:
dNch dη (ηi)= 2π ∆φ ×Csel(ηi) !
evtωevt(nT2)!trk∈Sj Bi jωtrk(APM, ηj,zimpact)
∆η!nT2Nevt(nT2)ωevt(nT2) ,
(5) where Sj is the sample of tracks with ηj − ∆η/2 < ηj < ηj+∆η/2 satisfying the selection criteria above, ∆η = 0.05
is the bin width, Csel is the correction factor related to the event selection defined in Sect. 6.2, Bi j is the bin
migra-tion correcmigra-tion associated with the jth bin in η. In addimigra-tion, ∆φ/2π= 192◦/360◦is the azimuthal acceptance of each T2 half-arm, ωevt(nT2) ≡ 1/ϵtrig(nT2)is the trigger efficiency correction, Nevt(nT2)is the number of selected events with track multiplicity nT2, and ωtrkis defined as:
ωtrk(APM, η, zimpact)= Pprim(η,zimpact)Snp(η)Cmult(η)
ϵ(η,APM) ,
(6) where Pprimis the probability for a track to be primary. Here, ϵis the primary-track efficiency, Snpis the correction factor for the non-primary contribution to the double-Gaussian peak and Cmultis the correction factor for the exclusion of events with APM values above 60.
The dNch/dη distribution thus obtained refers to charged particles with pT >40 MeV/c, corresponding to the
nomi-nal pT acceptance of T2. A MC-based estimation obtained
with epos LHC and pythia8 4C is used to correct the
mea-surement down to pT = 0. This correction, taken from the
average of the two MC predictions, is about 2 %.
The evaluation of the systematic uncertainties for the dNch/dη distributions is performed similarly to that dis-cussed in [9]. Details are given in the following only for the most significant contributions.
The systematic uncertainty in the Pprim function, which is of order 4–5 %, is evaluated by including four effects: (a) the sensitivity to the misalignment corrections, quantified by varying the corrections within their uncertainties, (b) the sensitivity to the zimpact parameter fitting range, which was changed by either one or two meters depending on the η bin, (c) the sensitivity to the background parametrisation, obtained by replacing the exponential function with a second degree polynomial and (d) the difference between the area estimated by the fitting function and the integral of the zimpact distribution.
The systematic uncertainty in the primary-track efficiency is evaluated in studies where tracks are reconstructed with a set of five detector planes (out of the total of ten) in a single T2 half-arm. The track reconstruction efficiency is determined with the other set of detector planes in the same half-arm. The 5–6 % difference between the results obtained from simula-tion and from data is taken as an estimate of the systematic uncertainty.
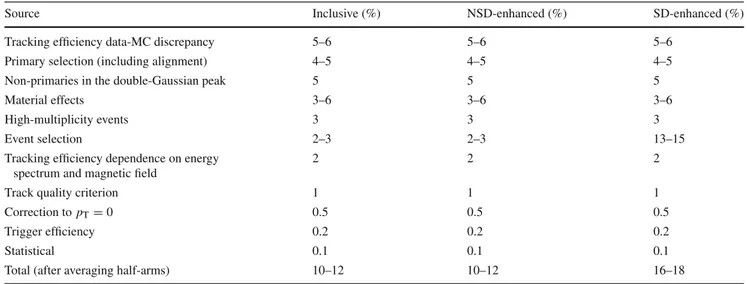
Table 2 Systematic and statistical uncertainties of the dNch/dη
mea-surement with the T2 detector in the forward region. The first two con-tributions are half-arm dependent and partly η-uncorrelated, while the
remaining, excluding the statistical one, are half-arm independent and correlated across bins in η. The given ranges indicate the η dependence of the uncertainties
Source Inclusive (%) NSD-enhanced (%) SD-enhanced (%)
Tracking efficiency data-MC discrepancy 5–6 5–6 5–6
Primary selection (including alignment) 4–5 4–5 4–5
Non-primaries in the double-Gaussian peak 5 5 5
Material effects 3–6 3–6 3–6
High-multiplicity events 3 3 3
Event selection 2–3 2–3 13–15
Tracking efficiency dependence on energy spectrum and magnetic field
2 2 2
Track quality criterion 1 1 1
Correction to pT= 0 0.5 0.5 0.5
Trigger efficiency 0.2 0.2 0.2
Statistical 0.1 0.1 0.1
Total (after averaging half-arms) 10–12 10–12 16–18
The systematic uncertainty due to non-primary tracks included in the double-Gaussian once the exponential con-tribution has been removed, Snp, is evaluated by considering the range of the predictions of the epos, pythia8 and sibyll MC generators, and is about 5 %.
The uncertainty in the correction for the exclusion of events with high secondary-particle multiplicity (Cmult) is taken as the difference between the epos and pythia8 pre-dictions, which is about 3 %. The uncertainty on the cor-rection for the event selection (Csel) is evaluated by taking into account both the dependence of the correction from the
MCs mentioned above and the dependence of the dNch/dη
results on the different event selection strategies discussed earlier. This uncertainty is 13–15 % for the SD-enhanced sample and 2–3 % for the inclusive and NSD-enhanced samples.
The possible bias due to the material uncertainty and there-fore on the production of secondary tracks is evaluated as a function of η from the MC vs. data discrepancy of the ratio between the number of tracks contained in the 96 % double-Gaussian area and all the tracks in the same range. The average discrepancy is in the range of 2–6 %. Simula-tion studies are also performed by varying the thickness of the material in front of T2 by 40 %. This part of the material is the main source of secondary tracks that contribute to the double-Gaussian. The effect of the change of the material results in a possible bias of less than 3 %.
Table2shows the uncertainties due to the corrections. To compute the total systematic uncertainty the errors are first separated into half-arm-correlated and uncorrelated parts and a weighted average between the four half-arms is taken. The dNch/dη measurements obtained for the different T2 half-arms are found to be compatible.
The first two systematic uncertainties in Table2vary as a function of η and contribute to the uncorrelated bin-by-bin uncertainties. Conversely, the remaining systematic uncer-tainties affect all η bins in the same direction. The effect that systematic uncertainties might introduce in the difference of the dNch/dη values at the beginning and at the end of the T2 acceptance is estimated to be at most 7 %.
The total uncertainty is obtained by adding in quadrature the η-correlated uncertainty and the η-uncorrelated one and the (negligible) statistical uncertainty.
7 Results
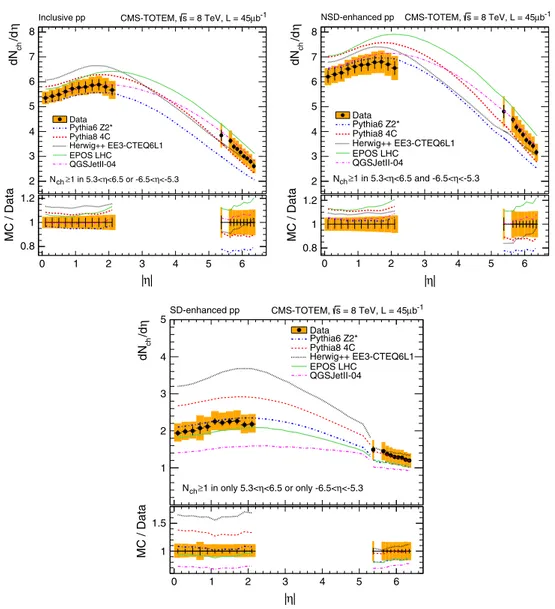
The combined CMS-TOTEM charged-particle pseudorapid-ity distributions are presented in Fig.6 for the three event selection samples shown in Table3. The results are derived in the central region by averaging the data points in the
cor-responding±η bins and in the forward region by averaging
over the four T2 half-arms. The uncertainty band represents the total uncertainty, while the bars show the statistical and uncorrelated systematics between neighbouring bins.
In the central region, the pseudorapidity density at η= 0 is 5.35± 0.36 for the inclusive sample, 6.20 ± 0.46 for the NSD-enhanced sample and 1.94+ 0.26− 0.23for the SD-enhanced sample, with negligible statistical uncertainties. The predic-tions from various MC event generators differ from the data by up to 20 % for the inclusive and NSD-enhanced samples, with even larger discrepancies for the SD-enhanced sample. The data are well described by pythia6 and qgsjetII-04 for the inclusive selection. For the NSD-enhanced sample, the predictions obtained from pythia6 and qgsjetII-04 agree with the data for most η bins. A good description of the
mea-0 1 2 3 4 5 6 η /d ch dN 2 3 4 5 6 7 8 -1 b µ = 8 TeV, L = 45 s CMS-TOTEM, Inclusive pp <-5.3 η <6.5 or -6.5< η 1 in 5.3< ≥ ch N Data Pythia6 Z2* Pythia8 4C Herwig++ EE3-CTEQ6L1 EPOS LHC QGSJetII-04 | η | 0 1 2 3 4 5 6 MC / Data 0.8 1 1.2 0 1 2 3 4 5 6 η /d ch dN 2 3 4 5 6 7 8 -1 b µ = 8 TeV, L = 45 s CMS-TOTEM, NSD-enhanced pp <-5.3 η <6.5 and -6.5< η 1 in 5.3< ≥ ch N Data Pythia6 Z2* Pythia8 4C Herwig++ EE3-CTEQ6L1 EPOS LHC QGSJetII-04 | η | 0 1 2 3 4 5 6 MC / Data 0.8 1 1.2 0 1 2 3 4 5 6 η /d ch dN 1 2 3 4 5 -1 b µ = 8 TeV, L = 45 s CMS-TOTEM, SD-enhanced pp <-5.3 η <6.5 or only -6.5< η 1 in only 5.3< ≥ ch N Data Pythia6 Z2* Pythia8 4C Herwig++ EE3-CTEQ6L1 EPOS LHC QGSJetII-04 | η | 0 1 2 3 4 5 6 MC / Data 1 1.5
Fig. 6 Charged-particle pseudorapidity distributions from an
inclu-sive sample (top left), a Nenhanced sample (top right), and a SD-enhanced sample (bottom). The error bars represent the statistical+ uncorrelated systematics between neighbouring bins and the bands
show the combined systematic and statistical uncertainties. The mea-surements are compared to results from pythia6, tune Z2*, pythia8, tune 4C, herwig++, tune UE-EE-3 with CTEQ6L1 PDFs, epos, tune LHC and qgsjetII-04
Table 3 Event selection criteria
applied at the stable-particle level in the MC simulation
Inclusive sample
Ncharged particles>0 in 5.3 < η < 6.5 or −6.5 < η < −5.3, pT>0 NSD-enhanced sample
Ncharged particles>0 in 5.3 < η < 6.5 and −6.5 < η < −5.3, pT>0 SD-enhanced sample
Ncharged particles>0 in only 5.3 < η < 6.5 or only in −6.5 < η < −5.3, pT>0
surement for the SD-enhanced sample is provided by both epos and pythia6.
The forward pseudorapidity density decreases with|η|.
In the inclusive sample, dNch/dη is 3.85± 0.49 at η =
5.375 and 2.61 ± 0.28 at η = 6.350, with negligible
statistical uncertainty. The pseudorapidity density of the
NSD-enhanced sample ranges between 4.80 ± 0.62 and
3.17± 0.35, while for the SD-enhanced sample it is in
the range of 1.49± 0.27 to 1.20 ± 0.20. The MC
predic-tions for the three samples differ from the data by up to
about ±30 %. For the inclusive and NSD-enhanced
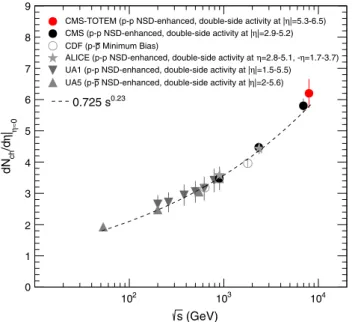
(GeV) s 2 10 103 104 0≈ η |η /d ch dN 0 1 2 3 4 5 6 7 8 9 |=5.3-6.5) η CMS-TOTEM (p-p NSD-enhanced, double-side activity at |
|=2.9-5.2) η CMS (p-p NSD-enhanced, double-side activity at |
Minimum Bias) p CDF (p-=1.7-3.7) η =2.85.1, -η ALICE (p-p NSD-enhanced, double-side activity at
|=1.5-5.5) η UA1 (p-p NSD-enhanced, double-side activity at |
|=2-5.6) η NSD-enhanced, double-side activity at | p
UA5 (p-0.23
0.725 s
Fig. 7 Value of dNch/dη at η≈ 0 as a function of the centre-of-mass
energy in pp and pp collisions. Shown are measurements performed with different NSD event selections from UA1 [12], UA5 [14], CDF [10,11], ALICE [6] and CMS [4]. The dashed line is a power-law fit to the data
the prediction from qgsjetII-04 and are between the epos and pythia8 results. For the SD-enhanced selection, the TOTEM data points are close to the pythia8 and her-wig++ predictions, while qgsjetII-04 underestimates the data. The change in the slope of the MC curves close to
η= 5.3, more visible for the NSD- and SD-enhanced
dis-tributions, is due to the event selection requirement of at least one charged particle in the pseudorapidity region of T2.
The centre-of-mass energy dependence of the pseudora-pidity distribution at η≈ 0 is shown in Fig.7, which includes data from various other experiments for NSD events in pp and p¯p collisions. Although the different experiments do not use identical event selection criteria, they all include a large frac-tion of NSD events. Particle producfrac-tion at η≈ 0 is expected to follow a power-law dependence, dNch/dη""η=0 ∝ sϵ, with ϵ in the range 0.14–0.24 [40]. The result of fitting the high-energy pp and pp central-pseudorapidity particle densities with this function is shown in Fig.7. A value of ϵ= 0.23 ± 0.01 is obtained.
8 Summary
Measurements of charged-particle densities over a large pseudorapidity range are presented for proton–proton (pp) collisions at a centre-of-mass energy of 8 TeV. The data were collected concurrently with the CMS and TOTEM detectors during a dedicated run with low probability for overlapping pp interactions in the same bunch crossing and correspond
to an integrated luminosity of L = 45 µb−1. Pseudorapid-ity distributions of charged particles within |η| < 2.2 and 5.3 < |η| < 6.4 have been measured for three event sam-ples with different final state topologies: a sample of inclu-sive inelastic pp events, a sample dominated by non-single diffractive dissociation (NSD) events and a sample enriched in single diffractive dissociation (SD) events. The data are compared to theoretical predictions obtained from five differ-ent MC evdiffer-ent generators and tunes (pythia6 Z2*, pythia8 4C, herwig++ UE-EE-3, epos LHC tune, and qgsjetII-04).
In the central region, the inclusive and NSD-enhanced samples are well described by pythia6 and qgsjetII. For the SD-enhanced sample a good description of the data is provided by both pythia6 and epos. In the forward region, the pseudorapidity distributions for the inclusive and NSD-enhanced samples are between the pythia8 and epos predic-tions. The qgsjetII predictions are compatible with the data. The pseudorapidity distribution in the SD-enhanced sample, affected by a larger systematic uncertainty, is best described by pythia8 and herwig++.
The charged-particle densities obtained in this paper span the largest pseudorapidity interval ever measured at the LHC and have the unique potential to probe the correlation between particle production in the central region and that in the forward region. With the tunes used, none of the MC event generators are able to consistently describe the data over the whole η region and for all event samples.
Acknowledgments We congratulate our colleagues in the CERN
accelerator departments for the excellent performance of the LHC. We especially thank the beam optics development team for the design and the successful commissioning of the high β-optics and the LHC machine coordinators for scheduling the dedicated fills. We are grateful to the technical and administrative staffs at CERN and at other CMS and TOTEM institutes for their contributions to the success of the CMS and TOTEM efforts. In addition, we gratefully acknowledge the comput-ing centres and personnel of the Worldwide LHC Computcomput-ing Grid for delivering so effectively the computing infrastructure essential to our analyses. We acknowledge the enduring support for the construction and operation of the LHC and the CMS and TOTEM detectors pro-vided by our affiliated institutions as included in the lists of authors and the following funding agencies: the Austrian Federal Ministry of Sci-ence, Research and Economy and the Austrian Science Fund; the Bel-gian Fonds de la Recherche Scientifique and Fonds voor Wetenschap-pelijk Onderzoek; the Brazilian Funding Agencies (CNPq, CAPES, FAPERJ and FAPESP); the Bulgarian Ministry of Education, Youth and Science; CERN; the Chinese Academy of Sciences, Ministry of Science and Technology and National Natural Science Foundation of China; the Colombian Funding Agency (COLCIENCIAS); the Croat-ian Ministry of Science, Education and Sport and the CroatCroat-ian Science Foundation; the Research Promotion Foundation, Cyprus; the Ministry of Education and Research, Estonian Research Council via IUT23-4 and IUT23-6 and European Regional Development Fund, Estonia; the Academy of Finland, Finnish Ministry of Education and Culture and Helsinki Institute of Physics; the Institut National de Physique Nucléaire et de Physique des Particules / CNRS and Commissariat à l’Énergie Atomique et aux Énergies Alternatives / CEA, France; the Bundesministerium für Bildung und Forschung, Deutsche
Forschungs-gemeinschaft and Helmholtz-Gemeinschaft Deutscher Forschungszen-tren, Germany; the General Secretariat for Research and Technology, Greece; the National Scientific Research Foundation, National Inno-vation Office and the OTKA Grant NK 101438, 73143, Hungary; the Department of Atomic Energy and the Department of Science and Tech-nology, India; the Institute for Studies in Theoretical Physics and Math-ematics, Iran; the Science Foundation, Ireland; the Istituto Nazionale di Fisica Nucleare, Italy; the Korean Ministry of Education, Science and Technology and the World Class University program of NRF, Republic of Korea; the Lithuanian Academy of Sciences; the Ministry of Educa-tion and University of Malaya (Malaysia); the Mexican Funding Agen-cies (CINVESTAV, CONACYT, SEP and UASLP-FAI); the Ministry of Business, Innovation and Employment, New Zealand; the Pakistan Atomic Energy Commission; the Ministry of Science and Higher Edu-cation and the National Science Centre, Poland; the Fundação para a Ciência e a Tecnologia, Portugal; JINR (Armenia, Belarus, Georgia, Ukraine, Uzbekistan); the Ministry of Education and Science of the Russian Federation, the Federal Agency of Atomic Energy of the Rus-sian Federation, RusRus-sian Academy of Sciences and the RusRus-sian Founda-tion for Basic Research; the Ministry of EducaFounda-tion, Science and Tech-nological Development of Serbia; the Secretaría de Estado de Inves-tigación, Desarrollo e Innovación and Programa Consolider-Ingenio 2010, Spain; the Swiss Funding Agencies (ETH Board, ETH Zurich, PSI, SNF, UniZH, Canton Zurich and SER); the Ministry of Science and Technology, Taipei; the Thailand Center of Excellence in Physics, the Institute for the Promotion of Teaching Science and Technology of Thailand, Special Task Force for Activating Research and the National Science and Technology Development Agency of Thailand; the Scien-tific and Technical Research Council of Turkey and Turkish Atomic Energy Authority; the National Academy of Sciences of Ukraine and State Fund for Fundamental Researches, Ukraine; the Science and Tech-nology Facilities Council, UK; the US Department of Energy and the US National Science Foundation. Individuals have received support from the Marie-Curie programme and the European Research Council and EPLANET (European Union); the Leventis Foundation; the A. P. Sloan Foundation; the Alexander von Humboldt Foundation; the Belgian Fed-eral Science Policy Office; the Fonds pour la Formation à la Recherche dans l’Industrie et dans l’Agriculture (FRIA-Belgium); the Agentschap voor Innovatie door Wetenschap en Technologie (IWT-Belgium); the Ministry of Education, Youth and Sports (MEYS) of the Czech Repub-lic; the Magnus Ehrnrooth foundation and the Waldemar von Frenckell foundation, Finland; the Finnish Academy of Science and Letters (The Vilho, Yrjö and Kalle Väisälä Fund) and the Charles Simonyi Fund (Hungary); the Council of Science and Industrial Research, India; the Compagnia di San Paolo (Torino); the HOMING PLUS programme of Foundation for Polish Science, cofinanced by EU, Regional Devel-opment Fund; and the Thalis and Aristeia programmes cofinanced by EU-ESF and the Greek NSRF.
Open Access This article is distributed under the terms of the Creative
Commons Attribution License which permits any use, distribution, and reproduction in any medium, provided the original author(s) and the source are credited.
Funded by SCOAP3/ License Version CC BY 4.0.
References
1. S. Ostapchenko, On the model dependence of the relation between minimum-bias and inelastic proton-proton cross sections. Phys. Lett. B 703, 588 (2011). doi:10.1016/j.physletb.2011.08.050.
arXiv:1103.5684
2. ALICE Collaboration, Measurement of inelastic, single- and double-diffraction cross sections in proton–proton collisions at the
LHC with ALICE. Eur. Phys. J. C 73, 2456 (2013). doi:10.1140/ epjc/s10052-013-2456-0.arXiv:1208.4968
3. CMS Collaboration, Transverse momentum and pseudorapidity distributions of charged hadrons in pp collisions at √s = 0.9 and 2.36 TeV. JHEP 02, 041 (2010). doi:10.1007/JHEP02(2010)041
4. CMS Collaboration, Transverse-momentum and pseudorapidity distributions of charged hadrons in pp collisions at √s = 7 TeV. Phys. Rev. Lett. 105, 022002 (2010). doi:10.1103/PhysRevLett. 105.022002
5. ATLAS Collaboration, Charged-particle multiplicities in pp inter-actions measured with the ATLAS detector at the LHC. New J. Phys. 13, 053033 (2011). doi:10.1088/1367-2630/13/5/053033
6. ALICE Collaboration, Charged-particle multiplicity measurement in proton–proton collisions at √s = 0.9 and 2.36 TeV with ALICE at LHC. Eur. Phys. J. C 68, 89 (2010). doi:10.1140/epjc/ s10052-010-1339-x
7. ALICE Collaboration, Charged-particle multiplicity measurement in proton–proton collisions at √s = 7 TeV with ALICE at LHC. Eur. Phys. J. C 68, 345 (2010). doi:10.1140/epjc/s10052-010-1350-2
8. LHCb Collaboration, Measurement of charged particle multiplici-ties in pp collisions at √s = 7 TeV in the forward region. Eur. Phys. J. C 72, 1947 (2012). doi:10.1140/epjc/s10052-012-1947-8
9. TOTEM Collaboration, Measurement of the forward charged-particle pseudorapidity density in pp collisions at √s = 7 TeV with the TOTEM experiment. Europhys. Lett. 98, 31002 (2012). doi:10. 1209/0295-5075/98/31002
10. CDF Collaboration, Measurement of particle production and inclu-sive differential cross sections in p¯p collisions at√s= 1.96 TeV.
Phys. Rev. D 79, 112005 (2009). doi:10.1103/PhysRevD.79. 112005[Erratum doi:10.1103/PhysRevD.82.119903]
11. CDF Collaboration, Pseudorapidity distributions of charged parti-cles produced in p¯p interactions at√s= 630 GeV and 1800 GeV. Phys. Rev. D 41, 2330 (1990). doi:10.1103/PhysRevD.41.2330
12. UA1 Collaboration, A study of the general characteristics of proton–antiproton collisions at √s = 0.2 to 0.9 TeV. Nucl. Phys. B
335, 261 (1990). doi:10.1016/0550-3213(90)90493-W
13. UA4 Collaboration, Pseudorapidity distribution of charged particles in diffraction dissociation events at the CERN SPS collider. Phys. Lett. B 166, 459 (1986). doi:10.1016/ 0370-2693(86)91598-4
14. UA5 Collaboration, Scaling of pseudorapidity distributions at c.m. energies up to 0.9 TeV. Z. Phys. C 33, 1 (1986). doi:10.1007/ BF01410446
15. CMS Collaboration, The CMS experiment at the CERN LHC. JINST 3, S08004 (2008). doi:10.1088/1748-0221/3/08/S08004
16. CMS Collaboration, Track and vertex reconstruction in CMS. Nucl. Instrum. Methods A 582, 781 (2007). doi:10.1016/j.nima.2007.07. 091
17. TOTEM Collaboration, The TOTEM experiment at the CERN large hadron collider. JINST 3, S08007 (2008). doi:10.1088/1748-0221/ 3/08/S08007
18. TOTEM Collaboration, Performance of the TOTEM detectors at the LHC. Int. J. Mod. Phys. A 28, 1330046 (2013). doi:10.1142/ S0217751X13300469.arXiv:1310.2908
19. M. Bagliesi et al., The TOTEM T2 telescope based on triple-GEM chambers. Nucl. Instrum. Methods A 617, 134 (2010). doi:10.1016/ j.nima.2009.07.006
20. M. Berretti, Measurement of the forward charged particle pseudo-rapidity density in pp collisions at √s = 7 TeV with the TOTEM experiment. PhD thesis, Siena, 2012. CERN-THESIS-2012-231, chap. 3
21. GEANT4 Collaboration, GEANT4—a simulation toolkit. Nucl. Instrum. Methods A 506, 250 (2003). doi:10.1016/ S0168-9002(03)01368-8
22. T. Sjöstrand, S. Mrenna, P. Skands, PYTHIA 6.4 physics and man-ual. JHEP 05, 026 (2006). doi:10.1088/1126-6708/2006/05/026
23. T. Sjöstrand, S. Mrenna, P. Skands, A brief introduction to PYTHIA 8.1. Comput. Phys. Commun. 178, 852 (2008). doi:10.1016/j.cpc. 2008.01.036
24. R. Corke, T. Sjöstrand, Interleaved parton showers and tuning prospects. JHEP 03, 032 (2011). doi:10.1007/JHEP03(2011)032.
arXiv:1011.1759
25. P. Skands, D. Wicke, Non-perturbative QCD effects and the top mass at the Tevatron. Eur. Phys. J. C 52, 133 (2007). doi:10.1140/ epjc/s10052-007-0352-1
26. CMS Collaboration, Measurement of energy flow at large pseudo-rapidities in pp collisions at √s= 0.9 and 7 TeV. JHEP 11, 148 (2011). doi:10.1007/JHEP11(2011)148. arXiv:1110.0211 [Erra-tum doi:10.1007/JHEP02(2012)055]
27. Pumplin et al., New generation of parton distributions with uncer-tainties from global QCD analysis. JHEP 07, 012 (2002). doi:10. 1088/1126-6708/2002/07/012.arXiv:hep-ph/0201195
28. V.N. Gribov, L.N. Lipatov, Deep inelastic e p scattering in pertur-bation theory. Sov. J. Nucl. Phys. 15, 438 (1972)
29. G. Altarelli, G. Parisi, Asymptotic freedom in parton language. Nucl. Phys. B 126, 298 (1977). doi:10.1016/ 0550-3213(77)90384-4
30. Y.L. Dokshitzer, Calculation of the structure functions for deep inelastic scattering and e+e−annihilation by perturbation theory
in quantum chromodynamics. Sov. Phys. JETP 46, 641 (1977) 31. B. Andersson, G. Gustafson, G. Ingelman, T. Sjöstrand, Parton
fragmentation and string dynamics. Phys. Rep. 97, 31 (1983). doi:10.1016/0370-1573(83)90080-7
32. G.A. Schuler, T. Sjöstrand, Hadronic diffractive cross sections and the rise of the total cross section. Phys. Rev. D 49, 2257 (1994). doi:10.1103/PhysRevD.49.2257
33. H1 Collaboration, Measurement and QCD analysis of the diffractive deep-inelastic scattering cross-section at HERA. Eur. Phys. J. C 48, 715 (2006). doi:10.1140/epjc/s10052-006-0035-3.
arXiv:hep-ex/0606004
34. H1 Collaboration, Dijet cross sections and parton densities in diffractive DIS at HERA. JHEP 10, 042 (2007). doi:10.1088/ 1126-6708/2007/10/042.arXiv:0708.3217
35. P. Newman, M. Wing, The hadronic final state at HERA (2013). Rev. Mod. Phys. 86, 1037 (2014). doi:10.1103/RevModPhys.86. 1037.arXiv:1308.3368
36. S. Navin, Diffraction in PYTHIA. LUTP-09-23, MCnet/10/09 (2010).arXiv:1005.3894
37. M. Bähr et al., Herwig++ physics and manual. Eur. Phys. J. C 58, 639 (2008). doi:10.1140/epjc/s10052-008-0798-9
38. S. Gieseke, C. Röhr, A. Siódmok, Colour reconnections in Herwig++. Eur. Phys. J. C 72, 2225 (2012). doi:10.1140/epjc/ s10052-012-2225-5.arXiv:1206.0041
39. S. Gieseke et al., Herwig++ 2.5 release note. DCPT/11/18, DESY 11–018, IPPP/11/09, KA-TP-04-2011, MCnet-11-04 (2011).
arXiv:1102.1672
40. D. d’Enterria, R. Engel, T. Pierog, S. Ostapchenko, K. Werner, Constraints from the first LHC data on hadronic event gen-erators for ultra-high energy cosmic-ray physics. Astropart. Phys. 35, 98 (2011). doi:10.1016/j.astropartphys.2011.05.002.
arXiv:1101.5596
41. K. Werner, F.M. Liu, T. Pierog, Parton ladder splitting and the rapid-ity dependence of transverse momentum spectra in deuteron–gold collisions at RHIC. Phys. Rev. C 74, 044902 (2006). doi:10.1103/ PhysRevC.74.044902.arXiv:hep-ph/0506232
42. T. Pierog et al., EPOS LHC: test of collective hadronization with LHC data (2013).arXiv:1306.0121
43. S. Ostapchenko, Monte Carlo treatment of hadronic interactions in enhanced Pomeron scheme: I. QGSJET-II model. Phys. Rev. D 83, 014018 (2011). doi:10.1103/PhysRevD.83.014018
44. V.N. Gribov, A Reggeon diagram technique. Sov. Phys. JETP 26, 414 (1968)
45. T. Pierog, LHC results and high energy cosmic ray interaction models. J. Phys. Conf. Ser. 409, 012008 (2013). doi:10.1088/ 1742-6596/409/1/012008
46. TOTEM Collaboration, Measurement of proton–proton inelastic scattering cross-section at √s = 7 TeV. Europhys. Lett. 101, 21003 (2013). doi:10.1209/0295-5075/101/21003
47. TOTEM Collaboration, Luminosity-independent measurement of the proton–proton total cross section at √s = 8 TeV. Phys. Rev. Lett. 111, 012001 (2013). doi:10.1103/PhysRevLett.111.012001
48. K. Rose, Deterministic annealing for clustering, compression, clas-sification, regression, and related optimization problems. Proc. IEEE 86(11), 2210 (1998). doi:10.1109/5.726788
49. CMS Collaboration, Tracking and vertexing results from first col-lisions. CMS Physics Analysis Summary CMS-PAS-TRK-10-001 (2010)
50. C. Tsallis, Possible generalization of Boltzmann–Gibbs statistics. J. Stat. Phys. 52, 479 (1988). doi:10.1007/BF01016429
51. CMS Collaboration, Measurement of tracking efficiency. CMS Physics Analysis Summary CMS-PAS-TRK-10-002 (2010) 52. E.-J. Ahn et al., Cosmic ray interaction event generator SIBYLL
2.1. Phys. Rev. D 80, 094003 (2009). doi:10.1103/PhysRevD.80. 094003.arXiv:0906.4113
53. LHCf Collaboration, Measurement of zero degree single photon energy spectra for √s= 7 TeV proton–proton collisions at LHC. Phys. Lett. B 703, 128 (2011). doi:10.1016/j.physletb.2011.07.077.
arXiv:1104.5294
The CMS Collaboration
Yerevan Physics Institute, Yerevan, Armenia
S. Chatrchyan, V. Khachatryan, A. M. Sirunyan, A. Tumasyan
Institut für Hochenergiephysik der OeAW, Vienna, Austria
W. Adam, T. Bergauer, M. Dragicevic, J. Erö, C. Fabjan1, M. Friedl, R. Frühwirth1, V. M. Ghete, C. Hartl, N. Hörmann, J.
Hrubec, M. Jeitler1, W. Kiesenhofer, V. Knünz, M. Krammer1, I. Krätschmer, D. Liko, I. Mikulec, D. Rabady2, B.
Rahbaran, H. Rohringer, R. Schöfbeck, J. Strauss, A. Taurok, W. Treberer-Treberspurg, W. Waltenberger, C.-E. Wulz1 National Centre for Particle and High Energy Physics, Minsk, Belarus
Universiteit Antwerpen, Antwerp, Belgium
S. Alderweireldt, M. Bansal, S. Bansal, T. Cornelis, E. A. De Wolf, X. Janssen, A. Knutsson, S. Luyckx, L. Mucibello, S. Ochesanu, B. Roland, R. Rougny, H. Van Haevermaet, P. Van Mechelen, N. Van Remortel, A. Van Spilbeeck
Vrije Universiteit Brussel, Brussels, Belgium
F. Blekman, S. Blyweert, J. D’Hondt, N. Heracleous, A. Kalogeropoulos, J. Keaveney, T. J. Kim, S. Lowette, M. Maes, A. Olbrechts, D. Strom, S. Tavernier, W. Van Doninck, P. Van Mulders, G. P. Van Onsem, I. Villella
Université Libre de Bruxelles, Brussels, Belgium
C. Caillol, B. Clerbaux, G. De Lentdecker, L. Favart, A. P. R. Gay, A. Léonard, P. E. Marage, A. Mohammadi, L. Perniè, T. Reis, T. Seva, L. Thomas, C. Vander Velde, P. Vanlaer, J. Wang
Ghent University, Ghent, Belgium
V. Adler, K. Beernaert, L. Benucci, A. Cimmino, S. Costantini, S. Dildick, G. Garcia, B. Klein, J. Lellouch, J. Mccartin, A. A. Ocampo Rios, D. Ryckbosch, S. Salva Diblen, M. Sigamani, N. Strobbe, F. Thyssen, M. Tytgat, S. Walsh, E. Yazgan, N. Zaganidis
Université Catholique de Louvain, Louvain-la-Neuve, Belgium
S. Basegmez, C. Beluffi3, G. Bruno, R. Castello, A. Caudron, L. Ceard, G. G. Da Silveira, C. Delaere, T. du Pree, D. Favart,
L. Forthomme, A. Giammanco4, J. Hollar, P. Jez, M. Komm, V. Lemaitre, J. Liao, O. Militaru, C. Nuttens, D. Pagano, A.
Pin, K. Piotrzkowski, A. Popov5, L. Quertenmont, M. Selvaggi, M. Vidal Marono, J. M. Vizan Garcia Université de Mons, Mons, Belgium
N. Beliy, T. Caebergs, E. Daubie, G. H. Hammad
Centro Brasileiro de Pesquisas Fisicas, Rio de Janeiro, Brazil
G. A. Alves, M. Correa Martins Junior, T. Dos Reis Martins, M. E. Pol, M. H. G. Souza
Universidade do Estado do Rio de Janeiro, Rio de Janeiro, Brazil
W. L. Aldá Júnior, W. Carvalho, J. Chinellato6, A. Custódio, E. M. Da Costa, D. De Jesus Damiao, C. De Oliveira Martins, S. Fonseca De Souza, H. Malbouisson, M. Malek, D. Matos Figueiredo, L. Mundim, H. Nogima, W. L. Prado Da Silva, J. Santaolalla, A. Santoro, A. Sznajder, E. J. Tonelli Manganote6, A. Vilela Pereira
Universidade Estadual Paulistaa, Universidade Federal do ABCb, São Paulo, Brazil
C. A. Bernardesb, F. A. Diasa,7, T. R. Fernandez Perez Tomeia, E. M. Gregoresb, P. G. Mercadanteb, S. F. Novaesa, Sandra
S. Padulaa
Institute for Nuclear Research and Nuclear Energy, Sofia, Bulgaria
V. Genchev2, P. Iaydjiev2, A. Marinov, S. Piperov, M. Rodozov, G. Sultanov, M. Vutova
University of Sofia, Sofia, Bulgaria
A. Dimitrov, I. Glushkov, R. Hadjiiska, V. Kozhuharov, L. Litov, B. Pavlov, P. Petkov
Institute of High Energy Physics, Beijing, China
J. G. Bian, G. M. Chen, H. S. Chen, M. Chen, R. Du, C. H. Jiang, D. Liang, S. Liang, X. Meng, R. Plestina8, J. Tao, X. Wang, Z. Wang
State Key Laboratory of Nuclear Physics and Technology, Peking University, Beijing, China
C. Asawatangtrakuldee, Y. Ban, Y. Guo, Q. Li, W. Li, S. Liu, Y. Mao, S. J. Qian, D. Wang, L. Zhang, W. Zou
Universidad de Los Andes, Bogota, Colombia
C. Avila, C. A. Carrillo Montoya, L. F. Chaparro Sierra, C. Florez, J. P. Gomez, B. Gomez Moreno, J. C. Sanabria
Technical University of Split, Split, Croatia
N. Godinovic, D. Lelas, D. Polic, I. Puljak
University of Split, Split, Croatia
Z. Antunovic, M. Kovac
Institute Rudjer Boskovic, Zagreb, Croatia
University of Cyprus, Nicosia, Cyprus
A. Attikis, G. Mavromanolakis, J. Mousa, C. Nicolaou, F. Ptochos, P. A. Razis
Charles University, Prague, Czech Republic
M. Finger, M. Finger Jr.
Academy of Scientific Research and Technology of the Arab Republic of Egypt, Egyptian Network of High Energy Physics, Cairo, Egypt
A. A. Abdelalim9, Y. Assran10, S. Elgammal11, A. Ellithi Kamel12, M. A. Mahmoud13, A. Radi1114 National Institute of Chemical Physics and Biophysics, Tallinn, Estonia
M. Kadastik, M. Müntel, M. Murumaa, M. Raidal, L. Rebane, A. Tiko
Department of Physics, University of Helsinki, Helsinki, Finland
P. Eerola, G. Fedi, M. Voutilainen
Helsinki Institute of Physics, Helsinki, Finland
J. Härkönen, V. Karimäki, R. Kinnunen, M. J. Kortelainen, T. Lampén, K. Lassila-Perini, S. Lehti, T. Lindén, P. Luukka, T. Mäenpää, T. Peltola, E. Tuominen, J. Tuominiemi, E. Tuovinen, L. Wendland
Lappeenranta University of Technology, Lappeenranta, Finland
T. Tuuva
DSM/IRFU, CEA/Saclay, Gif-sur-Yvette, France
M. Besancon, F. Couderc, M. Dejardin, D. Denegri, B. Fabbro, J. L. Faure, F. Ferri, S. Ganjour, A. Givernaud, P. Gras, G. Hamel de Monchenault, P. Jarry, E. Locci, J. Malcles, A. Nayak, J. Rander, A. Rosowsky, M. Titov
Laboratoire Leprince-Ringuet, Ecole Polytechnique, IN2P3-CNRS, Palaiseau, France
S. Baffioni, F. Beaudette, P. Busson, C. Charlot, N. Daci, T. Dahms, M. Dalchenko, L. Dobrzynski, A. Florent, R. Granier de Cassagnac, P. Miné, C. Mironov, I. N. Naranjo, M. Nguyen, C. Ochando, P. Paganini, D. Sabes, R. Salerno, J. B. Sauvan, Y. Sirois, C. Veelken, Y. Yilmaz, A. Zabi
Institut Pluridisciplinaire Hubert Curien, Université de Strasbourg, Université de Haute Alsace Mulhouse, CNRS/IN2P3, Strasbourg, France
J.-L. Agram15, J. Andrea, D. Bloch, J.-M. Brom, E. C. Chabert, C. Collard, E. Conte15, F. Drouhin15, J.-C. Fontaine15, D.
Gelé, U. Goerlach, C. Goetzmann, P. Juillot, A.-C. Le Bihan, P. Van Hove
Centre de Calcul de l’Institut National de Physique Nucleaire et de Physique des Particules, CNRS/IN2P3, Villeurbanne, France
S. Gadrat
Institut de Physique Nucléaire de Lyon, Université de Lyon, Université Claude Bernard Lyon 1, CNRS-IN2P3, Villeurbanne, France
S. Beauceron, N. Beaupere, G. Boudoul, S. Brochet, J. Chasserat, R. Chierici, D. Contardo2, P. Depasse, H. El Mamouni, J.
Fan, J. Fay, S. Gascon, M. Gouzevitch, B. Ille, T. Kurca, M. Lethuillier, L. Mirabito, S. Perries, J. D. Ruiz Alvarez, L. Sgandurra, V. Sordini, M. Vander Donckt, P. Verdier, S. Viret, H. Xiao
Institute of High Energy Physics and Informatization, Tbilisi State University, Tbilisi, Georgia
Z. Tsamalaidze16
RWTH Aachen University, I. Physikalisches Institut, Aachen, Germany
C. Autermann, S. Beranek, M. Bontenackels, B. Calpas, M. Edelhoff, L. Feld, O. Hindrichs, K. Klein, A. Ostapchuk, A. Perieanu, F. Raupach, J. Sammet, S. Schael, D. Sprenger, H. Weber, B. Wittmer, V. Zhukov5
RWTH Aachen University, III. Physikalisches Institut A, Aachen, Germany
M. Ata, J. Caudron, E. Dietz-Laursonn, D. Duchardt, M. Erdmann, R. Fischer, A. Güth, T. Hebbeker, C. Heidemann, K. Hoepfner, D. Klingebiel, S. Knutzen, P. Kreuzer, M. Merschmeyer, A. Meyer, M. Olschewski, K. Padeken, P. Papacz, H. Reithler, S. A. Schmitz, L. Sonnenschein, D. Teyssier, S. Thüer, M. Weber