Eur
Sho
1Depa Fiscia 2Depa acira@ Abstr This w betwe the pr The m the po overa Keyw ropean Tranort Sea
artment of Ec ano (SA), Italy artment of Ec @unime.it ract work studies een investmen resence of any main insight o orts of the Sic ll reorganizati ords: Short Se nsport \ TrasShippi
Fa
conomics and y. Tel.: +39 08 conomics, Un demand and nts and ‘road-s y correlation b of our framew ilian Region.T ion of the regi ea Shipping; S sporti Europng in It
abio Carl
d Statistics, U 89 96 2836. E niversity of M d supply of m sea’ modal bal between the re work shows a This result she ional logistics Sicily; Port in pei (2017) Italy: So
lucci
1*, An
University of Email: fcarlucc Messina, Piaz maritime port lance in Sicily elevant variabl strong imbala eds somelight s is desiderabl nvestment. Issue 64, Paome Evi
ndrea Cir
Salerno, Via [email protected] zza Pugliatti, services in o y. Using a pan les and the vo ance in terms on our resear e. aper n° 5, ISidence f
rà
2 a Giovanni Pa 1 98122 Me order to analy nel data approlume of good of goods load rch questionan SSN 1825-3
from Sic
aolo II 132, essina, Italy.yse the relati ach, it will be s traded in Sic ded and unloa nd highlights t 3997
cily
84084 Email: onship e tested cily. aded in that an1. Introduction
Transport system is an essential term, or rather the driving element, of market globalization and firms de-localization(Lee et al., 2014). Transport efficiency increases the worldwide competition in products and services markets(Cariou et al., 2014). The economics distances reduction, as a consequence of the modern economic systems, indeed, had made it possible a wide development in the mobility of goods and people(Carlucci et al., 2017b).
In this context, maritime transport plays a key role: the increasing in ship size and the containerization have made it possible, as well as cost effective, to move huge amounts of raw materials and agricultural products over long distances. During the 1990, the international maritime traffic from Far East was characterized by a powerful impetus to the development, and it was crucial in order to link some geographical areas located far away from each other, and for contributing to reduce costs with regard to alternative transports modes(Forte, 2013).
The efficiency of port infrastructure has become particularly important for Sicily due to the fact that it is an island. In this study, we try to use empirical tools in order to understand the variables which can affect the choice of using sea freight, and the impact of this choice on demand and supply of connected services(Medda and Trujillo, 2010). The work will proceed as follow. In the first stage, we will examine the socio-economic situation of the Sicilian region, in particular the structure of different types of transport. In the second stage, it will be analysed variables which represent, according to the literature, the main determinant of the transport demand. Using a panel data approach, it will be tested the presence of any correlation between the relevant variables and the volume of goods traded in Sicily.
2. Socio-economic framework and modal split of freight transport in Sicily
Before dealing with supply and demand of goods transport in Sicily, it is useful to give an overview of the recent socio-economic context of the Sicilian region, which is the subject of the present work.
European Transport \ Trasporti Europei (2017) Issue 64, Paper n° 5, ISSN 1825-3997
2.1 Socio-economic Framework
The Sicilian GDP, after a steady period of growth until 2007, suffered a setback with constant decreases the values of which, in the last fifteen years, were lower than those of 1995: they went from €74.853 million in 1995 to €74.762 billion in 2015 (Fig. 1).
Looking at the figure 1, that shows the added value of the productive sectors, it seems clear that the GDP reduction can be mainly attributed to the reduction in the industrial sector activities and, in part, to the decrease in services. In particular, the added value of the industrial sector in the period 2005-2015 was reduced by 30%, while the ones of services lost 8% in the same period.
This decreasing trend in the economic cycle has obviously an increasingly important burden on the decline in total trade of goods in Sicily having regards of all transport modes. Nevertheless, however, it remains strongly imbalance in the use of the different transport modes.
2.2 Modal distribution of freight transport
In Italy, the breakdown of goods transportation between the three superficial modes (rail, road and sea), is very unbalanced. Consequently, transport activities has become a priority policy issue (Arbolino et al., 2017).
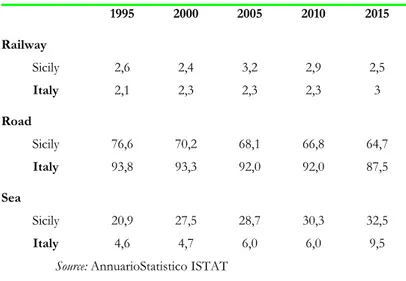
The rail transport seems to plays a marginal role in the handling of goods. ISTAT data (Tab.1) show that from 1995 to 2015, the rail transport system has contributed just over 2.5% on average of total cargo handling. In Italy in 2015, 87% of goods were carried by road. On the contrary, although in Sicily we found a lower percentage of total goods being transported by road (around 65%), the trend over the years showed a structural
0 20000 40000 60000 80000 100000 1995 1997 1999 2001 2003 2005 2007 2009 2011 2013 2015
Figure 1: Sicilian GDP by Activity (vaues refered to year 2000)
imbalance, while maritime transport in Sicily was the dominant mode of transport. However, the trend once again showed that there was no changes in volumes that suggests a gradual modal shift over the years(Castells, Usabiaga and Martìnez, 2014).
Table 1 – Modal Distribution of goods in Sicily
1995 2000 2005 2010 2015 Railway Sicily 2,6 2,4 3,2 2,9 2,5 Italy 2,1 2,3 2,3 2,3 3 Road Sicily 76,6 70,2 68,1 66,8 64,7 Italy 93,8 93,3 92,0 92,0 87,5 Sea Sicily 20,9 27,5 28,7 30,3 32,5 Italy 4,6 4,7 6,0 6,0 9,5
Source: AnnuarioStatistico ISTAT
Oil products transport is not included in the in our analysis since by nature it uses to have a different logistic channels and a peculiar relation to the carriage of other goods. The objective of our work is to examine which policies could be implemented in order to rebalance the transport of goods among different modes.For this reason, we have decided to estimate and observe solely the transport of those goods which could be transported either by sea or by land.
Sicily is affected by a chronic delay in structural railway modernization, so we have decided to focus our analysis on the factors that can push towards a rebalancing between sea and road transport(Carlucci et al., 2017a).
In the following section we will define the trade of goods moved both by land and sea as “contestable traffic” in order to highlight that sea transport appears to be more competitive with road transport only over long distances. Road is the prevailing mode for short-haul transport (less than 500 kilometres), whereas the combined transport, road-sea, is the preferred way to reach Central and Northern Italian regions.
3. An econometric analysis of the demand for maritime transport in Sicily
The strand of literature ascribed to the Public Choice, has used models where the variable related to the size of freight transport appears to be an endogenous variable
European Transport \ Trasporti Europei (2017) Issue 64, Paper n° 5, ISSN 1825-3997
explained by a combination of other macroeconomic variables. Our study aims at identifying and measure the determinants of cargo in the Sicilian ports, pointing out any possible links with the factors mentioned frequently in the economic literature(Marcucci, 2013; Santos and Soares, 2016). This will require deployment of an empirical approach based on the estimation of a reduced form equation with observations both in space and in time, in which the dependent variable is the amount of traffic in ports, while among the independent variables there were included appropriate indicators which capture the main economic determinants of the Region.
The use of a pooled analysis of data referring to both spatial and temporal observations need the use of an econometric methodology known as Panel Data (Hsiao, 1986; Klevmarken, 1989; Solon 1989). The decision to rely on this technique can be explained taking into consideration the following advantages:
1. The ability of analysing individuals for heterogeneity. The panel data, indeed, suggests that individuals, companies, states or regions are heterogeneous with each other. Furthermore, following the time series or cross-sections analysis rules it seems impossible to capture the heterogeneity mentioned before, risking to get so distorted results. The heterogeneity characterizing the considered subjects, therefore, represents a focal point analysis.
2. Panel data are able to provide more information, higher variability, lower collinearity between variables, more degrees of freedom and greater efficiency. Studies based on time series suffered multicollinearity problems. It is less likely to occur with panel includingsectional data, since space dimension (cross-section) adds a higher variability increasing data information performance. Having more data available and therefore more information,it is possible to produce more reliable estimates on parameters.
In brief, panel data are characterized by a lower impact of multicollinearity, which is a phenomenon occurring when two or more independent variables are highly correlated. In case of perfect correlation, the independent variables are linearly dependent, violating, in this case, one of the classical linear regression model assumptions. Although this is still rare, the so-called imperfect multicollinearity is much more common and it can cause substantial problems.
An estimated parameter informs us about the impact of the independent variable on the dependent variable holding the other independent variables constant. If two variables
are significantly related in a database, regardless of variation, it will become impossible to distinguish between them; it is becoming increasingly difficult to estimate the coefficient model.
4. Function estimation of traffics in Sicilian ports
The model specification is inspired from a vast body of literature on the goods transport determinants. Model variables choice is based essentially on economic theories born over recent years that were aimed at identifying the social and economic determinants of commercial traffic (see, inter alia, Stopford, 1997).
The study covers the period ranging from 2005 to 2015, dealing with 90 observations distributed over the whole Sicily. In this respect it should be noted that the attention was focused on time period beyond 1995 because of the following reasons:
i)it was tried to bypass the problem of the lack of data, resulting from the impossibility of finding data, for some variables (income, consumption and number of companies), prior to 2005;
ii) it was decided to focus on the years following the 1994 reform (Law 84/94), which founded the Port Authority, determining a new economic scenario for Sicilian ports.
4.1 The dependent variable
The first issue to be dealt with in order to carry out an econometric model is the dependent variable choice.
For the present work, it has been decided to use the number of tons of cargo handled yearly in each port. The source of data for this variable is the statistical publications of Port Authority of Palermo.
For the descriptive statistics, it was decided to create three different dependent variables: the tons of goods unloaded per year, tons loaded per year, the total unloaded and loaded freight.
Subsequently, in the regression model, we have used only the total of goods loaded and unloaded.
It has been taken into account seven of the nine Sicilian provinces. The province of Enna was not included in the analysis due to the absence of a port. Likewise, the
Eur provi Pozz Endo provi P T P M A C C S Data local requi regio The b the i const value betw term ropean Tran ince of Rag zallo) are av ogenous var ince accord PROVINCE Trapani Palermo Messina Agrigento Caltanissetta Catania yracuse a do not inc l needs. Th irements an on. basic equati indices i, t, tant and, as e; β is the ween each i s, it represe nsport \ Tras gusa was ex vailable only riables wer ding to the fo ES POR Cast Pale Mes Port a Gela Cata Syra clude oil pr he trade in nd, for this ion to evalu j refer res s β, this pa coefficient independent ents the slop
sporti Europ xcluded sinc y for 2014. re generated following m Tabl RTS tellammare d ermo, Termin ssina, Milazzo to Empedocl a ania, Riposto acuse, Augus roducts sinc energy pr reason, it h uate can be e spectively t arameter ha ts value to t variable X pe of the reg pei (2017) I ce the data p As a result, d by adding model: le 2 – Sicilian M del Golfo, Tr ni Imprese o le, Licata o ta ce the amou roducts is s has few lin
expressed in to province as to be ev estimated Xjand the gression line Issue 64, Pa pertaining to observation g the traffic Maritime Ports rapani, Marsa unt of these strictly con nks with the n the follow e, year, inde valuated and and it rep dependent e, and u is th aper n° 5, IS o the major ns number h c ports loca s ala, Mazara d e trades cann nnected to t e domestic wing linear f ependent v d it represe presents the variable Yi he error term SSN 1825-3 r port (the p has fallen to ated in the del Vallo not be relat the internat economy o form: ariable; α i ents the inte e incidence Yi. In geom m. 3997 ort of o 70. same ted to tional of the is the ercept ratio metric
4.2 The explanatory variables
Explanatory variables included in the regression model, which have been suggested by most of the literature on the determinants of goods transport, are the following:
Population (source: ISTAT); Income (source Prometeia data); Expenditures (source: Prometeia data); Added value (source: Prometeia data); Companies (source: Movimprese)
According to economic theory, the sign of these variables is expected to be positive. There should be a positive relationship between performance of commercial traffic and the evolution of the considered variables.
As for the construction of the variables in the model, the added value has been detected separately taking into consideration the three main economic sectors (agriculture, industry, services).
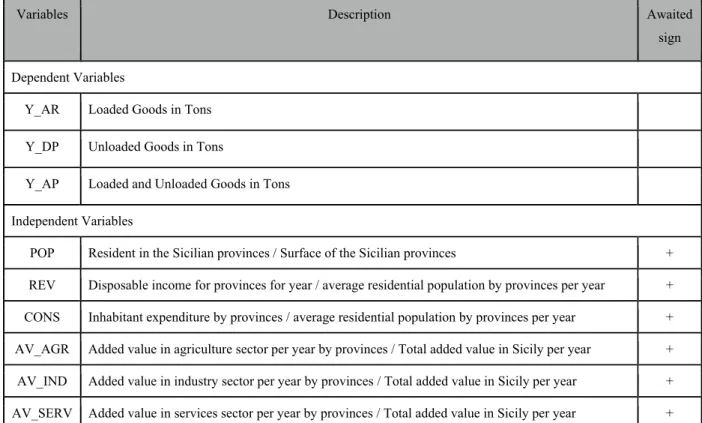
The following table describes the used variable and its awaited sign.
Table 3 – Used Variables
Variables Description Awaited
sign Dependent Variables
Y_AR Loaded Goods in Tons Y_DP Unloaded Goods in Tons
Y_AP Loaded and Unloaded Goods in Tons Independent Variables
POP Resident in the Sicilian provinces / Surface of the Sicilian provinces + REV Disposable income for provinces for year / average residential population by provinces per year + CONS Inhabitant expenditure by provinces / average residential population by provinces per year + AV_AGR Added value in agriculture sector per year by provinces / Total added value in Sicily per year + AV_IND Added value in industry sector per year by provinces / Total added value in Sicily per year + AV_SERV Added value in services sector per year by provinces / Total added value in Sicily per year +
European Transport \ Trasporti Europei (2017) Issue 64, Paper n° 5, ISSN 1825-3997
Variables Description Awaited
sign N_COMP Number of companies per year by provinces / Total number of companies in Sicily per year +
4.3 Statistical analysis of the descriptive model
At the beginning, it has been estimated the correlations among exogenous variables and individual endogenous variables in the whole Sicilian region. It has been tried to detect the existence of links between the performance of goods traffic in the Sicilian ports and the development of each variable.
The table below shows which kind of correlations is possible to find in Sicily:
Table 4 – Correlation matrix
Correlations Y-X
POP REV CONS AV_AGR AV_IND AV_SERV N_COMP
Y_AR 0,78 0,44 0,47 0,38 0,82 0,78 0,48
Y_DP 0,40 0,54 0,54 0,32 0,50 0,42 0,23
Y_AD 0,68 0,54 0,53 0,41 0,75 0,68 0,40
Given that the correlation takes values between -1 and 1, goods traffic in Sicily seems linked mostly to the trend of the population, and to the performance of industry and service sector. In particular, the highest correlation is obtained with the variable quantifying the level of landings (Y_ARR). As already noted, this fact can be explained considering that a negative trade balance has always affected Sicily in recent years. Sicilian economy is characterized by the predominance of imports that has a positive effect on landings performance in the region’s port.
Looking at the data it is possible to notice that the agricultural sector is poorly linked with the development of commercial traffic. However, analysing traffics breakdown, it is possible to notice a significant movement of agricultural products (representing 5% of boarding and 10% of landings, excluding oil products). As matter of fact, the available data, especially regarding the industry added value, does not allow to find any links among agricultural production and goods transport in the Sicilian ports.
The varia al., 2 indus magn to sh 4.4 R After Com traffi two. Acco inter varia It is mode abou coeff now impo remo incom varia the g Even prob consi effec YAD low correla able is not 2016). Num strialization nitude, the r how a compr Results and r the descr mpared to th ics develop ording to t action betw able behavio needed now el. In the la ut the crite ficients wer it is used a ortant for th oved. In so mplete spe ables in diff general to th n this appr ability for t idered sign cts model). C Table 5 D1POP ation with th a reliable p mber of com n. It has t risk attitude rehensive fr d comments riptive anal e previous pment and v the present ween all va our. Therefo w to give a ast twenty y ria for inc re estimated a different a he explanati ome of his ecification o ferent mome he ‘specific roach has b the first erro nificant. The Characterist - Summary S OP2INC he number proxy of the mpanies can to be cons e, easier acc ramework o s lysis, it wa analysis, th variables ta t model, in ariables des
ore, the com
attention to years, there clusion of d including approach in on of the ph works, He of the mo ents. The m model’, tak been critici or type (5% e model wa tics of the m Statistics Least 3CONS of compani e province nnot be cons sidered als cess to credi of the busine as running he aim of th aking into c ndeed, tran cribed abov mplete mode the variab has been a a variable g explanator which all t henomenon endry (199 del, can le most attractiv king out grad ized since %), it is like as initially model are sh t Squares with 4AVAGR ies is proba industrializ sidered a go so type of it and all th ess situation the regres his analysis consideratio nsportation ve rather th el to estimat les inclusio a radical ch in the mo ry variables the explanat n and then n 5) showed ead to imp ve strategy t dually the l in a wide ly that som processed hown below h Group Dumm 5AVIND ably due to zation degre ood measure f companie hose variabl n in the prov sion using is to define on combine of goods han the sin te is the foll on process w ange of eco odel. Indee s in the mo tory variabl non-signific that errors proper outc turns out to ess significa e model, a me variables with LSDV w: my Variables 6AVSERV
the fact tha ee(Ambrosi e of the pro es, the bus
eswhich are vince. the panel e the link am ed effects o depends on ngle indepe lowing: within the onometric th ed, while b odel one by les consider cant variable s resulting comesby ad o be the one ant variable dopting a may mista V method ( Model 1 V7NCOM at this ino et ovince siness e able data. mong of the n the ndent panel heory before y one, red as es are from dding from es. fixed kenly (fixed MP u
European Transport \ Trasporti Europei (2017) Issue 64, Paper n° 5, ISSN 1825-3997
REGRESS; Lhs=Y_AP; Rhs= ONE, POP, REV, CONS, AV_AGR, AV_IND, AV_SERV, N_COMP Dep. var. = Y_AD Mean= 14.55937339, S.D.= 0.7490532367
Residuals: Sum of squares = 3.204629318, Std. Dev. = 0.23922 Model size: Observations = 70, Parameters = 14, Deg.Fr.= 56
Number of parameters to be evaluated is equal to 14. In order to identify which parameter will be included in the fixed effects model it is needed to take into consideration both those parameters related to exogenous variables (they amount to eight in which “ONE” is the constant variable ), those parameters associated with the six (N-1) dummy variables of the model. This aspect is important since it marks the main difference between the fixed effects model and the random-effects.
Number of parameters included in the model is crucial in order to determine the degrees of freedom that, in our case, are equal to 56.
The present model is able to explain around the 89% of the variability of the dependent variable (the logarithm of tons of goods loaded or unloaded); in other words, the model is statistically correct, since the overall significance is very high (Adjusted R-squared = 0.89801).
The relevance of the model, furthermore, has been tested through the F-test, taking into consideration 13 explanatory variables (corresponding to k-1, ie 8 + 6-1) and 56 degrees of freedom. The F-test is useful in order to ‘test’ the explanatory power with respect of all variables included in the model. The null hypothesis for which all the coefficients of the model become simultaneously zero is rejected at the significance level of 1% since the F-test falls clearly into the rejection areas(Prob. value = 0).
Fit: R-squared = 0.917224, Adjusted R-squared = 0.89801 Model test: F[ 13, 56] = 47.73, Prob. value = 0.00000
To determine the extent of the exogenous variables coefficients it is needed to find the best regression model running two statistical tests: the Lagrange multiplier and the Hausman test. The first test makes a comparison between the classical model (OLS) and fixed effects models (FEM) and variable effect model (REM).
Lagrange Multiplier Test vs. Model (3) = 3.86 (1 df, prob value = .049570) Fixed vs. Random Effects (Hausman) = 8.59 (7 df, prob value = 1.000000)
The Effec More to be A The coeff It ha signi This indus The freed depe very rejec p-value of t ct and the eover, the H e the one wi Variable POP REV CONS AV_AGR AV_IND AV_SERV N_COMP Constant outcomes ficients (p-v as been pos ificant varia regression strial sector results pro dom) point ndent varia high (Adj ction areas ( the Lagrang Random E Hausman tes ith variable Coefficie - .875 - .8807 2.564 .1997 1.319 .3235 - .1122 - 14.27 show that value greate sible to obt ables and b combines g r added valu ovided by t out that the able: the mo justed R-sq (Prob. value Y ge multiplie Effect Mod st shows a p effects. The ents S 1669629 7890295 4106686 7584334 9912016 5499055 2336888 7322257 the signif er than 0.05) tain a final by running goods loade ue. the fixed e e estimated odel is still quared = 0 e = 0). YAD er is lower dels have t p-value hig e outcomes tandard Error 1.3177662 1.6602227 1.4720102 .23687595 .44489770 .5227041 .2799452 5.8716517 ficance leve ). l regression a new regr ed and unlo effects mod model exp statistically 0.89627).Fu 1CONS than 0.05, w to be prefe her than 0.0 are the foll
r b/St.Er. 2 -664 7 -531 2 1.742 5 843 0 2.967 1 619 1 -401 7 -2.431 el is low f n by elimina ression with oaded, the c del (9 para plains the 89 y correct, as urthermore, 2AVIND which mean erred to th 05: the best owing: P[|Z|>z] .5066 .5957 .0815 .3991 .0030 .5359 .6885 .0151 for most o ating progr h the remai consumptio ameters and 9% of the v s the overal , the F-tes u ns that the F he classical t model turn Mean of X 5.262342 9.198848 9.114496 8.512711 9.929144 11.36414 2.790779 of the estim essively the ning coeffi on value, an d 61 degre variability o ll significan st falls into Fixed one. ns out X 26 88 67 10 45 49 91 mated e less cient. nd the es of of the nce is o the
European Transport \ Trasporti Europei (2017) Issue 64, Paper n° 5, ISSN 1825-3997
Summary Statistics Least Squares with Group Dummy Variables Model 2 REGRESS; Lhs =Y_AD; Rhs = ONE, CONS, AV_IND; Panel Model
Dep. var. = Y_AD Mean = 14.55937339, S.D. = .7490532367 Model size: Observations = 70, Parameters = 9, Deg.Fr.= 61 | Residuals: Sum of squares = 3.550103906, Std. Dev. = .24124
Fit: R-squared = .908301, Adjusted R-squared = .89627 Model test: F[8, 61] = 75.53, Prob. value = .00000
The Hausman test shows a high p-value (greater than 0.05) for which the best model for the coefficients estimation is the variable effects model.
Fixed vs. Random Effects (Hausman)=3.74(2 df, prob. value = .154105) (High(low)values of H favour FEM (REM))
Variable Coefficient Stand. Error b/St.Er. P[|Z|>z] Mean of X CONS 1.595146 .24785234 6.436 .0000 9.11449 AV_IND 1.246622 .22759106 5.477 .0000 9.92914 Constant -12.3574 3.7387593 -3.305 .0009
The β coefficients are significant and they turn out to be 1.59 for consumption and 1.24 for the industry added value. There are no specific effects relative to each port since variables included in a REM model allow to explain the observed phenomenon (in this case the goods traffic in the Sicilian ports) in its entirety without considering any specific characteristics of each unit (ports).
Correlation analysis had shown a link between goods transport and data on population. The evaluation of the regression model, instead, disaffirms those conclusions. This is established by studies carried out in recent years (among others Stopford, 1997) which highlighted the lack of connection between the data on population and the amount of goods transport.
From the outcomes above, it is possible to state that the variables sign evaluated is in line with the literature.
Moreover, the level of significance of the variables in the model is substantially unchanged from the full model which was initially analysed. Therefore, removing non-significant variables, from a statistical point of view, it is possible to confirm the validity of the estimated model in order to obtain a coefficients evaluation consistent with the predictions of the empirical model specified by the most recent literature about the determinants of goods traffic. The industrial sector added value and the level of consumption are therefore the two variables able to influence the transport of goods in the Sicilian ports.
An analysis of the breakdown of maritime traffic (excluding oil products) reveals the presence (about 30% of the cargo handled) of coal, iron, chemicals and building materials, thus highlighting the strong link between the production of the industrial sector and the amount of traffic in the ports of Sicily.
In the last years, incomes and consumptions follow substantially the same growth trend. Nevertheless, only the consumptions variables affect the commercial traffic. This is because the incomes variables include both consumption and savings. In recent years, Studies published by the Bank of Italy (2003) have shown an increase in the propensity to save in Sicily. However, the income level in the region is not related to the goods transport, sincesaved money is not necessary spent on the goods traffic.
5. Conclusions
The framework resulting from our analysis shows a strong imbalance in terms of goods loaded and unloaded in the ports of the Sicilian Region. Goods loaded are about 40% less than goods unloaded. The difference above leads to a significant decrease in the load factor on a ship along the shipping route and, as such, an increase in average costs per mile relating to each loaded container(Albanese et al., 2013).
This phenomenon is due the Sicilian economy characteristics which are highly dependent on production of other regions. This analysis is confirmed by the study of influencing variables on the maritime transport demand which are strongly linked to the consumption level of the population and the regional companies capacity, whose proxy is given by the industry added value (AV_IND). Demand for transportation is directly
European Transport \ Trasporti Europei (2017) Issue 64, Paper n° 5, ISSN 1825-3997
proportional to the consumption of the population since local companies are not able to afford the increase in consumption.
The positive correlation between maritime transport demand and industry added value deserves further study, although it can be state that it probably depends on local businesses need of raw materials from the rest of the world. Therefore, the increase of the added value is caused by an increase both in the local businesses activity and in the imported raw materials requirements. The analysis for each province of goods exported highlights even that in Sicily high added value goods are mainly allocated to the external market (cars and electronic components). Based upon this arguments, it is possible to state that the Sicilian market is unlikely to know some mechanism aiming at bringing a balance between loading and unloading goods since the Sicilian market of goods is structurally heavily depended on the foreign market. It becomes paramount to think about an overall reorganization of the regional logistics, including as well the trans-shipment activities along with the creation of a hub port(Marcucci, 2014). This option would make the maritime transport in Sicily more convenient and competitive, while improving the whole maritime Mediterranean transport network system (Carlucci and Cirà, 2013). Taking advantage of the unused transportation capacity on round trips from the island, while at the same time making Sicily part of a broader port network, it would be possible to create economies of density which would make the average cost of shipping more convenient(Douet and Cappuccilli, 2011).
References
Albanese, M., Cusano, M. I., Ferrari, C. and Tei, A. (2013). “West Med Short Sea Shipping: from point to point to multi-call services”, Economics and logistics in
short and deep sea market: Studies in honor of Guido Grimaldi Founder Grimaldi Group. FrancoAngeli, 25-44.
Ambrosino, D., Ferrari, C., Sciomachen, A. and Tei, A. (2016). “Intermodal nodes and external costs: Re-thinking the current network organization”, Research in
Transportation Business & Management, 19, 106–117.
Arbolino, A., Carlucci, F., Cirà, A., Ioppolo, G., Yigitcanlar, T. (2017). “Efficiency of the EU regulation on greenhouse gas emissions in Italy: The hierarchicalcluster analysisapproach”, EcologicalIndicators, 81: 115-123. doi:
10.1016/j.ecolind.2017.05.053.
Cariou, P., Ferrari, C. and Parola, F. (2014). “Addressing special challenges in maritime and port logistics”, Maritime Policy & Management, 41(5), 425–429.
Carlucci, F., Cirà, A. (2013). “Macroeconomic Impact of Maritime Transport: Opportunities for Western Mediterranean Countries”.Economics and logistics in
short and deep sea market: Studies in honor of Guido Grimaldi Founder Grimaldi Group. FrancoAngeli, 101-112.
Carlucci, F., Cirà, A., Forte, E., Siviero, L.(2017a). “Infrastructure and logistics divide: regional comparisons between North Eastern &Southern Italy”. Technol. Econ. Dev.
Econ. 23, 243–269. doi:10.3846/20294913.2015.1070768.
Carlucci, F., Cirà, A., Immordino, G., Ioppolo, G., Yigitcanlar, T.(2017b). “Regional heterogeneity in Italy: Transport, devolution and corruption”. Land Use Policy 66, 28–33. doi:10.1016/j.landusepol.2017.04.020.
Castells, M., Usabiaga, J. J. and Martìnez, F. (2014). “Road and maritime transport environmental performance: short sea shipping vs road transport”, Journal Of
Maritime Research, 9(3), 45–54.
Douet, M. and Cappuccilli, J. F. (2011). “A review of short sea shipping policy in the European Union”, Journal of Transport Geography. 19(4), 968–976.
Forte, E. (2013).Economics and logistics in short and deep sea market: Studies in honor
of Guido Grimaldi Founder Grimaldi Group. FrancoAngeli.
Hendry D. (1995). “Dynamic Econometrics”, Oxford University Press. Hsiao C. (1986). “Analysis of Panel Data”, CUP.
InfocamereMovimprese, (2016). Accessed May 30, 2016. http://www.infocamere.it/
ISTAT (2016). “Annuariostatisticoitaliano”, Accessed May 30, 2016. https://www.istat.it/it/archivio/194422
Klevmarken, N. A. (1989). “Panel studies: what can we learn from them? Introduction”.
European Economic Review, 33: 523-529.
Lee, C. B., Wan, J., Shi, W. and Li, K. (2014). “A cross-country study of competitiveness of the shipping industry”, Transport Policy, 35, 366–376.
Marcucci, E. (2013). “Logistics Managers? Stated Preferences for Freight Service Attributes: A Comparative Research Method Analysis”, in Freight Transport
Modelling. Emerald Group Publishing Limited, 13-251.
doi:10.1108/9781781902868-013.
Marcucci, E. (2014). “Regulating Transport in Europe”, Regional Studies. Routledge, 48(7), 1308–1309. doi: 10.1080/00343404.2014.923680.
Medda, F. and Trujillo, L. (2010). “Short-sea shipping: an analysis of its determinants”,
Maritime Policy & Management, 37(3), 285-303.
Prometeia, (2016).Rapporto di previsione.
Santos, T. A. and Soares, C. G. (2016). “Modeling transportation demand in short sea shipping”, Maritime Economics & Logistics. Springer.
European Transport \ Trasporti Europei (2017) Issue 64, Paper n° 5, ISSN 1825-3997
Solon G., (1989). “Biases in the estimation of intergenerational earnings correlations”,
Review of Economics and Statistics, 71(1): 172-174.