Facoltà di Medicina Veterinaria
XXIII ciclo di Dottorato di ricerca in
“Produzioni animali sanità ed igiene degli alimenti
nei Paesi a clima mediterraneo”
MORPHOLOGICAL AND HISTOLOGICAL CHANGES OF CHICK
AND DUCKLING SMALL INTESTINE DURING PREHATCH AND
POSTHATCH PERIOD
CAMBIAMENTI MORFOLOGICI ED ISTOLOGICI DELL’INTESTINO TENUE DEL PULCINO E DELL’ANATROCCOLO DURANTE IL PERIODO PRE-SCHIUSA
E POST-SCHIUSA
Settore Scientifico Disciplinare AGR20
Dottorando
Tutor
Bao An Ding
Prof.ssa Isabella Romboli
Presidente del Dottorato
Prof. Domenico Cerri
Contents
Contents ... 1
Summary ... 2
Riassunto ... 5
Chapter 1- Morphological and histological changes of the small intestine of Ovambo chicks during prehatch and posthatch period ... 8
Introduction ... 8
Morphology ... 8
Histology ... 11
Purpose ... 12
Materials and Methods ... 13
Birds ... 13
Sample processing ... 13
Staining procedure ... 13
Hematoxylin and eosin and Alcian blue ... 13
Grimelius ... 14
Measurement and analysis ... 14
Results ... 15 Morphology ... 15 Histology ... 20 Discussion ... 26 Morphology ... 28 Histology ... 30
Chapter 2- Comparison of the small intestinal morphology of two lay hen breeds during prehatch and posthatch ... 33
Introduction ... 33
Purpose ... 34
Materials and Methods ... 34
Results ... 35
Discussion ... 39
Chapter 3- Morphological and histological changes of the small intestine of Muscovyducklings during prehatch and posthatch ... 41
Introduction ... 41
Purpose ... 48
Materials and Methods ... 48
Birds and tissue preparations ... 48
Morphometry ... 48
Histochemistry ... 49
Immunohistochemystry ... 49
Measurement and analysis ... 50
Result ... 50 Morphology ... 50 Histology ... 53 Discussion . ... 68 Morphology ... 68 Histology ... 70
Chapter 4- Effect of hens diet supplemented with Vitamin D3 or Vitamin E on the development of small intestinal morphology of chick ... 76
Introduction ... 76
Purpose ... 78
Materials and Methods ... 78
Birds Management and Treatments ... 78
Results ... 79
Discussion ... 90
Reference ... 93
Summary
Growth and performance parameters of chicks and ducklings depend on adequate development of the small intestine during prehatch and posthatch period. So morphological and histological parameters of this part are important indexes to describe the small intestinal development of the chicks and ducklings and, consequently, allow future growth capacity prediction. On the other hand, embryo development of small intestine could be affected by feed composition given to hen during egg laying. Therefore, it should be of great importance to extablish if maternal diet manipulation could positively influence chicken small intestine maturation. In order to better understand some aspects of this subject different trials were peformed.
The objective of the first study was to investigate the morphological and histological changes of small intestine in different poultry species and breed during prehatch and posthatch period. In chicks all parameters studied (intestinal wall thickness, villi height, width and perimeter, crypt depth, Goblet cell numbers and argyrophil cell numbers) show an evident increase during prehatch and posthatch. Some differences has been observed comparing different parts of small intestine in the same breed or between breeds.
In Ovambo chicks, intestinal wall thickness at E15 presented the lowest value in the ileum and the highest in the duodenum. Villi height of duodenum increased more rapidly than either jejunum or ileum from E17. Villi width increased from E19 to 9day in the three sections. The perimeter of villi increased in the duodenum from E19 to 2d and from 7d to 9d; in the jejunum and ileum from E19 to hatch and from 2d to 9d. Crypt depth progressively increased in the three intestinal segments from hatch to 7d. PAS/AB Positive goblets cells increased in the duodenum and jejunum from E19 to 7d while they increased in the ileum throughout E19 to 9d. The density of agyrophil cells was highest in the duodenum and jejunum at hatch, while in the ileum the highest density value was at 2d.
Comparing Leghorn and Ovambo chicks from hatch to 9d, duodenum and ileum intestinal wall of Leghorn resulted greater than that of Ovambo. On the contrary, the latter had longer villi than that of Leghorn from E15 through 7d in the duodenum and ileum and from E19 through 9d in the jejunum. Moreover Ovambo had a significantly greater width of villi in the
duodenum from hatch through 9d and in the jejunum at hatch and at 9d; the perimeter of villi was consistently higher in the duodenum and jejunum from E19 through 9d. Likewise duodenum crypt width in Ovambo was wider than that in Leghorn at 2d and 9d.
In Muscovy duckling, the height and width of small intestinal villi significantly increased with age. Villi number slightly increased from E24 to 2d, but there was a rapid decrease from 2d to 13d.
There were significant differences in the villi perimeter of duodenum and jejunum between E30 and hatching day, 2d and 9d, 9d and 13d. Increases in crypt depths were significantly affected by age from hatching in the duodenum and between hatching and 2d in the jejunum. Crypt width increased significantly only between hatching day and 2d.
In the duodenum and jejunum the V:C ratio peaked at hatching, and decreased from hatching to 2d.
AB/PAS-positive goblet cells appeared on the villi and crypts of the duodenum and jejunum at 30E, and in the ileum at hatching. The AB-positive cells, compared with the PAS-positive cells, predominated in villi and crypts of the three segments, moreover the rate of AB-positive cells to PAS-positive cells significantly decreased from 30E to 9d. The argyrophil and goblet cells distribution was variable over the length of the small intestine from embryonic day 24E to post-hatching day13d. In the duodenum the density of agyrophil cells was highest at hatching, while in the jejunum and in the ileum the highest density value was at hatching and 13d. Throughout the small intestine and in the pancreas, NPY immunoreative cells were detected from E24.
PP positive cells were observed in the pancreas from E24, in the duodenum and jejunum from E30 and in the ileum from hatch. GLP-1 positive cells were observed in the pancreas and jejunum at E24 and in the duodenum and ileum at E30. Gastrin releasing peptide positive cells were first seen in the distal duodenum at E30 while in the proximal duodenum at hatch and in the jejunum at 9d, however they did not appeared in the pancreas.
PACAP positive cells were primarily observed in the jejunum and ileum at E30 and in the duodenum at hatch.
The objective of the second study was to evaluate the effects of maternal diet supplemented with vitamin D3 (VD) and vitamin E (VE) on the development of the small intestine of
Ovambo chicks during prehatch and posthatch period. VD body weight was heavier (7.1 mg) than the control (C) at hatch. VD Intestinal weight was lighter (1.45 mg) than the Control at 7 days after hatch, however, the thickness of intestinal muscle layers in the C were higher than that in VD at 2 d and 7d. Villi height was obviously higher in the VD group in the duodenum and ileum at hatch, 2d and 7d, in the jejunum at E15, hatch and 2d. Villi height of VE was higher than that of C, respectively at hatch and 2d in duodenum and at 2d in jejunum.
At E15 villi width in the VD group was higher than that in the C group in the duodenum, jejunum and ileum. Villi perimeter of VD was higher than that of C in the duodenum at E15 and E19, in the jejunum at hatch and in the ileum at 7d.
These results contribute to better understand the pattern of the morphological and histological changes of small intestine in Muscovy duck and in two different chicken breeds. Moreover, our findings suggest the effect of vitamin D and E supplemented maternal diet on the morphological changes of the small intestine in chicks.
Riassunto
I parametri di crescita e di performance dei pulcini e degli anatroccoli dipendono da un adeguato sviluppo dell’intestino tenue. I parametri istologici e morfologici sono indici importanti per descrivere lo sviluppo del tenue del pulcino e dell’anatroccolo durante la fase di pre-schiusa e post-schiusa e, conseguentemente, possono fornire indicazioni sulla sua futura capacità di accrescimento. Parallelamente risulterebbe particolarmente importante verificare se, attraverso una manipolazione della dieta materna, sia possibile influire positivamente sul processo fisiologico di maturazione dell’intestino del pulcino. Allo scopo di fornire un contributo alla conoscenza di queste tematiche, sono state realizzate due diverse sperimentazioni.
L’obbiettivo del primo studio è stato quello di investigare i cambiamenti morfologici ed istologici del tenue di due specie avicole e di due razze di pollo prima e dopo la schiusa. Nei pulcini Ovambo allo stadio E15, lo spessore della parete intestinale presenta il valore più basso nell’ileo mentre il più alto nel duodeno. Da E17 l’altezza dei villi del duodeno aumenta più rapidamente di quanto osservato sia nel digiuno che nell’ileo. La larghezza dei villi, da E19 a 9 giorni, aumenta similmente nei tre segmenti. Il perimetro dei villi del duodeno aumenta da E19 a 2 giorni e da 7 giorni a 9 giorni, mentre nel digiuno e nell’ileo da E19 fino alla schiusa e da 2 giorni fino a 9 giorni.
Dalla schiusa a 7 giorni di età, la profondità delle cripte aumenta progressivamente nei tre segmenti del tenue. Le cellule mucipare PAS/AB positive aumentano nel duodeno e nel digiuno da E19 a 7 giorni e diminuiscono da 7 giorni a 9 giorni, mentre nell’ileo aumentano da E19 a 9 giorni. Alla schiusa la densità maggiore delle cellule argirofile si osserva nel duodeno e nel digiuno, mentre nell’ileo il valore di densità maggiore si osserva a 2 giorni. Comparando i pulcini Ovambo e Livorno, la parete intestinale dei Livorno è risultata più grande di quella degli Ovambo nel duodeno e nell’ileo dalla schiusa a 9 giorni. Gli Ovambo hanno villi più lunghi di quelli dei Livorno nel duodeno e nell’ileo da E15 fino a 7 giorni e nel digiuno da E19 fino a 9 giorni. Gli Ovambo hanno anche una larghezza dei villi significativamente maggiore nel duodeno dalla schiusa fino a 9 giorni e nel digiuno alla schiusa e a 9 giorni. Il perimetro dei villi degli Ovambo è maggiore di quello dei Livorno nel duodeno e nel digiuno da E19 fino a 9 giorni. La larghezza delle cripte degli Ovambo è
maggiore di quella dei Livorno nel duodeno a 2 giorni e a 9 giorni.
Nell’anatroccolo di anatra Muschiata, l’altezza e la larghezza dei villi del tenue aumentano in maniera significativa con l’età. Il numero dei villi aumenta di poco da E24 a 2 giorni, ma c’è una rapida diminuizione da 2 giorni a 13 giorni. Ci sono differenze significative nel perimetro dei villi del duodeno e del digiuno tra E30 e la schiusa, 2 giorni e 9 giorni, 9 giorni e 13 giorni. Aumenti della profondità delle cripte sono influenzati dall’età nel duodeno tra la schiusa e 2 giorni, 2 giorni e 9 giorni e nel digiuno tra la schiusa e 2 giorni. La larghezza delle cripte aumenta in maniera significativa solo tra la schiusa e 2 giorni. Nel duodeno e nel digiuno il Villi:Cripte ratio presenta il picco alla schiusa, e diminuisce dalla schiusa a 2 giorni. Le cellule mucipare AB/PAS-positive appaiono nei villi e nelle cripte del duodeno e del digiuno a E30, e nell’ileo alla schiusa. Le cellule AB-positive, confrontate con quelle PAS-positive, predominano nei villi e nelle cripte dei tre segmenti, inoltre il tasso delle cellule AB-positive/PAS-positive diminuisce significativamente da E30 a 9 giorni. La distribuzione delle cellule mucipare ed argirofile varia per tutta la lunghezza del tenue da E24 a 13 giorni dopo la schiusa. Nel duodeno la densità delle cellule argirofile è più alta alla schiusa mentre nel digiuno e nell’ileo la più alta densità è alla schiusa e a 13 giorni. In tutto il tenue e nel pancreas, sono state trovate cellule NPY-immunoreattive ad iniziare da E24. Cellule positive al PP sono state osservate nel pancreas da E24, nel duodeno e nel digiuno da E30 e nell’ileo dalla schiusa. Cellule GLP-1 immunoreattive sono state osservate nel pancreas e nel digiuno a E24 e nel duodeno e nell’ileo a E30. Cellule immunoreattive al peptide di rilascio della gastrina sono state trovate nel duodeno distale ad iniziare da E30 mentre nel duodeno prossimale alla schiusa e nel digiuno a 9 giorni. Infine nel pancreas non sono state individuate. Cellule PACAP immunoreattive sono state osservate principalmente nel digiuno e nell’ileo a E30 e nel duodeno alla schiusa.
L’obbiettivo del secondo studio è quello di valutare l’effetto della dieta materna arricchita con vitamina D3 (VD) e vitamina E (VE) sullo sviluppo del tenue dei pulcini Ovambo durante il periodo di pre-schiusa e post-schiusa.Alla schiusa il peso del corpo dei pulcini provenienti da galline alimentate con VD (PVD) è in media 7.1 mg maggiore di quello dei controlli (C). A 7 giorni dopo la schiusa il peso dell’intestino dei PVD è in media 1.45 mg minore di quello dei C. Inoltre a due e sette giorni dopo la schiusa lo spessore dello strato muscolare dell’intestino
dei controlli era maggiore di quello dei PVD. L’altezza dei villi è risultata maggiore nel gruppo dei PVD nel duodeno e nell’ileo alla schiusa, a 2 giorni e a 7 giorni mentre nel digiuno a E15, alla schiusa e 2 giorni. La larghezza dei villi nel gruppo dei PVD è maggiore di quella del gruppo C nel duodeno, digiuno e ileo a E15. Il perimetro dei villi dei PVD è maggiore di quello dei C nel duodeno a E15 a E19, nel digiuno alla schiusa e nell’ileo a 7 giorni.
Con la presente ricerca si è cercato di fornire un contributo alla conoscenza dei cambiamenti morfologici ed istologici dell’intestino tenue dell’anatra muschiata e di due razze avicole nella fase terminale dello sviluppo. I nostri risultati suggeriscono inoltre la possibilità di influire sullo sviluppo dell’intestino tenue del pulcino attraverso l’integrazione di vitamina D nella dieta della gallina.
Chapter 1- Morphological and histological changes of the small intestine of Ovambo chicks during prehatch and posthatch period
Introduction Morphology
In avian species, development and growth partly depend on the capacity to digest and assimilate nutrients in small intestine. The development of small intestine is a critical factor to digest and assimilate nutrients. Development of the small intestine is comprised of three stages: (1) morphogenesis and cell proliferation, (2) cell differentiation, and (3) functional maturation. The function of intestine has relationship with its development and maturation. This has been proved by many researchers who reported that during development differences in intestinal function may arise, in part, from anatomical changes (Buddintong and Diamond, 1989; Ruttanavut et al., 2009).
Functional maturation of the small intestine involves both morphological and physiological changes and is the primary constraint to optimal early growth of birds (Konarzewski et al., 1990). Moreover, Ferraris (1989) demonstrated that the anatomical factors make such a significant contribution in D-glucose transport capacity that they should be considered with a similar importance as the kinetic properties of the transport systems. In the gastrointestinal tract, enzymatic activity and nutrient absorption capacity are reported to be closely correlated with morphological changes (Henning, 1979, 1984; Shub, 1983; Meddinds and Theisen, 1989; Vincenzini et al., 1989, Takata et al., 1992, ).
It has been demonstrated that an improve of gut morphology is paralleled by an increased digestive and absorptive function of the intestine due to increased absorptive surface area, expression of brush border enzymes and nutrient transport systems (Awad et al., 2008). According to these reports we consider that the morphological change of intestine is the mainly factor that affects the function of intestine.
Embryonic and early post-hatch development of the birds is a period with rapid morphological and functional development of the gastrointestinal tract (Baranyiova, 1972). Around hatch, major changes in intestinal growth and differentiation of gastrointestinal epithelial cells, and digestive and absorptive capacities of the gastrointestinal tract occur. These are controlled by intrinsic (genetic programming) and extrinsic factors (intestinal flora, hormonal, neuronal,
nutritional and nonnutritional factors), as reviewed by Lipkin (1981), Pacha (2000), and Sangild (2001). Changes in nutrition from the first day after hatching, when the yolk sac rich in lipids is progressively replaced in the birds by a solid diet rich in carbohydrates (Buddington and Diamond 1989), are also related to morphological (Baranyiova and Holman 1976; Uni et al., 1995) and enzymatic changes in the small intestine (Uni et al., 1998).
The delayed development of the small intestine could hinder the growth of poult. Also avian are unique in demanding the gastrointestinal tract to change functionally from utilizing lipid-rich yolk as a nutrient source during embryonic development to diets composed of carbohydrates and proteins after hatch (Noy and Sklan, 2001). The rapid development of the small intestine in the prehatch and posthatch period is an important process which enable avian to assimilate ingested nutrients.
In avian, the small intestine is the part of the gastrointestinal tract (gut) following the stomach and followed by the large intestine, and is where the vast majority of digestion and absorption of food takes place. The small intestine is divided into the duodenum, the jejunum and the ileum. The duodenum extends from the ventriculus to pancreatic and bile ducts; the jejunum from the ducts to Meckel’s diverticulum; the ileum from the diverticulum to ileo-caeco-colic junction. During the first week posthatch the small intestines increases in weight more quickly than the body mass (Katanbaf et al., 1988; Sell et al., 1991; Sklan, 2001). Rapid morphological changes occur after hatch with differing ontogenic timetables of villus growth in the duodenum, jejunum, and ileum (Sklan, 2001).
Intestinal villi are the protrusions of the lamina propria into the intestinal lumen to enlarge the digestive and absorptive area. The villi surface is covered with a simple columnar epithelial cell layer consisting of absorptive, goblet and entero-endocrine cells. At the base of the villi, the cell layer lines the inside surface of tubular indentations of intestinal crypts, which reach the mucosal layer. Near the smooth muscle layer, the inside layer of the crypt again lines the neighboring villi surface, resulting in blind ends in the crypt. All epithelial cells originated by mitosis in the stem-cell zone located in the lower portion of crypt migrate along the villi surface upward to the villi tip within a few days for maturating, where they extruded into the intestinal lumen within 48 h after birth. In recent years, the different mechanisms of epithelial cell loss which are associated with intraepithelial lymphocytes and lamina propia macrophages
have been re-investigated. Such a cellular migration is likely to be altered by intestinal function. In addition, since villi consist of epithelial cells, the villi height is assumed to change according to the cell area and number.
Morphological development of the small intestinal mucosa involves the stepwise remodeling of a smooth-surfaced endodermal tube to form finger-like luminal projections (villi). The intestinal villi are a unique morphological component critical to intestinal function, and their malformation can lead to malabsorption, chronic wasting syndromes, and failure to thrive. The villi growth, usually termed morphogenesis, is of prime interest in the study of development. An epithelial sheet that undergoes dramatic change in form during development is the intestinal epithelium, which becomes shaped into finger-like villi that protrude into the lumen of the gut. The intestinal epithelium in the chicken does not form villi directly, but first forms longitudinal folds, termed previllous ridges, running the length of the intestine (Hilton, 1902). The number of villi markedly decreased at 10 days of age in all the intestinal segments in White Leghorn (WL) and broiler (BR) chickens, suggesting a rapid development of villi during the first 10 days (Yamauchi & Isshiki, 1991). WL had the highest villi numbers in the duodenum, followed by lower numbers in the jejunum and the lowest in the ileum during the starter stage (Yamauchi et al., 1993). However, the jejunal villus height showed a marked growth rate up to the next development stage followed by the ileum, while the duodenal villi slightly increased. This shows that vigorous absorption takes place mainly in the duodenum in the early stage of life and is then extended to the jejunum with increasing age, while the intestinal histology is altered during post-hatching development in chicks. This corresponds with the results that the intestinal mucosa changed structurally with age, especially over the first 7 days post hatch, and the rate of development was most rapid in the jejunum of chick (Uni et al., 2000).
Crypts are tubular invaginations of the epithelium around the villi, lined largely with younger epithelial cells which are involved primarily in secretion. At the base of the crypts there are stem cells, which continually divide and provide the source of all the epithelial cells in the crypts and on the villi. At each mitosi one daughter remains a stem cell while the other differentiates and migrates up the side of the crypt and eventually the villus. Goblet cells are among the cells produced in this fashion.
The crypts secrete various enzymes, including sucrase and maltase, along with endopeptidases and exopeptidases. Also new epithelium is formed here, keeping in mind that the epithelium at this site is frequently worn away by the passing food. Loss of proliferation control in the crypts is thought to lead to colorectal cancer in mammal.
At hatch, crypts are not detectable in the chick small intestine; these become defined within hours after hatch and proceed to growth and proliferate rapidly for 4 d. All epithelial cells in the chick intestine are in a proliferating stage at hatch, and, as crypts develop, proliferation becomes localized mainly to the crypts within 5–8 d, although a percentage of villus enterocytes continue to proliferate after this period (Uni et al., 2000; Geyra et al., 2001a). Crypt depth, which reflects enterocyte differentiating activity, increased linearly in both duodenum and jejunum until 10 to 12 days, although the increase in the jejunum was greater than in the duodenum. Increases in the crypt depth in the ileum with age were small. The number of enterocytes per villus increased, but enterocyte density along the villus did not change significantly over this period in the duodenum and ileum, but increased slightly in the jejunum (Uni, 1995, 1996).
Consequently, in order to understand well nutrients absorptive function in intestine, the usefulness of ingested diets might be determined; (i) by light microscopic parameters of villus height, cell area and cell proliferation (cell birth due to cell mitosis) microscopy; (ii) by morphological alterations of the epithelial cells on the villus apical surface using a scanning electron microscope; and by (iii) the ultra-structural alterations of the organelles in the epithelial cells using a transmission electron microscope.
Histology
The intestinal tract epithelium is covered by a mucus layer composed predominantly of mucin glycoproteins, which are synthesized and secreted by goblet cells distributed along the villi. Goblet cells arise by mitosis from pluripotential stem cells at the base of the crypt (Cheng, 1974) or from poorly differentiated cells in the lower crypt referred to as oligomucous cells (Cheng, 1974). These cells migrate from the crypt toward the villus tip where they are sloughed into the lumen, a process that takes 2 to 3 days (Geyra et al., 2001b).
Goblet cells are glandular simple columnar epithelial cells whose function is to secrete mucin, which dissolves in water to form mucus which covered the epithelial surface of the small
intestine. Mucus acts both as a protective barrier against harmful intralumimal components (Smirnov et al., 2005) and as a medium for microorganisms; moreover it influences transport between luminal contents and the brush border (Forstner, 1995). Several studies have been carried out regarding the distribution of mucins in the intestine of many species (Hopwood et al., 1977, 1986; Jamdar and Ema, 1982; Henk et al., 1986; Long and Orlando, 1999; Poorkhalkali et al., 1999). Mucins, secreted by goblet cells, are classified into neutral and acidic subtype. The neutral mucins presents in the gastric mucosa is the predominant mucin subtype while the acidic mucins are found in the intestine epithetlium, dominating in the large intestine (Sheahan and Jervis, 1976; Deplancke and Gaskins, 2001).
The gastrointestinal tract is the largest endocrine organ of the body. Endocrine cells are scattered among the epithelium cells of the gastrointestinal tract (Feyrter., 1938, 1953; Sundler 1988). The digestive function is affected by hormones produced in many endocrine glands, but the most profound control is exerted by hormones produced within the gastrointestinal tract (Deveney and Way, 1983). Silver techniques have been regarded as a general method for detecting intestinal endocrine cells, in particular Grimelius positive cells are classified as argyrophil cells (Grimelius, 1968, 1980). Argyrophil cells of the digestive tract are endocrine cells belonging to the amine precursor uptake and decarboxylation (APUD) system. The regional distribution and the relative frequency of these cells in the intestine have been found to vary with the animal species, such as reptiles (Ku et al., 2001), fish (Pan et al., 2000), birds (Rawdon and Andrew, 1981: Nascimento et al., 2007; Wang et al., 2010) and mammals (Ku et al., 2004a, 2004b). In the gastrointestinal tract argyrophil cells were classified in two types according to the shape. The open-type cells, which have a triangular or elongated shape with an apical cytoplasmic processes in contact with the glandular lumen, and the closed-type cells, which are round, oval or conical-shaped without a luminal connection (Wang et al., 2010).
Purpose
In the current study, we performed a morphometric analysis in the intestine of embryos and chicks after hatch. Therefore, the objective of this study was to investigate the developmental patterns of intestine in embryos and chicks using the light microscopic parameters of intestine, villi and crypt. We analyses the distribution of goblet cells and argyrophil cells during development of chicks with histochemical method as well.
Materials and Methods Birds
The intestinal morphometric measurements in these studies were collected from 45 embryos and chicks. 45 embryos and chicks were hatched by eggs from 20 Ovambo chickens (45 weeks old). Embryos and chicks were sacrificed for analysis at 15, 17, 18, 19 d of incubation (E 15, E17, E18, E19, respectively) and at hatch, 2d, 7d, 9d of life (0, 2d, 7d, 9d).
Sample processing
For each embryo and chick, samples of approximately 2cm were cut from each segment of the proximal duodenum, the proximal jejunum and the middle ileum. The first segment, termed the duodenum, extended from the pylorus to the pancreas and formed a loop surrounding most of the pancreas. The second segment was the jejunum which extended from the distal portion of the duodenal loop to Meckel’s diverticulum. The third segment was the ileum which extended from Meckel’s diverticulum to the ileocecal junction, with its distal portion connected to a pair of ceca via mesenteric tissue (Wang et al.,2008). Samples were gently flushed with phosphate buffer 0.1 M PH 7,1 (PB) to washout the intestinal contents and fixed in PB with 4% formaldehyde. After 1 day fixing, each sample was divided into 2 parts, routinely dehydrated in alcohol (70%, 80%, 95%, 100%), and embedded in resin (JB-4, Polyscience). Sections of 4 µm were cut with a microtome (Reichert-Jung. Mod. 1140/Autocut) and collected onto gelatin coated slides. For morphology measurements, sections were stained with hematoxylin and eosin according to Mayer (Luna, 1968). Sections were examined by a light microscope (Leitz, Diaplan) connected to a PC via a Nikon digital system (Digital Sight DS-U1). Images were acquired using the NIS-Elements F version 2.10 software.
Staining procedure Hematoxylin and eosin
Parameters of morphometriy were done by staining 4-µm sections with Hematoxylin and eosin according to the following protocol. Slides were briefly washed in distilled water, stained in Mayer hematoxylin solution for 5-10 minutes, washed in running tap water for 10 minutes, stained in eosin solution (1% in distilled water) for 30 seconds to 1 minute, washed in distilled water, dehydrated through 95% alcohol and twos in absolute alcohol 5 minutes each,
Cleared in 2 changes of xylene 5 minutes each and mounted with xylene based mounting medium.
Alcian blue (AB) pH 2.5 + Schiff reagent (PAS)
Determination of goblet cells containing acidic and neutral mucin was done by staining 4-µm sections with Alcian blue (AB) pH 2.5 + Schiff reagent (PAS) according to the following protocol. Slides were incubated with AB pH 2.5 solution for 30 minutes, rinsed in running water for 5 min, and placed in 0.5% of periodic acid solution for 10 min, rinsed in running water for 5 min and incubated in Schiff reagent for 10 min. After washing in running water and then in distilled water, the slides were dehydrated and mounted. The number of AB/PAS-positive cells along the villi was determined by light microscopy (Leitz, Diaplan).
Grimelius
Determination of argyrophil cells was done by staining 4-µm sections with Grimelius stain according to the following protocol. Slides were dipped in the distilled water for 1 minute, incubated at 60°C in silver solution (1%AgNO3 solution with 0.2M Sodium acetate and 0.2M acetic acid ) for 3 hours, dipped in the reducing solution (5% sodium sulfite solution with 1% hydroquinone) at 45°C for 1 minute. After washing in distilled water, the slides were dehydrated and mounted. The number of argyrophil cells along the villi was determined by light microscopy.
Measurement and analysis
Measurements were made using ImageJ 1.37V software. Ten well-oriented and intact crypt-villi units of each slide were measured in triplicate. The villi height was defined as the distance from villi tip to crypt junction. The villi width was measured from the outside epithelial edge to the outside of the opposite epithelial fringe at the half-height of the villi. The perimeter of the villi was measured all villi boundary. Villi surface area was calculated from villi height and width at the half-height. The crypt depth was defined as the depth of the invagination between adjacent villi. The muscle thickness was measured from the junction between the submucosal and muscular layers to that between the muscular layer and the tunica serosa. The number of AB/PAS-positive and argyrophil cells along the villi was determined by light microscopy. The number of cells along the villi was determined by light microscopy.
Mean values generated from all individual measurements were statistically analysed by a one factor variance analysis using the GLM procedure (SAS, 1999). Once main effects were significant with P<0.05, means were compared by Duncan’s multiple range test using a significance level of P<0.05.
Results Morphology
Thickness of intestinal wall was obviously changed during the development of embryo and chick (P<0.05, Table. 1). In the duodenum and ileum, it decreased from E15 to E17, then increased from E19 to hatch and it decreased sharply again from 7d to 9d, but it decreased in the jejunum from 2d to 7d (P<0.05). The thickness of intestinal wall presented the lowest in the ileum and the highest in the duodenum at E15, but it showed the highest in the ileum and the lowest in jejunum at E19 (P<0.05).
Table 1 The thickness of the samll intestinal wall and muscle of embryos and chicks at
different ages
Age Thickness of intestinal wall (μm) Thickness of muscle (μm)
Duodenum Jejunum Ileum Duodenum Jejunum Ileum
E15 406.5±99.02BCa 355.6±35.4 1Aa 283.8±92.12 Db 208.5±72.41 Aa 136.4±36.32 Bb 140.2±33.79 BCb
E17 309.5±12.43 Eb 349.3±27.56 ABb 429.5±110.91 Ba 123.7±27.64 CDa 136.5±59.78 Ba 132±16.25 BCa
E18 338.6±84.23 DEa 299.6±63.14 CDa 354.0±71.27Ca 165.2±43.93 BCa 123.6±37.42 Bb 194.8±75.49 Aa
E19 375.3±48.02 CDb 321.5±42.41 BCc 529.1±84.97 Aa 155.6±28.33 BCb 132.9±12.27 Bc 149.8±43.56 BCa
0 441.2±16.02 ABa 340.4±43.08 ABCc 392.1±77.92 BCb 155.2±57.74 BCa 141.5±11.38 Ba 156.2±35.45 BCa
2d 432.4±25.01 ABa 347.1±43.65 ABb 433.4±33.87 Ba 172.6±34.02 Ba 179.0±19.02 Aa 166.9±59.37 Ba
7d 454.8±57.34 Aa 296.4±15.54 CDb 446.6±36.47 Ba 220.9±18.68 Aa 197.7±10.50 Ab 197.1±15.72 Ab
9d 334.2±44.8 Ea 258.7±18.6 Db 336.4±24.3 CDa 140.4±18.4 CDb 143.6±29.9 Bb 171.2±15.7 Ba
a,bMeans within columns with different superscript capital letters are different (P <0.05).Means within rows with different superscript lower caseletters are different (P <0.05).
Thickness of muscle presented in Table 1 show that it decreased from E15 to E17 and from 7d to 9d in the duodenum and ileum and from E18 to E19 in the ileum, increased from 2d to 7d in the duodenum and ileum and from E17 to E18 in the ileum (P<0.05), but there was the increase from hatch to 2d and the decrease from 2d to 7d in the jejunum (P< 0.05). At E19
the thickness was the highest in the ileum and lowest in the jejunum (P<0.05), but at 7d in the duodenum was more thick 23.2 and 23.8μm than that in the jejunum and ileum respectively (P<0.05).
Table 2 The thickness of the small intestinal wall with villi of embryos and chicks at different
ages
Age Thickness of intestinal wall with vlilli (μm)
Duodenum Jejunum Ileum
E15 594.0±103.83 FGa 588.3±98.76 Ea 485.6±40.78 Gb E17 578.7±37.01 Ga 591.2±28.96 Eab 640.2±71.97 Fb E18 663.0±39.47 Fb 597.4±64.63 Ec 721.0±82.58 Ea E19 1006.4±38.93 Ea 872.6±44.82 1Db 863.8±89.55 Db 0 1351.4±135.92 Da 1317.6±126.68Ca 985.9±77.54 Cb 2d 2328.7±283.55 Ca 1750.1±195.96 Bb 1441.5±124.84 Ac 7d 2540.9±31.19 Ba 1738.1±91.52 Bb 1369.3±188.66 Bc 9d 2920.4±111.81 Aa 2329.0±198.67 5Ab 1439.8±221.07 ABc
a,bMeans within columns with different superscript capital letters are different (P <0.05).Means within rows with different superscript lower caseletters are different (P <0.05).
The thickness of intestinal wall with villi progressive increased from E15 to 9d in three sections, except from E15 to E17 in the duodenum and from 2d to 7d in the jejunum and ileum (P<0.05, Table. 2). In particular, it significantly increased from E17 to 9d in the duodenum, from E18 to 2d and from 7d to 9d in the jejunum and from E15 to 2d and from 7d to 9d in the ileum. At E 15, the thickness in the ileum was thinner 108.4μm and 102.7μm than that in the duodenum and jejunum respectively (P<0.05), also at 9d the highest thickness was in the duodenum and the lowest in the ileum (P<0.05).
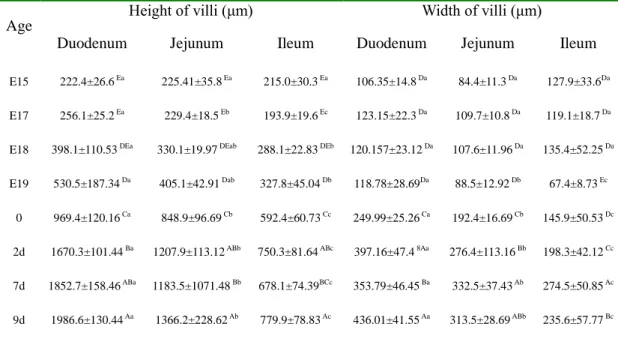
The height of villi progressive increased in the duodenum from E15 to 9d, in the jejunum from E15 to 2d and in the ileum from E17 to 2d (P<0.05, Table. 3). The height of villi increased 8.9 times from the lowest at E15 to the highest at 9d in the jejunum, 6.6 times from lowest at E15 to the highest at 9d and 4.0 times from lowest at E17 to the highest at 9d (P<0.05). In particular, from E19 to hatch and from hatch to 2d, the height of villi increased 438.9μm and 700.9μm in the duodenum, 443.8μm and 359μm in the jejunum and 264.6μm and 157μm in
the ileum respectively (P<0.05). Although, the height of villi was not different in duodenum, jejunum and ileum, there are significant changes in the height of villi among three sections from E17 to 9d (P<0.05). The duodenum increased in the height of villi more rapidly than either jejunum or ileum from E17 (P<0.05) and the jejunum increased in the villi height more rapidly than ileum from hatch (P<0.05).
The villi width (Table. 3) increased from E19 to 9day in three sections (P<0.05), but in the jejunum and ileum from 7d to 9d. In particular, from E19 to hatch and from hatch to 2d, the villi width increased 131.2μm and 147.1μm in the duodenum, 103.8μm and 84μm in the jejunum and 78.5μm and 52.4μm in the ileum respectively, also the villi width increased 76.2μm in the ileum from 2d to 7d (P<0.05).The duodenum increased in the width of villi more rapidly than both jejunum and ileum, also the jejunum increased in the villi width more rapidly than ileum from E19 (P<0.05).
Table 3 The height and width of the small intestinal villi of embryos and chicks at different
ages
Age Height of villi (μm) Width of villi (μm)
Duodenum Jejunum Ileum Duodenum Jejunum Ileum
E15 222.4±26.6 Ea 225.41±35.8 Ea 215.0±30.3 Ea 106.35±14.8 Da 84.4±11.3 Da 127.9±33.6Da
E17 256.1±25.2 Ea 229.4±18.5 Eb 193.9±19.6 Ec 123.15±22.3 Da 109.7±10.8 Da 119.1±18.7 Da
E18 398.1±110.53 DEa 330.1±19.97 DEab 288.1±22.83 DEb 120.157±23.12 Da 107.6±11.96 Da 135.4±52.25 Da
E19 530.5±187.34 Da 405.1±42.91 Dab 327.8±45.04 Db 118.78±28.69Da 88.5±12.92 Db 67.4±8.73 Ec
0 969.4±120.16 Ca 848.9±96.69 Cb 592.4±60.73 Cc 249.99±25.26 Ca 192.4±16.69 Cb 145.9±50.53 Dc
2d 1670.3±101.44 Ba 1207.9±113.12 ABb 750.3±81.64 ABc 397.16±47.4 8Aa 276.4±113.16 Bb 198.3±42.12 Cc
7d 1852.7±158.46 ABa 1183.5±1071.48 Bb 678.1±74.39BCc 353.79±46.45 Ba 332.5±37.43 Ab 274.5±50.85 Ac
9d 1986.6±130.44 Aa 1366.2±228.62 Ab 779.9±78.83 Ac 436.01±41.55 Aa 313.5±28.69 ABb 235.6±57.77 Bc
a,bMeans within columns with different superscript capital letters are different (P <0.05).Means within rows with different superscript lower caseletters are different (P <0.05).
The perimeter of villi rapidly increased in the duodenum from E19 to 2d and from 7d to 9d, in the jejunum and ileum from E19 to hatch and from 2d to 9d (P<0.05, Table, 4). Comparisons of villi perimeter in the duodenum, jejunum and ileum showed that in the duodenum it was greater than in the jejunum and ileum form E17 to 9d, and in the jejunum were was greater in
the ileum at E17 and from E18 to 9d (P<0.05). However the perimeter increased 3.77 times in the jejunum, 3.4 times in the duodenum and 1.12 times in the ileum from E19 to 7d. From 7d to 9d, it increased 2.55 times in the duodenum, 1.2 times in the duodenum and 1.12 times in the ileum.
Surface area of villi quickly increased from E19 to 2d in the duodenum and from E19 to 7d in the jejunum and ileum (P<0.05, Table. 4). Increases presented 11.16 times in the jejunum, 11.03 times in the duodenum and 8.4 times in the ileum from E19 to 9d (P<0.05).
Table 4 The perimeter and surface area of the small intestinal villi of embryos and chicks at
different ages
Age
Perimeter of villi (μm) Surface area of villi (μm2)×103
Duodenum Jejunum Ileum Duodenum Jejunum Ileum
E15 617.7±79.13Ea 644.6±91.18 Fa 646.2±108.24Ea 23.4±2.92 Db 19.3±11.72 Db 18.2±9.68 Da
E17 769.3±75.97DEa 660.1±56.68 EFc 544.7±109.95Ec 31.8±3.27 Da 25.1±10.73 Db 23.6±9.08 Db E18 1005.1±303.68 Da 842.2±264.15 EFab 778.6±215.16 Db 50.3±2.92 Da 41.7±4.17 Da 41.7±2.83 Da E19 1114.2±187.3 5Da 966.3±42.96 Eb 790.9±83.83 Dc 61.0±2.15 Da 35.2±3.47 Db 22.3±4.93 Dc 0 2045.1±310.43 Ca 2115.5±440.32 Db 1242.7±252.03 Cc 243.3±55.52 Ca 167.4±6.65 Cb 86.3±3.27 Cc 2d 3932.7±896.68 Ba 1720.0±663.93 Cb 1385.3±133.84 Cc 671.9±27.54 Da 335.6±16.12 Bb 150.6±75.91Bc 7d 3942.62±668.76 Ba 2487.9±484.37 Bb 1897.1±378.94 Bc 673.2±20.28 Ba 393.4±14.34 Ab 187.9±5.1 4Ac 9d 4783.14±1054.8 Aa 3644.1±864.6 Ab 2141.6±320.1 Ac 878.1±320.1 Aa 429.7±15.3 Ab 185.1±6.1 Ac
a,bMeans within columns with different superscript capital letters are different (P <0.05). Means within rows with different superscript lower caseletters are different (P <0.05).
Crypts were presented in the three sections at hatch. The number of crypts per villi changed with age in three intestinal segments (P<0.05 Table. 5). From 2d to 7d increases were in the duodenum, jejunum and ileum. From 7d to 9d presented increases in the jejunum and decreases in the ileum (P<0.05). Crypts number were bigger in the duodenum and ileum than in the jejunum at 7d, but smaller in the duodenum and ileum that in the jejunum at 9d (P<0.05).
Table 5 The number of crypts per villi and ratio of villi height to crypt depth in small intestine
of embryos and chicks at different ages
Age Number of crypt Villi height:crypt depth
Duodenum Jejunum Ileum Duodenum Jejunum Ileum
0 1.10± 0.08 Ba 1.21±0.11 Ca 1.10±0.11 Ca 12.7±1.77 ABa 10.5±2.73 Aa 8.1±1.79 Ab
2d 1.39±0.12 Ba 1.32±0.09 Ca 1.13±0.23 Ca 12.5±7.26 Aa 8.0±4.27 Bb 5.4±2.0 Bb
7d 2.72±0.32 Aa 1.94±0.63 Bb 2.67±0.96 Aa 6.7±2.47 Ca 6.9±2.76 Ba 3.5±0.78 Cb
9d 2.75±0.54 Aa 3.171±0.87 Aa 1.96±0.73 Bb 8.7±3.06 Ba 7.1±3.28 Ba 5.1±1.97 Bb
a,bMeans within columns with different superscript capital letters are different (P <0.05).Means within rows with different superscript lower caseletters are different (P <0.05).
Crypt depth progressively increased in the three intestinal segments from hatch to 7d, however it decreased in the duodenum and ileum from 7d to 9d (P<0.05, Table. 6). The depth increased 3.4 times in the duodenum, 3.07 times in the jejunum and 2.89 times in the ileum from hatch to 7d (P<0.05).
Crypt width progressively increased in the duodenum from hatch to 9d, however it increased in the jejunum and ileum from hatch to 7d (P<0.05, Table 6). The crypt width in the duodenum were greater than in the ileum from hatch to 9d and than in the jejunum at hatch and 9d, and it in the jejunum were greater than that in the ileum only at 7d (P<0.05).
Table 6 The depth and width of crypt in small intestine of embryos and chicks at different ages
Age Depth of crypt Width of crypt
Duodenum Jejunum Ileum Duodenum Jejunum Ileum
0 87.7±5.44 Da 80.4±4.15 Ca 78.4±5.39 Ca 59.2±3.42 Da 47.4±4.01 Cb 46.3±4.89 Cb
2d 152.2±44.32 Ca 160.2±39.66 Ba 142.1±31.94 Ba 94.1±11.27 Ca 86.8±13.55 Bab 77.7±25.16 Bb
7d 301.9±96.69 Aa 207.1±0.63 Ab 226.3±72.81 Ab 111.7±12.68 Ba 113.4±26.24 Aa 92.4±31.22 Ab
9d 248.2±83.13 Ba 221.2±88.47 Aa 162.3±39.8 Bb 132.8±29.1 Aa 112.6±27.5 Ab 95.1±33.1 Ab
a,bMeans within columns with different superscript capital letters are different (P <0.05).Means within rows with different superscript lower caseletters are different (P <0.05).
The ratio of villi height to crypt depth presented the tendency initially decreases from hatch to 7d then increases from 7d to 9d in three intestinal segments (Table. 5), in particular it presented in the duodenum and ileum from 2d to 7d and from 7d to 9d and in the jejunum from hatch to 2d (P<0.05). Among three segments, the ratio in the duodenum and jejunum were bigger than that in the ileum from hatch to 9d, except at 2d (P<0.05).
Histology
PAS/AB-positive goblet cells presented on the villi and crypt of the three segments at E19 (Fig. 1-3, Fig. A-E). Positive goblets cells increased in the duodenum and jejunum from E19 to 7d and decreased from 7d to 9d, while that increased in the ileum throughout E19 to 9d (P<0.05) (Fig. 5 A-E). The density of PAS/AB-positive goblets cells was higher in the ileum and lower in the duodenum from E19 to 9d (P<0.05, Fig. 1). In particular, from E19 to 7d the number of goblet cells increased 6.3 times in the duodenum, 7.6 times in the jejunum and 9.7 times in the ileum.
Ba Ab Cc Cc Ca Cb Aa Bb Cb Da Aa Ba Ca Da Eb 0 200 400 600 800 1000 1200 1400 1600 E18 E19 0 2d 7d 9d P A S an d A B p os it ive gobl et c el ls ( ce ll s/ m m 2) Duodenum Jejunum Ileum
Figure 1. PAS and AB positive goblet cells distribution in the small intestine during development. Values are means±SEM, n=5, A-DMeans without a common letter at different age are significantly (P<0.05), a-c Means without a common letter at same age are significantly (P<0.05).
Bb Ab Cc CDc Db Aa Bb Db Da Cb Aa Ba Ca Da Ec 0 100 200 300 400 500 600 700 800 E18 E19 0 2d 7d 9d P A S p os it ive gobl et c el ls ( ce ll s/ m m 2) Duodenum Jejunum Ileum
Figure 2. PAS positive goblet cells distribution in the small intestine Values are means±SEM, n=5, A-DMeans without a common letter at different age are significantly (P<0.05), a-c Means without a common letter at same age are significantly (P<0.05).
Cc Ab Bc Cb Cc BCb Aa Bb BCa Db Aa Ba Ca Dab Ea 0 100 200 300 400 500 600 700 E18 E19 0 2d 7d 9d A B p os it ive gobl et c el ls ( ce ll s/ m m 2) Duodenum Jejunum Ileum
Figure 3. AB positive goblet cells distribution in the small intestine during development. Values are means±SEM, n=5, A-DMeans without a common letter at different age are significantly (P<0.05), a-c Means without a common letter at same age are significantly (P<0.05).
Bab Aa Ba Bab Cb Bb Aa Ba BCb Ca Aa Aa Ba ABa Cb 0 0.2 0.4 0.6 0.8 1 1.2 1.4 E18 E19 0 2d 7d 9d Th e r a ti o o f P A S p o si ti v e g o b le t c e ll s to A B p o si ti v e g o b le t c e ll s Duodenum Jejunum Ileum
Figure 4. The ratio of PAS positive goblet cells to AB positive goblet cells in the small intestine during development. Values are means±SEM, n=5, A-DMeans without a common letter at different age are significantly (P<0.05), a-c Means without a common letter at same age are significantly (P<0.05).
Fig. 5. Microphotographs of AB/PAS-positive goblet cells in the small intestine. Red cells were PAS positive goblet cells. Blue cells were AB positive goblet cells. (A) duodenum of a 19 days embryo. (B) duodenum of a 9 days chick. (C) jejunum of a 19 days embryo. (D) jejunum of a 9 days chick. (E) ileum of a 19 days embryo. (F) ileum of a 9 days chick. Bars = 50µm.
The rate of PAS-positive goblet cells to AB-positive goblet cells increased in the duodenum and jejunum from E19 to 7d but it decreased in the duodenum and jejunum from 7d to 9d (P<0.05, Fig. 4)., while in the ileum it increased from E19 to hatch and decreased from hatch to 2d then increased again from 2d to 9d (P<0.05).
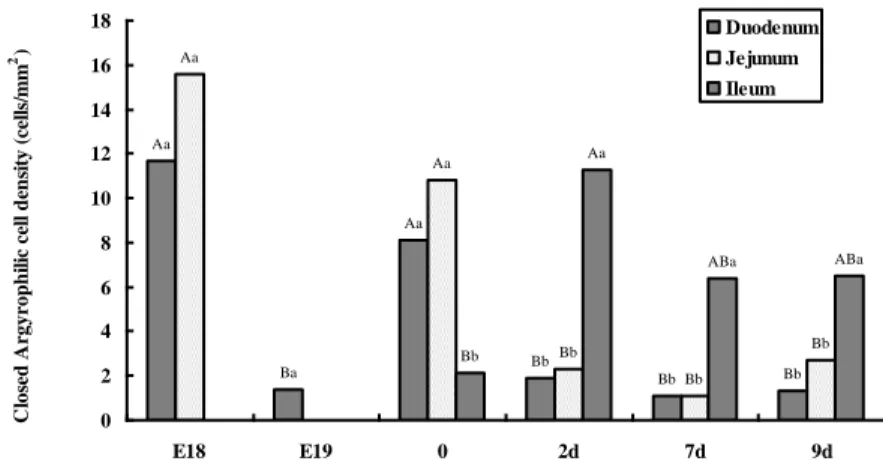
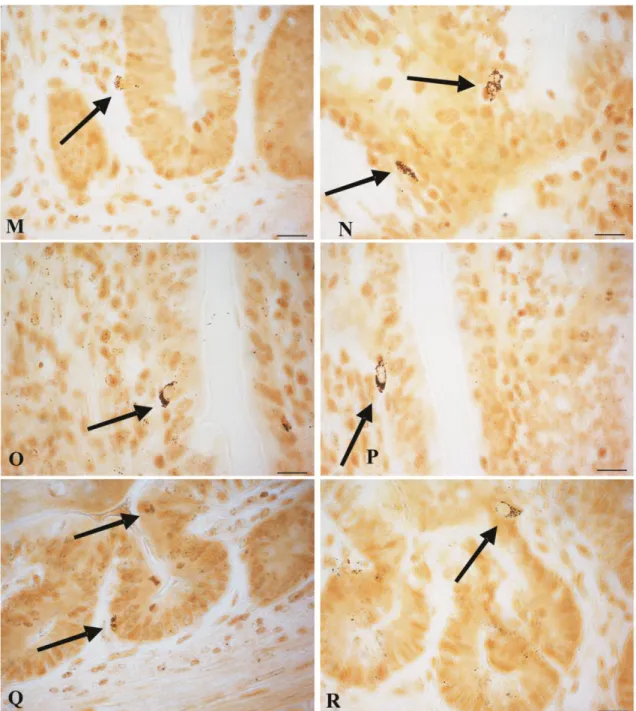
Argyrophil cells appeared at E18 in the duodenum and jejunum and at hatching in the ileum of chick (Fig. 6, Fig. 9- A C E). Argyrophil cells were distributed in the epithelium of villi and crypt of the duodenum, jejunum and ileum. All the argyrophil cells showed a dark brown colour, and were characterized by secretory granules located in the cell body and in the cytoplasmic processes (Fig. Fig. 9- B D F ).
elongated (open-type) (Fig. 10- G-L) while in the villi and crypts the cells were round, oval, conical (closed-type) and triangular shaped (Fig. 11- O-R). Fusiform and elongated argyrophil cells were dispersed in the epithelia of villi, they had a thin apical process running toward the intestinal lumen (Fig. 10-A K L; Fig 11- M N); some of these cells had a basal process directed to the lamina propria (Fig. 10-I J H). Argyrophil cells also displayed a triangular shape with the narrow end contacting the lumen or lamina propria of crypts (Fig. 10- J L). Round, oval and conical argyrophil cells were mainly localised in the crypt (Fig. 11- Q R), although scattered cells were also seen in the villi (Fig.11- O P).
Bb Bb Bb Aa Ba Aa Bab Bb Bb Aa Aa ABa Aa Aa Bb 0 2 4 6 8 10 12 14 16 18 20 E18 E19 0 2d 7d 9d A rgyr op h il ic c el l d en si ty ( ce ll s/ m m 2) Duodenum Jejunum Ileum
Figure 6. Argyrophil cell density distribution in the small intestine during development. Values are means±SEM, n=5, A-C Means without a common letter at different age are significantly (P<0.05), a-c Means without a common letter at same age are significantly (P<0.05)
The density of argyrophil cells in the intestine during development was portrayed in Figure 6, 7, 8. The density of agyrophil cells was highest in the duodenum and jejunum at hatch, while in the ileum the highest density value was at 2d (P<0.05). At hatching, there were 17.8
argyrophil cells/mm2 in the duodenum, 16.3 argyrophil cells/mm2 in the jejunum and 6
argyrophil cells/mm2 in the ileum. After hatch, the density of agyrophil cells decreased
Ba Bb Bb Aa Ba Ba Bb Bb Ba Aab Ba Aa Aa ABb 0 2 4 6 8 10 12 E18 E19 0 2d 7d 9d O p en A rgyr op h il ic c el l d en si ty ( ce ll s/ m m 2) Duodenum Jejunum Ileum
Figure 7. Open-type argyrophil cells distribution in the small intestine Values are means±SEM, n=5, A-CMeans without a common letter at different age are significantly (P<0.05), a-c Means without a common letter at same age are significantly (P<0.05).
Bb Bb Bb Aa Ba Aa Bb Bb Bb Aa Aa ABa ABa Aa Bb 0 2 4 6 8 10 12 14 16 18 E18 E19 0 2d 7d 9d C los ed A rgyr op h il ic c el l d en si ty ( ce ll s/ m m 2) Duodenum Jejunum Ileum
Figure 8. Closed-type argyrophil cells distribution in the small intestine. Values are means±SEM, n=5, A-CMeans without a common letter at different age are significantly (P<0.05), a-c Means without a common letter at same age are significantly (P<0.05).
Fig. 9. Microphotographs of argyrophilic cells (arrows) on the villi of the small intestine. (A) In the duodenum at 18 days embryo. (C) In the jejunum at 18 days embryo. (E) In the ileum at hatch. (B) In the duodenum at hatch. (D) In the jejunum at hatch. (F) In the ileum at hatch .Bars = 10 µm.
Fig. 10. Microphotographs of argyrophilic cells (arrows) on the villi of the small intestine. (A) In the duodenum at 9 days chick. C) In the jejunum at 9 days chick. (E) In the ileum at 9 days chick. (A) (K) (L) Open-type argyrophil cells in vilii with cytoplasmic process running towards the lumen. (I) (J) (H) Open-type argyrophilic cells with cytoplasmic process ran along the villi lamina propria. Bars = 10 µm.
Fig. 11. Microphotographs of argyrophilic cells in the small intestine. (M) (N) Open-type argyrophil cells (arrows) in crypt with cytoplasmic process running towards the lumen. (O) (P) Closed-type argyrophilic cells (arrows) in the villi. (Q) (R) Closed-type argyrophilic cells (arrows) in the crypt. Bars = 10 µm.
Discussion Morphology
The morphological development of the small intestine in chickens plays an important role in intestinal function. This study has combined determination of morphological development and histological changes in the chick during pre-hatch and posthatch. The results raise the possibility that intestinal development may be a rate determining step in growth. Our investigations on the intestine growth from E15 to 9d are in line with that formerly reported in chicks by Obst and Diamond (1992).
These results were in agreement with previous studies on avian species which demonstrated that intestinal growth is directly proportional to the age-related (Soriano et al., 1993; Wang et al., 2008). Furthermore, some researchers have reported that the whole-body growth rates are partly determined by the tissue distribution in the gastrointestinal tract (Konarzewski et al., 1989; Obst and Diamond, 1992).
Variations occurring in the villi height and width during the development of the small intestine have been studied in various animals. Our data concerning the villi height and width, summarized in the Table 3 are similar to those described in chicken by Yamauchi and Isshiki (1991). Furthermore these authors observed that villi developed to a plate-like shaped in the duodenum, a wave-like shape in the jejunum and a tongue-like shape in the ileum at 30 d via the common plate-like villi at 10 d. Our findings about villi size were similar to those of previous studies (Fry et al., 1962; Holt et al., 1984; Miller et al., 2007; Wang et al., 2008). The size of villi was demonstrated to be related to the absorptive function (Yamauchi and Isshiki, 1991; Yamauchi, 1993) and to be varied with cell mitotic activity of epithelial cells (Yamauchi, 1993). Villi height also reported to have significant correlation with the intestinal absorptive function in rats (Dowling and Booth, 1967) and to be dependent on the number of epithelial cells in chicks (Noda, 1979). These investigations suggest that the villi size and height are regarded as a useful index to express the intestinal function. At the starter stage in this study, the duodenum had the highest villi, however, up to the post-hatching stage the jejunum villi height showed a marked growth rate. These seem to explain that the vigorous absorptive part would be mainly in the duodenum in the early life stage and then extends to the jejunum with increasing age.
We reported that the perimeter and surface area of villi increased in the duodenum, jejunum and ileum in later incubation and posthatch, however from E19 to 9d there was a more pronounced increase in the jejunum than in the duodenum and ileum, followed by a slower and similar elongation in the three segments. This developmental profile has already been noted by Doskocil (1967) and Soriano (1993) for chickens and by Baranyiová (1972) for hens. The perimeter and surface area of embryo and chick small intestinal villi undergoes important changes during development, which may determine, in addition to other non-specific and also to specific factors (Ferraris 1994, Mitjans, 1997), the capacity to absorb nutrients. Debnam et al (1995) reported that to draw the physiological meaning of these results, the specific transport system for the substrate should be considered. Therefore, the present results considering total villi surface area constitute only the first step in determining the surface area involved in the absorption of a nutrient.
Poole et al. (2003) demonstrated that in lambs, the crypt depth increases linearly with age and is accompanied by an increase in the villus height and width, particularly in the jejunum, which contains the largest villi. These researchers considered that the crypt depth may be an important factor that determines the ability of the crypt to sustain the increase in the villus
height and width as well as to maintain the villus structure. In the present study, crypts were
detectable in the chick small intestine at hatch. Our investigations about the crypt depth, width and number per villi were similar to that described by Uni (1996, 1995). These results indicate that differential changes among the duodenum, jejunum, and ileum were evident in crypt depth and width.
The crypt is the region where stem cells divide for renewal of the villus; thus, the presence of a numerous and large crypt is reflective of fast tissue turnover and a high demand for tissue synthesis (Xia et al., 2004). All epithelial cells in the chick intestine are proliferating at hatch, and, as crypts develop, proliferation becomes localized mainly to the crypts within 5–8 d, although a percentage of villus enterocytes continue to proliferate after this period (Uni et al., 2000; Geyra et al., 2001a, 2001b). These seem to explain that the vigorous growth crypt size and number would contribute to maturate the development of intestine on morphology as well as improve the function of intestine in the early life stage.
in duodenum, jejunum and ileum. Wang et al. (2008) reported that in broiler chickens, the V:C ratio in the duodenum is lower at the age of 42 d than at the age of 22 d; however, age was not noted to affect the ratio in the jejunum and ileum. This is not a similar pattern with that of the broiler chickens. A possible explanation for this is that the secretory functions differ in segments of the intestine in different life stage and breeds. Wu et al. (2004) reported that an increase in the V:C ratio is associated with better nutrient absorption, decreased secretion in the gastrointestinal tract, improved disease resistance, and faster growth. In this study we found the V:C increased from 7days, according to Wu et at (2004) explanation, so we confirm that chick had good ability to absorb nutrients around one weeks after hatch.
These results suggest that each intestinal part shows obvious difference in the morphology and that the morphology of intestine has a close correlation with functional activity. However, many problems for the relationships of the simultaneously induced morphological alterations among each intestinal part still remain to be answered due to lack of detailed whole observations of the intestine.
Histology
In the Ovambo chick, results show that the number of goblet cells of the small intestine increases significantly later incubation and first week after hatch, special in the jejunum and ileum. These results confirm the experiment of goblet cells in the broiler small intestine accomplished by Uni et al (2003) where the number of the goblet cells per area increased slightly in the duodenum with development; however, increases in goblet cell density were more rapid in the jejunum and ileum, reaching 50% in the jejunum and 150% in the ileum during late incubation and continuing posthatch. Meanwhile, Uni reported that no differences in the density of acidic or neutral goblet cells were observed after hatch. But we found that the density of acidic and neutral goblet cells increased quickly until 7 days posthatch. The density of acidic goblet cells were higher than the density of neutral goblet cells before 2 days posthatch, however, the density of neutral goblet cells goblet cells were larger than that of acidic goblet cells after 7 days posthatch. This could be explained, as suggested by Theodosiou et al. (2007), that the increase in acid mucin in the hatching may be due to either to maturation of digestive tract or a larger variety of colonizing bacteria resulting from outside in hatched poult. Thus, the presence of acid mucins in early life stages might be of particular
importance as an innate defence barrier (Cebra, 1999; Beyaz et al., 2009). Though the physiological relevance of distinct mucin subtypes is not well understood, it has been suggested that acidic mucins hamper bacterial translocation (Robertson and Wright, 1997). Our findings about the density of goblet cells in the three segments at same age support previous mention about the conception that along the villi enterocyte proliferation occurred at close to hatch and that the migration rate of enterocytes was the highest in the duodenum and the lowest in the ileum.
It has been well established that gastrointestinal endocrine cells consist of two cell types; open-type cells, which are in contact with the glandular lumen, and closed-type cells, which do not have a luminal connection (Solcia et al., 2000; Wang et al., 2010). In this study, closed-type cells, with secretory granules, were round, oval and conical and most of them were located in the crypts. Open-type cells were fusiform, triangular and elongated and most of them were located on the villi. Our results broadly agree with Fritsch (2008) who reported that the broad-based endocrine cells of the gastrointestinal tract were oval, flask-shape and rested the base membrane. We observed open-type cells with process that extend in the direction of lamina propria in the villi and crypts. This is consistent with the endocrine function of the argyrophil cells. The endocrine functions of these cells have been reported by many researchers (Cetin, 1992; Bodegas et al., 1997; Fonseca et al., 2002; Rindi et al., 2004; Kostiukevich, 2004; Wang et al., 2007). In 1914, Masson attributed an endocrine function to some gastrointestinal cells. Feyrter (1938) gave a reinforcement for endocrine concept describing the existence of a group of cells stained by silver salts diffusely dispersed throughout the gastrointestinal tract. Subsequently Bülbring (1959) using physiological test illustrated that scattered argyrophil cells in the intestine secreted hormones which exerted not only endocrine actions but also exocrine actions. In our observations, most of open-type cells were located on the villi and few in crypts. These cells had a dark brown colour with secretory granules in the cell body and in the cytoplasmic processes which extend in direction of lumina. These results were similar to that reported by Rindi (2004) and Wang (2010) who described fusiform and pyramidal argyrophil cells with processes extending into the gastrovascular cavity or acinar lumina to act exocrine function. On the base of the direction of the cell processes, our results indicate that agyrophil cells in the intestine of Ovambo chick could have
both endocrine and exocrine actions.
We displayed that from 18E to hatch the density of argyrophil cells was higher in the duodenum and jejunum, but after hatch that was higher in the ileum. This data would be connected with the rate of maturation of different segments and demonstrated the ability of digestion is more powerful in the duodenum and jejunum around hatch (Uni et al., 2003; Ku et al., 2005; Wang et al., 2008). Data from our study demonstrated that argyrophil endocrine cells were detected throughout the intestine in chick from hatch. Meanwhile the regional distribution patterns and the relative frequencies of intestinal argyrophil cells showed remarkable differences in different parts of intestinal tract. Our findings about the density of argyrophil cells were in line with that reported by Uni et al. (2000, 2003) regarding poultry enterocyte proliferation along the villi close to hatch.
In conclusion, the thickness of intestinal wall and muscle, villi height and width, crypt depth and width, the number of goblet cells and endocrine cells on villi changed with increasing age during final incubation and first week of life. In particular at around hatch, the villi height and the mucosal surface changed dramatically which would influence the nutrients digestion and absorption. All theses changes mean that around hatch the presence of diet in the lumen of the intestine is vital to the effect and maintenance of gastrointestinal structure and function as well
as systemic functions. Changes in the intestinal mucosa resulting from luminal dietary
stimulus, such as those seen from yolk lipid to carbohydrate, result in adaptive responses
characterized by increased villus height and crypt depth, and crypt cell proliferation and
enterocyte differentiation as well as changes in enterocyte migration and programmed cell