ALMA MATER STUDIORUM
UNIVERSITA’ DI BOLOGNA
Scuola di Scienze
Corso di Laurea Magistrale in Biologia Marina
(LM-8024)
DIVERGENCE PATTERNS IN FUCUS SEAWEEDS
(PHAEOPHYCEAE) IN THE NORTHERN BALTIC SEA
AND IN THE TJONGSPOLLEN AREA
Tesi di Laurea in:
Habitat marini: struttura, processi e mapping
Relatore
Prof.ssa Laura Airoldi
Department of Biological, Geological and Environmental Sciences University of Bologna
Candidato
Stefania Piarulli
Correlatore
Prof.ssa Kerstin Johannesson
Department of Biological and Environmental Sciences University of Gothenburg
To my mother who gave me the passion for the sea,
to my father who has been my point of reference for all my life.
A mia madre che mi ha trasmesso l’amore per il mare,
a mio padre che per tutta la vita è stato il mio punto di riferimento.
CONTENTS
1. INTRODUCTION
2
1.1 Speciation and divergence mechanisms 2
1.2 Genus Fucus 4
1.3 The Baltic Sea and Tjongspollen, two unique ecosystems 6
1.4 Morphological traits in Fucus
8
1.5 Role of phlorotannins in brown seaweeds 10
1.6 Aim of the study 11
2. MATERIALS AND METHODS
13
2.1 Sampling and study area 13
2.2 Morphometric Analysis 15
2.3 DNA extraction, PCR and Genotyping 16
2.4 Phlorotannins extraction 17
2.5 Statistical analysis 18
3. RESULTS
19
3.1 Morphometry 19
3.2 Genetic results and populations structure 21
3.3 Phlorotannins content in algal tissue 26
4. DISCUSSIONS AND CONCLUSIONS
30
4.1 Morphology and genetics 30
4.2 Phlorotannins content 33
4.3 Conclusions and future perspectives 34
References
35
Appendix A 43 Appendix B 47 Appendix C 48 Appendix D 49 Appendix E 54 Appendix F 551. INTRODUCTION
1.1 Speciation and divergence mechanisms
Speciation is the evolutionary mechanism by which new and distinct biological species arise. Since 1859 when Darwin published his iconic work “On the Origin of species”, this process has been underlined fundamental in biology.
Species, as defined by the biological species concept, are groups of individuals considered reproductively isolated units. Individuals of the same species exchange genes, this not happen considering different species individuals (Mayr 1963).
Biogeographically, speciation can be classified in three modes: allopatric speciation, where the divergence cause is the geographical isolation; sympatric speciation, where the divergence is within a freely interbreeding population without any physicial barriers; and parapatric speciation where there are no specific extrinsic barriers to gene flow. The population is continuous, but nonetheless, it does not mate randomly. Individuals are more likely to mate with their geographic neighbors than with individuals in different parts of the population's range. In this mode, divergence may happen because of reduced gene flow within the population and varying selection pressures across the population's range.
Many processes have been underlined as a speciation mechanisms, such as speciation through hybridization, chromosomal rearrangements (Rieseberg and Willis, 2007), speciation as a consequence of ecological mechanisms, where in some cases ecological divergence is a proxy for the presence of divergent selection (Schluter 2009, Nosil et al., 2008) and speciation in parallel (Johannesson 2001). In most cases, the process of speciation usually takes long time.
The recent theory of sympatric speciation suggests that under certain circumstances speciation can occur in populations in absence of separating barriers, especially in recently formed or isolated areas that offer a variety of new ecological niches (Schliewen et al., 2001). Therefore, sympatric speciation often occurs more rapidly than allopatric speciation.
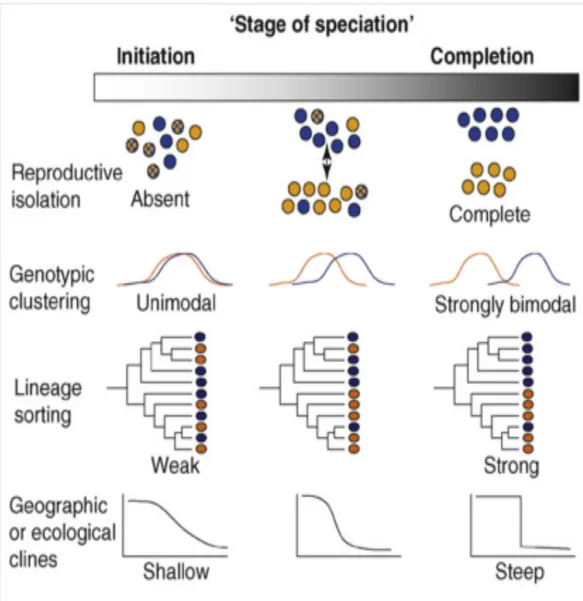
Divergence and differentiation can vary during speciation and it can be seen in different stages (Fig 1.1.1).
Figure 1.1.1: (Scheme from Nosil et al., 2008).The continuous nature of divergence during
speciation. Different levels of speciation in natural populations from absence of divergence to complete reproductive isolation. The distribution of gene frequencies in individuals from two different populations can vary from unimodal to bimodal genotypic clustering, that is reflected in lineage sorting and geographic or ecological clines.
However, the continuous nature of divergence during a speciation process is challenging to disentangle in natural populations and the dynamics of differentiation are still a matter of debate among evolutionary biologists.
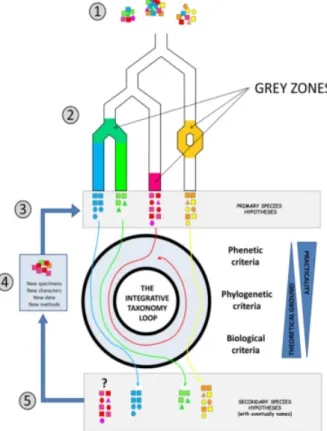
Groups of closely related taxa constitute important case studies to understand species and new biodiversity formation. However, it is important to assess the divergence among them at different organismal levels and from an integrative perspective (Fig. 1.1.2).
For this purpose, this study used the brown seaweeds genus Fucus as a model to study speciation, as they may constitute a good opportunity to study divergence at different stages.
Figure 1.1.2 : (Pante et al., 2015), species hypothesis based on the approach of integrative taxonomy
1.2 Genus Fucus
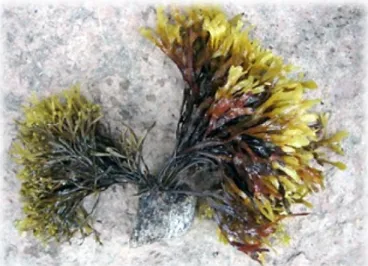
The brown macroalgae genus Fucus (Phaeophyta) is a group of perennial brown seaweeds (Fig 1.2.1) common in temperate and arctic coastal areas (White, 2004). These macroalgae are found in habitats ranging from the rocky intertidal to brackish salt marshes on the northern hemisphere (Bergström et al., 2005).
Fucus seaweeds are considered key ecosystem-structuring species (Chapman
1995, Tatarenkov et al., 2007), that means they give structure and increase the complexity of the habitat, providing refuge and protection for other marine organisms from abiotic and biotic factors (Dayton, 1972; Roff and Zacharias, 2011).
The brown colour of these algae, as well as the other Phaeophyceae, is a result from the presence of xanthophyll pigment: fucoxanthin, which masks the other typical algal pigments as Chlorophyll a and c, β-carotene and the other xanthophylls.
The genus Fucus typically show strong morphological and physiological variation (Knight and Parke, 1950; Burrows and Lodge, 1951; Pèrez-Ruzafa et al., 1993; Malm et al., 2001; Ruuskanen and Bäck, 2002), showing puzzling taxonomic designations with significant intraspecific variability throughout its geographic range (Coyer et al., 2006), and for this it is believed that the group has large phenotypic plasticity (Scott et al., 2001). However, in some cases, this variability may be genetically determined (Pearson et al., 2000).
For these reasons this genus offers the opportunity to investigate divergence due to local adaptation, as well as, speciation mechanisms.
1.3 The Baltic Sea and Tjongspollen, two unique ecosystems
The Baltic Sea (Fig. 1.3.1), currently a large postglacial brackish water body, might be considered a unique and marginal (geographically and ecologically) ecosystem, with a surface salinity ranging from 1 to 2 psu (practical salinity unit) in its inner parts up to 25 psu with predominantly atidal conditions (HELCOM, 1996).
Figure 1.3.1: The Baltic Sea (Bergström et al., 2005)
As its documented postglacial history showed, 11,000 years ago the Baltic Sea was subjected a globally increased sea level and a regional isostatic rebound after the retreat of the last continental ice sheet (Ignatius et al., 1981).
After the period of freshwater, the Baltic Sea was colonized by biome coming from the Atlantic Ocean as the entrance was wider than today and the salinity of the Baltic Sea was around 25 psu (Snoeijs, 1999).
After this, the salinity progressively neared current levels, with a consequent rapid adaptive challenge for the marine biota and with the extinction or retreat of those species that were unable to adapt to new environmental conditions (Russel, 1985).
Today the Baltic Sea hosts both marine and fresh water taxa with a low total number of species, especially in its inner areas.
It is possible to observe that the progressive salinity decreasing, from the entrance of the Baltic Sea to its inner part (Bergstrom et al., 2005), is accompanied by a reduction in the number of species comparing approximately 840 species of marine macrofauna (Kautsky and Kautsky, 2000), 220 marine macroalgae (Snoejiis, 1999) at the entrance with 80 and 60 species in its inner parts.
More detailed studies showed many kinds of adaptation to the brackish water conditions including physiological adaptations (Rietema, 1991, 1993, 1995; Kristiansen et al., 1994; Düwel, 2001).
Moreover, Baltic Sea populations may show marked genetic differences with North Sea ones (Väinöla and Hvilsom, 1991; Luttikhuizen et al., 2003; Olsen et al., 2004; Johannesson & André, 2006), some probably due separate evolutionary lineages (Väinöla, 2003). In fact, isolated populations that inhabit marginal environments tend to be more genetically differentiated than either central population or isolated populations that not live in extreme environmental conditions (Bouza et
al., 1999).
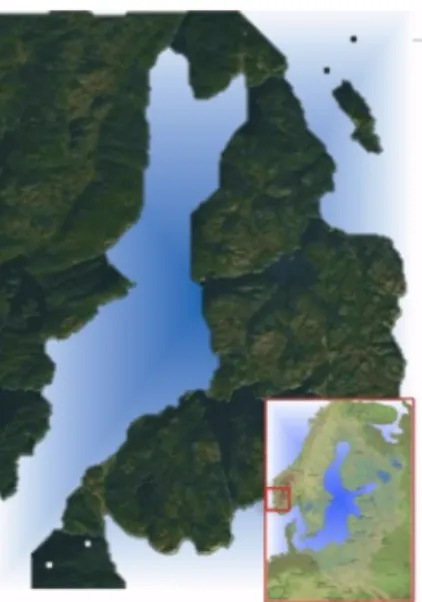
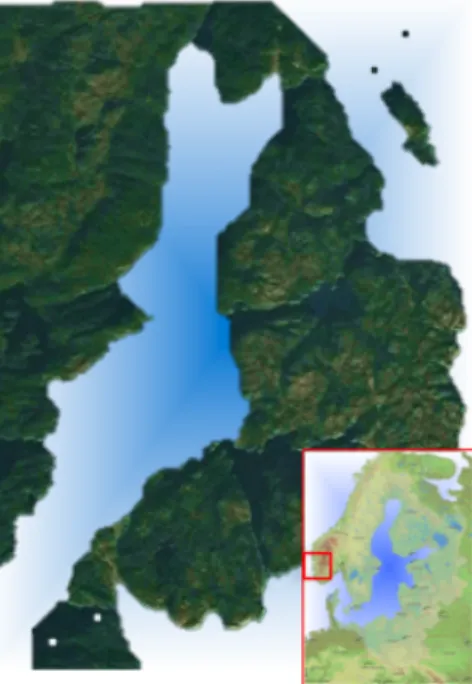
Another pheripheral environment is Tjongspollen, a sheltered pool located in the southwest coast of Norway (Fig. 1.3.2).
Figure 1.3.2: Tjongspollen area (Norway)
The surrounding area is almost uninhabited and the pool is therefore hardly influenced by anthropogenic activity. This sheltered area is connected to the adjacent
sea through a narrow channel, characterized by specific hydrographic conditions that result particularly in warm waters during summer and low salinity level. The benthic algal flora of the pool show a large number of rare species (e.g. Chondria dasyphylla and Codium vermilara) believed to have arisen due to the marginal environmental conditions of this area
Directional selection is a strong promoter of speciation, even in the presence of gene flow (Rieseberg et al., 2002; Korol et al., 2006; Doebeli et al., 2003). In more detail, environmental stress along gradients is a potential source of new species (Pereyra et al., 2009).
As evident from recent evolutionary events, Fucus seaweeds have been subjected to phenotypic and genetic radiation (Leclerc et al., 1998; Serrão et al., 1999b).
1.4 Morphological traits in Fucus
Fucus seaweeds are morphologically characterised by a perennial thallus with
irregular or disc-shaped holdfast or with hapter and the erect portion of the thallus is dichotomous. Air vesicles appear in pairs in some species, and in some instances, considerable variation is observed in the fronds, characterised by large or narrowed branches, completely flat or undulating, more or less branched. In the apices of the final branching are located conceptacles embedded in receptacles. However, while some morphological characters may be species-diagnostic to certain extent some overlapping may complicate the species identification in the field.
Three formally described Fucus species occur in the Baltic Sea while six have been reported in Tjongspollen area. Fucus vesiculosus and F. serratus occur in both regions while F. radicans is the third occurring species in the Baltic. Otherwise in Tjongspollen, F. ceranoides, F. distichus, F. evanescens and F. spiralis also occur. Perhaps the most distinctive species morphologically are F. evanescens, without bladders and inconspicuous midrib, Fucus serratus with broad and highly serrated blades and Fucus distichus also with inconspicuous midrib but shows distinctive enclosed cavities in the cortex. By contrast, F. ceranoides, F. spiralis, F. radicans and Fucus vesiculosus have distinctive midrib, which makes their differentiation
difficult. Fucus vesiculosus posses air bladders almost across its whole distribution helping differentiate this species from F. ceranoides and F. spiralis. However, it lacks these air vesicles in the Baltic and becomes narrower, challenging its morphological differentiation from F. radicans. Fucus radicans does not have bladders and it is considered a miniaturised form of F. vesiculosus. However, individuals of both taxa with overlapping sizes may be difficult to identify to species level.
Despite the morphological similarity among Fucus species, they may differ at other organismal level physiological and ecological traits (Gylle et al., 2010; Gurnnarsson and Berglund, 2012; Schagerström et al., 2014).
For example, Fucus radicans and F. vesiculosus are dioecus and they reproduce sexually by synchronized release of gametes to the surrounding waters, in a temporal window from late spring to autumn (Serrão et al., 1996). However, it has been found that both species can reproduce asexually (Tatarenkov et al., 2005), this feature being unique in fucoids. Earlier studies involving F. radicans have shown the dominance of one female clone in large part of the Swedish coast and in northern Finland (Johannesson et al. 2011). In contrast, Estonian populations mainly display sexual reproduction.
Figure 1.4.1: Two species of Fucus; Left is F.radicans and right F.vesiculosus. Ph: Lena Kautsky.
Despite the fact that both taxa appeared with limited gene flow between them (Pereyra et al., 2009), their potential for hybridization cannot be ruled out as they
show no prezygotic or early postzygotic reproductive barriers (Forslund and Kautsky, 2013).
1.5 Role of phlorotannins in brown seaweeds
Brown macroalgae contain secondary polyphenolic metabolities called phlorotannins (Pavia et al., 1999). Phlorotannins are polymers of phloroglucinol (1,3-5 trihydroxybenzene) (Ragan and Glombitza, 1986) and among different tannins, this type are the most relevant ones synthesised in different taxa (Connan et
al., 2004).
The different roles of phlorotannins are still under investigation. However, many studies have shown the evidence that abiotic factors such as salinity range, nutrients and solar irradiance might play an important role in the phlorotannins content, regulation and production.
In particular, there is evidence that phlorotannins are involved as protection against pathogen and UV radiation induced-damage avoiding photodestruction of algal compounds (Pavia et al., 1997; Targett and Arnold, 1998;) and they can also act as grazing deterrents.
It has been demonstrated, UV radiation can be an important factor to explain intraspecific variation in phlorotannins content of marine brown seaweeds (Pavia et
al., 1997). This has been shown in the brown alga Ascophyllum nodosum exposed to
UV-irradiance shock with an increase of 30% in the mean phlorotannin concentration (Pavia et al., 1997).
At an intraspecific level a common explanation of different contents of phlorotannin is the Carbon/Nutrient (C/N) ratio (Bryan et al., 1983). It is predicted that the production of polyphenolic and other C-based metabolites is determined by the relative supply of carbon (through photosynthesis) and essential nutrients. Accordingly, high levels of light with low levels of nutrients should be followed by an excess of carbon, which can be used for production of carbon-based chemical defence as polyphenolics (Pavia et al., 1997).
Baltic Sea Fucus present comparatively larger amounts of phlorotannins around 8-14% of dry weight (mg of DW) than 2-10% common in marine populations from Skagerrack and the North Sea (Kubanek et al., 2004).
Grazing by herbivores is one of the stressors for many plant and algal species. The loss of biomass by grazing constitutes a continual physiological stress and under grazer selection pressure, chemical defence has evolved in many species of seaweeds as well as terrestrial plants.
Brown seaweeds of the genus Fucus are continuously exposed to herbivory from gastropods and isopods (Hagerman, 1966). Through constitutive and inducible chemical defense, algal tissue becomes less palatable and even toxic for grazers (Forslund et al., 2012).
However, the production of phlorotannins as secondary metabolities is costly in terms of energy for algae, so it is presumably advantageous for the seaweeds to produce grazing defenses, only when herbivores are present and actively grazing, therefore they are known as inducible defenses (Van Alstyne and Paul, 1990).
The most dominant grazer of Fucus is the isopod Idotea, and in particular I.
baltica, common in the southern Baltic Sea (Leidenberger et al., 2012). There is
extensive evidence of the preference of Idotea for Fucus species (Jormalainen et al., 2001; Forslund et al., 2012).
However, some species may be more palatable than others and thus, the grazing pressure may limit the distribution of some algae (Forslund et al., 2012). Therefore, the herbivory pressure may contribute to the divergence among species and/or populations in levels of phlorotannin production against grazing.
1.6 Aim of the study
The wide distribution of Fucus macroalgae along environmental gradients as well as the exposure to biotic interactions with grazers may be strong promoters of divergence at different organismal levels.
In this general framework its possible to hypothesise that adaptation to a shifting environment will result in migration, mortality or local adapation of the species.
Genetic variation provides the necessary “fuel” for populations and species to evolve and adapt in changing environments (Hoffman et al., 2011; Lohbeck and Reusch, 2012), and may be reflected by physiological/morphological variations in the organisms.
Therefore, the aim of the following study is to describe and understand the divergence patterns in Fucus species from marginal areas, based on phenetic, phylogenetic and biological taxonomical criteria (Pante et al., 2015) characterised by algal morphology, allele frequencies of five microsatellite loci and levels of phlorotannins.
Considering that different marginal ecosystems are characterised by different species (Johannesson and Andrè 2006), this study will use a large number of individuals from Baltic Sea locations as well as a number of Fucus seaweeds from another brackish area outside the Baltic, namely Tjongspollen, located in the west coast of Norway, in order to better understand the species dynamics in Fucus seaweeds.
In short the main questions that this work will address are: What is the magnitude of divergence in each of the three different characters of the integrative taxonomy (morphology, genetics and biochemistry)?
Is there any correspondence between morphological, genetical and chemical traits in Fucus seaweeds?
2. MATERIALS AND METHODS
2.1 Sampling and study area
Individuals from sympatric populations of F. radicans and F.vesiculosus, commonly found at distance < 1, were collected in August 2014 from 10 localities in the Gulf of Bothnia along Swedish and Finnish coasts (Fig. 2.1.1).
Figure 2.1.1: Sampling area.
We also considered another peripheral area, namely Tjongspollen (Norway), characterised by different Fucus species but nonetheless useful to assess the extent of divergence among taxa in other brackish water areas.
Sampling was done at 0.5-3 m depth in approximate circular areas of 20m diameter, picking individuals separated by at least 1m to avoid the risk of picking individuals of the same clone.
Four localities were sampled in Sweden: Barsta, Djursten, Järnäs and Kuggören; six localities from Finland: Björneborg, Hällkalla Rauma, Sälskäret, Södra Vallgrund and Storskäret (Tab. 2.1). Finally, Norwegian Fucus specimens were collected from Tjongspollen at low and high salinity levels (Fig. 2.1.2).
Figure 2.1.2: Sampling area of Tjongspollen (Norway). The sheltered area is characterised by low
salinity level, outside that area the salinity level is higher
Table 2.1: Sampling data
Location Country Label Sample Size Latitude Longitude
Barsta Sweden BAR 140 62°51'39.60"N 18°24'7.44"E
Björneborg Finland BJO 43 61°28'48.00"N 21°20'56.57"E
Djursten Sweden DJU 95 60°22'7.32"N 18°24'4.14"E
Hällkalla Finland HAL 50 63°18'26.54"N 21° 5'22.62"E
Järnäs Sweden JAR 70 63°26'8.03"N 19°39'58.61"E
Kuggören Sweden KUG 140 61°41'55.62"N 17°30'59.16"E
Rauma Finland RAU 30 61° 8'36.52"N 21°18'17.81"E
Sälskäret Finland SAL 30 62°20'0.99"N 21°12'55.45"E
Södra (Val) Finland SOD (val) 80 63°20'13.00"N 21°22'55.00"E
Storskäret Finland STO 81 62°28'28.43"N 21° 8'8.93"E
2.2 Morphometric Analysis
Two individual measurements were used to determine morphological traits (Bergström et al 2005; Pereyra et al., 2009; Pereyra et al., 2013):
• frond width in the youngest dichotomy measured at three separate branches. • distance between dichotomies, measured from the oldest dichotomy.
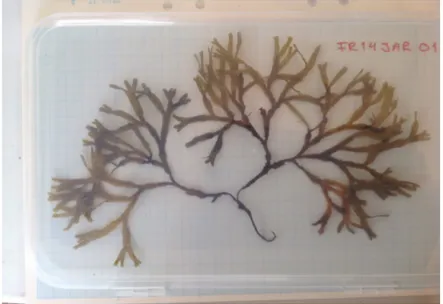
Three measuments were taken for each morphological variable. These variables were previously used to discriminate morphologically F. radicans and F.vesiculosus (Bergström et al., 2005). The measurement of morphological variables was performed for each individual sampled for each sampling spatial unit. The classification has been done (Fig. 2.2.1) with the program of image analysis ImageJ64 (Schneider et al., 2012) to estimate quantitatively the morphometric identification variables, to identify potentially misclassified individuals and the presence of hybrids in the populations analysed.
Figure 2.2.1: example of picture of Fucus radicans from Jarnas analysed with image analysis
imageJ-2.3 DNA extraction, PCR and Genotyping
DNA was extracted from dried algal tissue, adding 500 µl of 2% CTAB Extraction buffer, 17.5 µl of 0.1 M DIECA, 5 µl of 2-Mercaptoethanol, 10 µl RNase A solution (10mg/ml) and the mixture was incubated for one hour at 65 °C. After that DNA was extracted using the NucleoSpin Plant II Kit following the manufacturer’s instructions of Macherey-Nagel and the Zymo DNA Clean & Concentrator for the cleaning up and DNA purification following the manufacturer’s instructions of Zymo research (Zymo Research Corporation, Irvine, CA, U.S.A) (full protocol Appendix A).
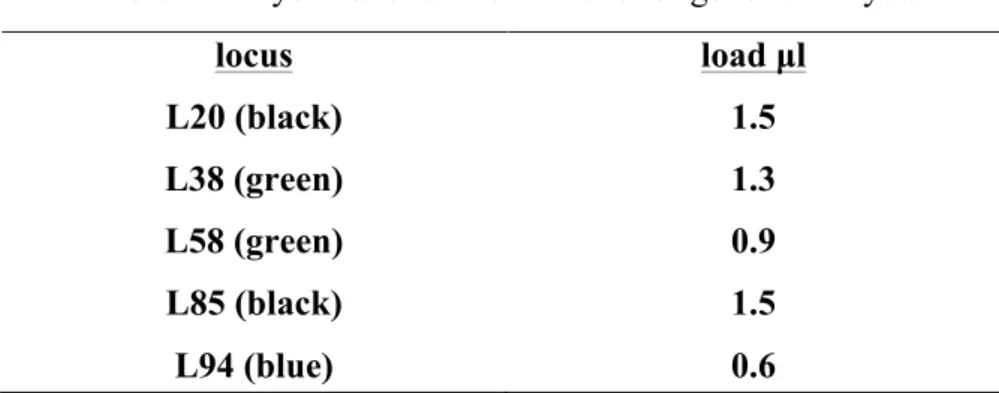
Individuals were genotyped at five polymorphic microsatellite loci L20, L38, L58, L85, L94 (Engel et al. 2003). Polymerase Chain Reaction (PCR) was performed in 10 µl reactions containing 0.5 µl DNA template and 9.5 µl containing 0.54 µl BSA 0.5 µg/ µl, 1.07 µl buffer 10x, 0.21 µl dNTPS 10 mM, 0.43 µl MgCl 50 mM, 0.54 each Forward and Reverse Primer 10 µM, 0.06 µl Platinum Taq polymerase for all loci except L58 for which 0.11 µl RBC Taq was used (Appendix B).
DNA products were visualised in 2% agarose gel (electrophoresis process) to verify the successful amplification. Alleles sizes were resolved and scored using Beckmann Coulter automated capillary sequencer (Tab. 2.2) and CeqMan 8000 software (Beckman-Coulter Inc., Fullerton, CA, USA) (Pereyra et.al., 2013).
Table 2.2: Dye and load informations for genetic analysis
locus load µl L20 (black) 1.5 L38 (green) 1.3 L58 (green) 0.9 L85 (black) 1.5 L94 (blue) 0.6
A ca. 350 bp region of the mitochondrial 23S subunit (Oudot-Le Secq et al., 2005) was used to assess the depth of divergence among Fucus individuals from Tjongspollen. PCR reactions were carried out in 43 ul volumes containing 1-3 ng of DNA template, 1 uM of each forward and reverse primer, 2 mM of dNTPs, 0.85 mM MgCl2 and 0.2 units of Platinum Taq (Invitrogen). PCR profile consisted of 94ºC, 2 min; followed by 94ºC, 30 s, 54ºC, 30 s, and 72ºC, 40 s for 40 cycles; and a final extension at 72ºC for 5 min. Sequencing was performed by Macrogen Co. (Seoul, South Korea).
2.4 Phlorotannins extraction
The chemical analyses consisted in the quantification of phlorotannins content for 20 individuals for each location (with the exception of Tjongspollen were all individuals were chemically analysed).
For phlorotannins extraction, 5-8 mg of dried tissue was ground to fine powder. For each sample, 1.5 ml aqueus acetone (60%) was added, a solvent that would extract polar coumpounds, such as phlorotannins.
Crude extracts were subsequently centrifuged, the acetone was evaporated in vacuum (rotary evaporator) and the remaining portion of water solution was filtered, with 20 µm filters, to remove any lipophilic material and diluted with distilled water.
Concentration of phlorotannins was quantified using the Folin-Ciolcateu (F-C) method (Folin and Ciolcateu, 1927). This method consists on an oxidation/reduction reaction, adding sodium carbonate (Na2CO3, 20g/100 ml) to the polyphenolic extract.
The reduced reagents produce a blue coloured solution that has been measured spectrophotometrically at wavelength of (λmax) 725 nm.
A standard curve for phloroglucinol was used (CAS no. 6099-90-7) to calculate the concentration in each extract.
The percentage of phlorotannin in dry tissue was calculated from concentrations values. (full protocol Appendix E)
2.5 Statistical analysis
GENECLONE 2.0 (Arnaud and Belkhir, 2007a) was used to estimate the extent of clonality in each locality by determining the probability of occurrence of repeated genotypes at random. . Those repeated genotypes identified as clones were removed from the subsequent genetic analysis of differentiation.
Program STRUCTURE 2.2 was used to infer the presence of distinct genetic clusters, assigning individuals to different groups to identify hybrids, putative migrants and individuals with admixed ancestry.
Bayesian approach is used by this program assuming a model in which there are K number of genetic cluster, each of which is characterized by a set of different allele frequencies at each locus and each individual in the sample are probabilistically assigned to clusters (Pritchard et.al., 2000a; Falush et al., 2003a-2007).
The model used by this program assumes Hardy-Weinberg and linkage equilibrium (Pritchard et al., 2000b) and therefore the need to remove the repeated genotypes, as clonality violates these assumptions.
Factorial component analysis (FCA) of GENETIX 4.05 program (Belkhir, et al., 2004), PCA (Principal Component Analysis) and classical MDS (Multi Dimensional Scaling) from the statistical program R (R Core Team, 2014), (Appendix F) were used to determine if there is a concordance between the two morphometric variables, the allele frequences of five microsatellites loci analysed and the chemical content of Phlorotannins.
Finnaly FastTree implemented in Geneious 9.0 has been used to compute a maximum likelihood tree to estimate the phylogenetic relationships for Tjongspollen individuals. The program uses Jukes Cantor model (Jukes and Cantor, 1969) of nucleotide evolution that produces a maximum likelihood estimate of the number of nucleotide substitutions between two sequences, and Shimodaira and Hasegawa test (Shimodaira and Hasegawa, 1999)to compute node support values.
3. RESULTS
Results from three levels (morphometry, genetics and chemistry) of analysis were elaborated to observe if there is a real correspondence between morphological, genetical and chemical traits in our investigation object, the brown seaweeds genus
Fucus, considering geographical distances and differentiation between species.
First, 881 individuals of wich 445 from Sweden, 364 from Finland and 72 from Norway were analyzed morphometrically. Results were performed trying to characterize different groups of individuals considering two morphological variables: thallus length and distance between dichotomies.
Second, genetics data (MGLs of five microsatellites) were analysed to determine the genetic differentiation level. DNA sequences of 768 total individuals were compared to a reference sequences to determine the genetic make up (genotype) of all Fucus individuals analysed.
Third, chemical data, including Phlorotannins content in terms of percentage of dry weight of tissue, were analysed using 250 individuals.
3.1 Morphometry
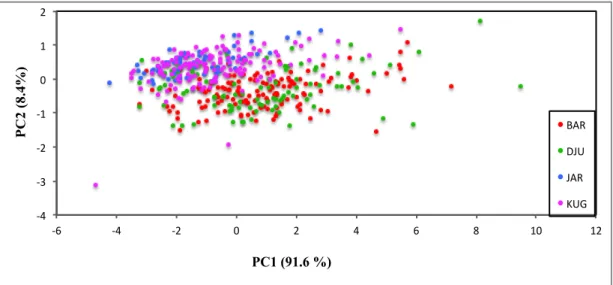
The distribution of data points in Figure 3.1.1 shows a discernable segregation of samples from Järnäs and Djürsten that are situated in diametrically opposed in the plot. In the middle of the plot with a partial overlap are located the samples from Barsta and Kuggoren, the former particularly aggregated with Djursten whilst the latter toward Järnäs.
!4# !3# !2# !1# 0# 1# 2# !6# !4# !2# 0# 2# 4# 6# 8# 10# 12# P C 2 (8.4%) PC1 (91.6 %) BAR# DJU# JAR# KUG#
Figure 3.1.1: Result of Principal Component analysis based on morphometric variables from Barsta,
Düjrsten, Järnäs and Kuggören localities. The two axis (PC1 and PC2) are first and second principal component that explain the percentage of morphometric variability.
Results from the Finnish localities show a complete overlap of morphological traits among individuals and therefore, it is not possible to distinguish any (Fig. 3.1.2).
!2# !1.5# !1# !0.5# 0# 0.5# 1# 1.5# !6# !4# !2# 0# 2# 4# 6# 8# 10# P C 2 (5%) PC1 (95%) BJO# HAL# RAU# SAL# SOD#(VAL)# STO#
Figure 3.1.2: Result of Principal Component analysis based on morphometric variables from Finland localities. The two axis (PC1 and PC2) are first and second principal component that explain the percentage of morphometric variability.
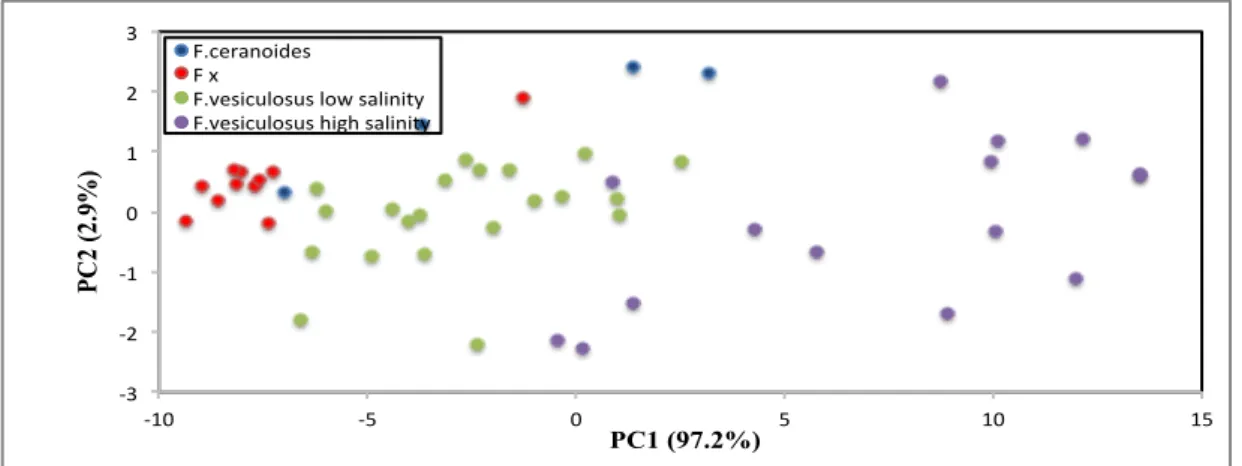
The morphological differentiation among Tjongspollen samples is clearer than the Finnish and Swedish individuals. Although the data points appear scattered, the aggregation of taxa according to the field identification is evident from the plot with rather limited morphological overlap (Fig. 3.1.3).
!3# !2# !1# 0# 1# 2# 3# !10# !5# 0# 5# 10# 15# PC 2 (2.9%) PC1 (97.2%) F.ceranoides# F#x# F.vesiculosus#low#salinity# F.vesiculosus#high#salinity#
Figure 3.1.3: Result of Principal Component analysis based on morphometric variables from Norway
(Tjongspollen), different colours are associated in relation of the species characterization considering morphometric variables. The two axis (PC1 and PC2) are first and second principal component that explain the percentage of morphometric variability.
3.2 Genetic results and populations structure
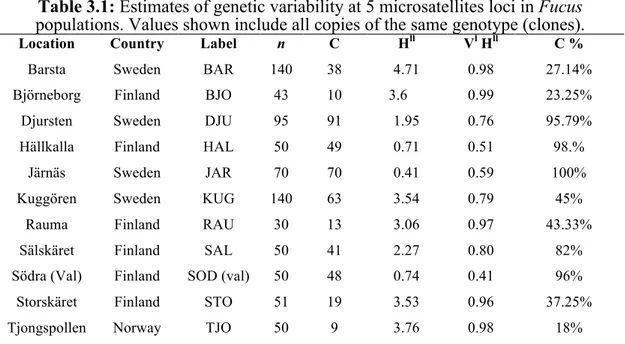
Genetics results considering all individuals from each locality revealed different levels of diversity.
Hällkalla, Järnäs, Södra (Val), where higher levels of clonality (96-100% of clonal
individuals) are identified.
The lowest levels of clonality has been identified in Barsta and Björneborg.
In Fact, Shannon index values adapted for genotypic biodiversity (Hll) show that these locations are characterised by higher levels of genotypic diversity with corresponding values of Eveness index (Vl Hll) higher than locations where there is a dominance of clonal individuals (Tab. 3.1).
Table 3.1: Estimates of genetic variability at 5 microsatellites loci in Fucus
populations. Values shown include all copies of the same genotype (clones).
Location Country Label n C Hll Vl Hll C %
Barsta Sweden BAR 140 38 4.71 0.98 27.14%
Björneborg Finland BJO 43 10 3.6 0.99 23.25%
Djursten Sweden DJU 95 91 1.95 0.76 95.79%
Hällkalla Finland HAL 50 49 0.71 0.51 98.%
Järnäs Sweden JAR 70 70 0.41 0.59 100%
Kuggören Sweden KUG 140 63 3.54 0.79 45%
Rauma Finland RAU 30 13 3.06 0.97 43.33%
Sälskäret Finland SAL 50 41 2.27 0.80 82%
Södra (Val) Finland SOD (val) 50 48 0.74 0.41 96%
Storskäret Finland STO 51 19 3.53 0.96 37.25%
Tjongspollen Norway TJO 50 9 3.76 0.98 18%
n number of samples C clonal individuals Hll Shannon index VllHll Evenness C% percentage of
clonality
Results from FCA based on allele frequencies, without any repeated genotype (clones) showed discernable aggregation by geographic locality within each region in Sweden (Fig. 3.2.1) and also among putative taxa from Norway as identified in the field.
By contrast, considering finnish locations (Fig. 3.2.2) it is not possible to distinguish between localities and is possible to evidence an overlap with an exclusion of some sample from Sälskäret that appear separate from the main group.
Finally for set of samples from Norway, in Figure 3.2.3 It is easier to observe three distinct genetics patterns showing one cloud represented by F.ceranoides, one by Fucus vesiculosus with a single set of points including samples collected in high and low salinity environment and another one for Fucus X (X= species not identified).
!0.5% 0% 0.5% 1% 1.5% 2% !0.5% 0% 0.5% 1% 1.5% 2% 2.5% 3% 3.5% Fac tor 2 (9.04%) Factor 1 (10.82%)" JAR% BAR% KUG% DJU%
Figure 3.2.1: Factorial correspondence analysis based on allele frequencies from five microsatellite
loci of samples from Sweden (withouth clones).
!1# !0.5# 0# 0.5# 1# 1.5# 2# 2.5# 3# !3.5# !3# !2.5# !2# !1.5# !1# !0.5# 0# 0.5# 1# 1.5# Fac tor 2 (9.36%) Factor 1 (10.46%)" SOD#(VAL)# STO# SAL# HAL# BJO# RAU#
Figure 3.2.2: Factorial correspondence analysis based on allele frequencies from five microsatellite
loci of samples from Finland (withouth clones).
!2# !1.5# !1# !0.5# 0# 0.5# 1# 1.5# !2.5# !2# !1.5# !1# !0.5# 0# 0.5# 1# 1.5# Fac tor 2 (9.94%) Factor 1"(11.8"%)" F.ceranoides# F#x# F.vesiculosus#low#salinity# F.vesiculosus#high#salinity#
Figure 3.2.3: Factorial correspondence analysis based on allele frequencies from five microsatellite
Results from Bayesian genetic clustering analysis (Fig. 3.2.4) showed a clear separation among Swedish localities. Within Barsta and Kuggören, individuals belonged to two different genetic entities. Another overlap is possible to be observed between Kuggoren and Järnäs while there is a separation between Djursten and Järnäs .
Figure 3.2.4: Bayesian assignment analysis based on genotypes data of five microsatellite loci
(without considering clones) of Fucus from ten Swedish and finnish locations.. Each vertical bar represents one individual. Fraction of colour in an individual represents its estimated membership to a certain genetic group. Black lines separate different localities. Sampling sites are labelled below the figure. K is a priori user-defined number of gene pools.
Genetic separation is showed between swedish and finnish locations, while the first are also separated each other (Fig. 3.2.1), the same uniformity showed by FCA (Fig. 3.2.2) is present also with Bayesian analysis considering finnish populations, where there is a dominance of one genetic entities putatively F.radicans, with the exception of some individuals that may be F.vesiculosus or hybrids between the two species.
In Tjonspollen, bayesian analysis (Fig. 3.2.5) revealed a clear genetic separation among putative taxa and ecomorphs (i.e. F. vesiculosus high salinity and low salinity). This analysis identifies a cohesive gentic identity that comprises all individuals from a previously unidentified morphology. Given this large genetic differentiation and in order to test the evolutionary depth of this divergence, further insight was gained from sequencing analysis.
Figure 3.2.5: Bayesian assignment analysis based on genotypes data of five microsatellite loci
(withouth considering clones) of Fucus from Tjongspollen. Each vertical bar represents one individual. Fraction of colour in an individual represents its estimated membership to a certain genetic group. Black lines separate different species. Sampling species of Fucus are labelled below the figure. K is a priori user-defined number of gene pools.
Figure 3.2.6, not only confirms the results from microsatellites but also unveils a closer genetic affinity of Fucus X with F.serratus than with F.vesiculosus or
F.ceranoides.
Figure 3.2.6: Phylogenetic tree showing evolutionary relation, based on genetical distances between Fucus species (Jukes and Cantor, 1969; Shimodaira and Hasegawa, 1999).
3.3 Phlorotannins content in algal tissue
The multidimensional scaling plots based on percentage of phlorotannin content in dry weight of algal tissue show no discernable pattern among populations from any of the Baltic localities. (Figures: 3.3.1, 3.3.2, 3.3.3, 3.3.4, 3.3.5,).
Phlorotonnanins concentration range 8-14% of dry weight in all samples but the differences within the range are usually considered normal in natural populations and not diagnostic.
!5E!07& !4E!07& !3E!07& !2E!07& !1E!07& 0& 0.0000001& 0.0000002&
!12& !10& !8& !6& !4& !2& 0& 2& 4& 6&
D ime n si on 2 Dimension 1 BAR& DJU& JAR& KUG&
Figure 3.3.1: Phlorotanin content in Fucus from Swedish localities. Multidimensional scaling
(MDS), based on distances matrices. Plot performed on percentage content of phlorotannin in dry weight of the algal tissue.
!5E!09& !4E!09& !3E!09& !2E!09& !1E!09& 0& 1E!09& 2E!09&
!12& !10& !8& !6& !4& !2& 0& 2& 4& 6& 8&
D ime ns ion 2 Cen $n ai a' Dimension 1' clonal&reproduc7on& sexual&reproduc7on&
Figure 3.3.2: Phlorotannin content in Swedish Fucus individuals with different reproductive strategies (sexual vs clonal) without any putative species subdivision. Multidimensional scaling
(MDS), based on distances matrices. Plot performed on percentage content of phlorotannin in dry weight of the algal tissue. .
!2.5E!07( !2E!07( !1.5E!07( !1E!07( !5E!08( 0( 5E!08( 0.0000001( 1.5E!07( 0.0000002( !8( !6( !4( !2( 0( 2( 4( 6( 8( 10( D ime n si on 2 Dimension 1 BJO( HAL( RAU( SAL( SOD((VAL)( STO(
Figure 3.3.3: Phlorotanin content in Fucus from Finnish localities. Multidimensional scaling
(MDS), based on distances matrices. Plot performed on percentage content of phlorotannin in dry weight of the algal tissue.
!5E!07& !4E!07& !3E!07& !2E!07& !1E!07& 0& 0.0000001& 0.0000002&
!12& !10& !8& !6& !4& !2& 0& 2& 4& 6& 8&
D ime ns ion 2 Dimension 1" clonal&reproduc8on& sexual&reproduc8on&
Figure 3.3.4: Phlorotannin content in Finnish Fucus individuals with different reproductive strategies (sexual vs clonal) without any putative species subdivision. Multidimensional scaling
(MDS), based on distances matrices. Plot performed on percentage content of phlorotannin in dry weight of the algal tissue.
!8.00E!08& !6.00E!08& !4.00E!08& !2.00E!08& 0.00E+00& 2.00E!08& 4.00E!08&
!8& !6& !4& !2& 0& 2& 4&
D ime ns ion 2 Dimension 1 F.ceranoides& F&x& F.vesiculosus&low&salinity& F.vesiculosus&high&salinity&
Figure 3.3.5: Phlorotanin content in Fucus from Tjongspollen, Norway. Multidimensional scaling
(MDS), based on distances matrices. Plot performed on percentage content of phlorotannin in dry weight of the algal tissue.
4. DISCUSSIONS AND CONCLUSIONS
The objective of this study was to assess the degree of divergence of Fucus seaweeds from the Baltic Sea and Tjonspollen in Norway at three biological levels:
• Morphology • Genetics • Chemistry
The purpose of this assessment was to determine whether any biotic or abiotic processes promote the local adaptation of particular traits and above all, if they promote divergent ecotypes at any organismal level.
The results from this study showed divergence at morphological and genetic levels to certain extent but complete lack of divergence at biochemical level (i.e. constitutive phlorotannin production) in the Baltic Sea or Norway.
Morphological divergence was clearly evident in Tjongspollen (Norway) among putative taxa as they were identified in the field and this divergence corresponds with their neutral genetic divergence.
In the Baltic, there are some distinguishable patterns in the morphology of the Swedish individuals according to locality to certain extent but not among putative taxa within localities. Likewise, these morphological patterns have genetic correspondence among localities but not within each locality.
At the biochemical level, measured by the phlorotannin contents there were neither evidence of divergence in Norway or the Baltic Sea nor any discernable aggregation pattern among or within localities.
4.1 Morphology and genetics
Morphological analysis from Swedish localities showed discernable patterns by locality that could be explained by geographical distance separating them to a certain extent. Individuals from Järnäs and Djursten are at the two extreme localities (northern and southern-most of this study) and show no overlap in morphological traits.
It is known that the environment may have a large influence in the morphological traits in fucoid algae (Knight and Parke, 1950; Burrows and Lodge, 1951; Pèrez-Ruzafa et al., 1993; Malm et al., 2001; Scott et al. 2001; Ruuskanen and Bäck, 2002; Coyer et al. 2006;) and the distance among localities may translate into differences in environmental conditions.
Thus, as geographic distances become larger, the more different the environment may become the more the morphology diverges.
The results support this hypothesis, as it is evident when plotting the morphology of individuals belonging to the two localities mediating the extremes (Barsta and Kuggören).
There is larger morphological overlap among individuals from contiguous localities than the more geographically distant. Nonetheless, considerably reduced gene flow and significant environmental differences are needed among localities for this hypothesis to hold as it is predicted by ecological divergence theory (Fig. 1.1.1). The steeper the cline is, the stronger the reproductive isolation might become.
The reproductive biology of Fucus also contributes to geographic reproductive isolation as gametes sink immediately after release, with limited dispersal capacity (Serrão et al., 1996), largely depending on strong water movements (currents, tides, upwelling) to disperse. In addition, Fucus vegetative reproduction in the Baltic effectively isolates individuals from gene flow, further contributing to the reduced gene flow.
In contrast, Fucus individuals from the Finnish coasts show no discernable pattern in morphological traits and instead, show large overlap among all the localities. This suggests either, homogeneous environmental conditions across this area have influenced their morphology or that other extrinsic or intrinsic factors influence more the morphological traits than the environment in this region.
In terms of correspondence with the genetic data, the morphological results show some congruence with the genetic subdivision to support the hypothesis of divergence due to different environmental conditions. However, the genetic results also show further genetic subdivision within some localities both in Finland and
Sweden that is not evident from the morphology (Fig. 3.2.4). This, of course, may not come as surprise if the environmental or ecological clines are not steep enough to create divergence at both organismal levels and since microsatellites are putatively neutral they are not expected to be associated with the morphological traits. By first identifying the repeated genotypes from each locality (Tab. 3.1), it was possible to infer together with previous studies which individuals correspond to F. radicans and
F. vesiculosus. Johannesson et al. (2011) reported high incidence of clonality in F. radicans and much lower in F. vesiculosus. In addition, these authors reported the
presence of at least two conspicuously dominating genotypes of F. radicans covering large geographical areas that are also present in this study (Fig. 3.2.4); blue bars in Järnäs, Hällkalla, South Vallgrund and Sällskaret).
Therefore, it can be concluded that while it is possible to find genetic divergence in Fucus from the Baltic Sea, in the absence of diagnostic morphological characters or when morphological traits are continuous, it is essential to use complementary information to distinguish between putative taxa such as reference individuals with diagnostic genetic and/or morphological traits to compare with.
A completely different scenario unveiled regarding Norwegian Fucus, there is a strong divergence at morphological and genetic level among co-occurring individuals.
That is, there is no obvious environmental cline as a potential divergence mechanism, suggesting that either historical or ecological mechanisms of divergence have or are acting in this area. Both morphological and genetic analysis show marked cohesiveness of F. ceranoides, F. vesiculosus from inside and outside Tjongspollen and also those to date formally undescribed individuals. The latter in fact, appeared largely differentiated and they may well warrant a new species status.
Regarding Fucus vesiculosus from low and high salinity (inside and outside Tjongspollen pool, respectively), the genetic separation is noticeable between them, which highlights the strong environmental influence both in morphology and genetically, effectively drifting apart.
4.2 Phlorotannins content
The phlorotannin range observed in this study in Baltic and Norwegian seaweeds is between 10-14%.
This is in line with previous studies (Kubanek et al., 2004) that underlined the higher phlorotannins content in the brackish water ecosystems such as the Baltic area and Tjongspollen pool with high levels of stress factors, like low salinity range and high seasonal temperature fluctuation, for local populations so that they have evolved varous physiological adapations (Rietema, 1991, 1993, 1995; Kristiansen et al., 1994; Düwel 2001; (Heggøy 2001).
As shown before, phlorotannin levels in the brown algae are significantly higher in Spring than in Autumn as a consequence of nitrogen availability (Chapman and Craigie ,1978; Hanisak 1983; Steinberg et al., 1994), and light availability (Pavia et al., 1997).
Nevertheless, despite the concordance with the expected salinity ranges according to the environmental conditions, the chemical analysis showed no differentiation between different groups. This evidence conflicts with previous studies regarding phlorotannins content as chemical defense against herbivores in which it has been shown a strong preference of the isopod Idotea balthica towards F. radicans in the presence of F. vesiculosus (Forslund et al., 2012; Ardehed et al., not yet published).
However, this might be explained by the fact that the present study analysed constitutive levels of phlorotannins and previous observed differences may have been inducible
Moreover, I. baltica, underlined as a potential driver of phlorotannin production as inducible defence (Forslund et al., 2012), is largely absent in the Swedish coasts of the Gulf of Bothnia so levels of phlorotannin might be depending mostly by environmental conditions.
4.3 Conclusions and future perspectives
In conclusion our study, based on phenetic, phylogenetic and biological taxonomical criteria, represent a favourable start point to understand the divergence patterns in Fucus species from marginal areas.
Nonetheless, the fact that there is strong divergence in morphology and genetics among several putative taxa without any obvious physical barriers or clines needs further investigation to unveil the mechanisms of divergence.
Our future perspectives include to investigate deeper about distribution and adaptative genetic variation among species that might probably be better explained by next-generation DNA sequencing (NGS) (Allendorf et al. 2010; Funk et al. 2012). Moreover, our chemical results represent an interesting subject to carry out future studies about phlorotannins production in Fucus seaweeds, and the mechanisms of phenotypic plasticity due to local adaptation in marginal ecosystems.
References
Allendorf, F. W., Hohenlohe, P. A., & Luikart, G., 2010. Genomics and the future of conservation genetics. Nat Rev Genet, 11(10), 697–709.
Arnaud-Haond, S., Alberto, F., Teixeira, S., Procaccini, G., Serrão, E. A., & Duarte, C. M. 2005. Assessing genetic diversity in clonal organisms: Low diversity or low resolution? Combining power and cost efficiency in selecting markers. Journal of Heredity..
Arnaud-Haond, S., & Belkhir, K. 2007a. GENCLONE: A computer program to analyse genotypic data, test for clonality and describe spatial clonal organization. Molecular Ecology
Notes.
Belkhir, K. et al., 2004. GENETIX 4.05, logiciel sous WindowsTM pour la genetique des populations. Laboratoire Genome et Populations, CNRS UPR 9060, Universite de Montpellier II, Montpellier, France.
Belkin, I. M., Cornillon, P. C., & Sherman, K. 2009. Fronts in Large Marine Ecosystems.
Progress in Oceanography, 81(1-4), 223–236.
Berger, R., Malm, T., & Kautsky, L. 2001. Two reproductive strategies in Baltic Fucus vesiculosus (Phaeophyceae). European Journal of Phycology, 36(October), 265–273. Bergström, L., Tatarenkov, A., Johannesson, K., Jönsson, R. B., & Kautsky, L. 2005a. Genetic and morphological identification of Fucus radicans sp. nov. (Fucales, Phaeophyceae) in the brackish Baltic Sea. Journal of Phycology.
Bergström, L., Tatarenkov, A., Johannesson, K., Jönsson, R. B., & Kautsky, L. 2005b. Genetic and morphological identification of Fucus radicans sp. nov. (Fucales, Phaeophyceae) in the brackish Baltic Sea. Journal of Phycology, 41(5), 1025–1038.
Billard, E.; Serrão, E.A.; Pearson, G.A.; Destombe, C.; Valero, M., 2010. Fucus vesiculosus and spiralis species complex: A nested model of local adaptation at the shore level, Marine
Ecology Progress Series, 405, Abril 2010, 163-174
Bryan, G. 1983. Seasonal biological variation in some leaf-miner parasites in the genus
Achrysocharoides (Hymenoptera,Eulo-phidae). Ecol. Entomol. 8: 259–270.
Burrows, E. M. & Lodge, S. 1951. Autecology and the species problem in Fucus. J. Mar.
Biol. Assoc. UK 30:161–76.
Chapman, A. R. O., Craigie, J. S. 1978. Seasonal growth in Laminaria Longicruris: relations with reserve carbohydrate storage and production. Mar. Biol. 46: 209-13.
Chapman, A. R. O. 1995. Functional ecology of fucoid algae: twenty-three years of progress.
Phycologia 34:1–32.
Connan, S., Goulard, F., Stiger, V., Deslandes, E., & Gall, E. a. 2004. Interspecific and temporal variation in phlorotannin levels in an assemblage of brown algae. Botanica Marina,
Coyer, J. A., Peters, A. F., Stam, W. T. & Olsen, J. L. 2003. Post-ice age recolonization and differentiation of Fucus serratus L.(Phaeophyceae; Fucaceae) populations in Northern Europe. Mol. Ecol. 12:1817–29.
Coyer, J. a., Hoarau, G., Oudot-Le Secq, M. P., Stam, W. T., & Olsen, J. L. 2006. A mtDNA-based phylogeny of the brown algal genus Fucus (Heterokontophyta; Phaeophyta). Molecular Phylogenetics and Evolution, 39, 209–222.
Coyer, J. a., Hoarau, G., Costa, J. F., Hogerdijk, B., Serrão, E. a., Billard, E., Olsen, J. L. 2011. Evolution and diversification within the intertidal brown macroalgae Fucus spiralis/F. vesiculosus species complex in the North Atlantic. Molecular Phylogenetics and Evolution,
58(2), 283–296.
Dayton, P. K. 1972. Towards an understanding of community resilience and the potential effects of enrichments to the benthos at McMurdo Sound, Antarctic. In: Parker BC ed. Conservations problems in Antarctica. Lawrence, Kansas, Allen Press, Inc.
Denton, A., A.R.O. Chapman and J. Markham. 1990. Size-specific concentrations of phlorotannins (antiherbivore compounds) in three species of Fucus. Mar. Ecol. Prog. Ser. 65:103–104.
Doebeli M, Dieckmann U: Speciation along environmental gradients. Nature 2003, 421:259-264.
Engel, C. R., Brawley, S. H., Edwards, K. J., & Serrão, E. 2003. Isolation and cross-species amplification of microsatellite loci from the fucoid seaweeds Fucus vesiculosus, F. serratus and Ascophyllum nodosum (heterokontophyta, fucaceae). Molecular Ecology Notes.
Falush, D., Stephens, M., and Pritchard, J. K., 2003a. Inference of population structure: Extensionsto linked loci and correlated allele frequencies. Genetics, 164:1567–1587.
Falush, D., Stephens, M., and Pritchard, J. K., 2007. Inference of population structure using multilocus genotype data: dominant markers and null alleles. Molecular Ecology Notes, 7:574–578.
Falush, D., Wirth, T., Linz, B., Pritchard, J. K., Stephens, M., and 13 others 2003b. Traces of human migrations in Helicobacter pylori populations. Science, 299:1582–1585.
Folin, O., & Ciocalteu, V. 1927. On tyrosine and tryptophane determinations in proteins. J.
Biol. Chem., 73, 627–650.
Forslund, H., Eriksson, O., Kautsky, L. 2012. Grazing and geographic range of the Baltic seaweed Fucus radicans (Phaeophyceae). Mar.Biol. 8: 322-330
Forslund, H., Kaustky, L. 2013. Reproduction and reproductive isolation in Fucus radicans (Phaephyceae). Mar. Biol. Res. 9: 321-326.
Funk, W. C., McKay, J. K., Hohenlohe, P. A., & Allendorf, F. W., 2015. Harnessing genomics for delineating conservation units. Trends in Ecology & Evolution, 27(9), 489– 496.
Gunnarsson K., Berglund, A. 2012. The brown alga Fucus radicans suffers heavy grazing by the isopod Idotea baltica. Mar.Biol. Res. 8, 87-89.
Gylle, A. M., Rantamäki, S., Ekelund, G. N., Tyystjärvi, E. 2010. Fluorescence emission spectra of marine and brackish-water ecotypes of Fucus vesiculosus and Fucus radicans (Phaeophyceae) reveal differences in light-harvesting apparatus. J. Phycol. 47: 98-105. Hanisak, D. 1983. The nitrogen relationships of marine macroalgae, p. 699-730. In E. Carpenter and D.Capone [eds.], Nitrogen in the marine environment. Academic.
Hagerman, L. 1966. The macro- and microfauna associated with Fucus serratus L., with some ecological remarks. Ophelia 3: 1-43.
Heggøy, E 2001. Algevegetasjonen i Tjongspollen, Bømlo, Hordaland. Master thesis, University of Bergen.
HELCOM 1996. Third periodic assessment of the state of the marine environment of the Baltic Sea, 1989–93: background document.Balt. Sea. Environ. Proc. No. 64 B, 252 pp. Hoffman, J. I., Grant, S. M., Forcada, J., & Phillips, C. D. 2011. Bayesian inference of a historical bottleneck in a heavily exploited marine mammal. Molecular Ecology, 20(19), 3989–4008.
Ignatius, H., Axberg, S., Niemisto¨, L. & Winterhalter, B. 1981. Quaternary geology of the Baltic Sea. In Voipio, A. [Ed.] The Baltic Sea. Elsevier Scientific Publishing Company, Amsterdam, pp. 54–104.
Johannessen, O. M., M. Miles, and E. Bjørgo. 1995.Tthe arctic’s shrinking sea ice. Nature 376: 126–127.
Johannesson, K., Forslund, H., Capetillo, N., Kautsky, L., Johansson, D., Pereyra, R. T., & Råberg, S. 2012. Phenotypic variation in sexually and asexually recruited individuals of the Baltic Sea endemic macroalga Fucus radicans: in the field and after growth in a common-garden. BMC Ecology.
Johannesson, K., Johansson, D., Larsson, K. H., Huenchuñir, C. J., Perus, J., Forslund, H., Pereyra, R. T. 2011a. Frequent clonality in fucoids (Fucus radicans and fucus vesiculosus; Fucales, phaeophyceae) in the baltic sea. Journal of Phycology.
Johannesson, K., Johannesson, B., Lundgren U: Strong natural selection causes microscale allozyme variation in marine snail, Proc Natl Acad Sci USA 1995, 92: 2602-2606.
Johannesson, K., Johansson, D., Larsson, K. H., Huenchuñir, C. J., Perus, J., Forslund, H., Pereyra, R. T. 2011b. Frequent clonality in fucoids (Fucus radicans and fucus vesiculosus; Fucales, phaeophyceae) in the baltic sea. Journal of Phycology.
Johannesson, K., Rolàn-Alvarez, E., Ekendhal, A., 1995. Incipient reproductive isolation between two sympatric morphs of the intertidal snail Littorina saxatilis. Evolution, 1130-1190.
Jormalainen V., Honkanen T., Heikkila N., 2001. Feeding preferences and performance of a marine isopod on seaweed hosts: cost of habitat specialization. Mar. Ecol. Progr. Ser. 220: 219-230.
Jukes TH & Cantor CR., 1969 Evolution of protein molecules. In Munro HN, editor,
Mammalian Protein Metabolism, pp. 21-132, Academic Press, New York.
Kalvas, A., Kautsky, L. 1993 Geographic variation in Fucus vesiculosus morphology in the Baltic and North Seas. Eur J Phycol, 28: 85-91.
Kautsky, H. and E. van der Maarel, 1990. Multivariate approaches to the variation of phytobenthic communities and environmental vectors in the Baltic Sea. Mar. Ecol. Progr. Ser. 60: 169-184.60:169
Kautsky, H., Kautsky, L., Kautsky, N., Kautsky, U. & Lindblad, C. 1992. Studies on the Fucus vesiculosus communities in the Baltic Sea. Acta Phytogeogr. Suec. 78:33–48.
Kautsky, L. & Kautsky, N. 2000. The Baltic Sea, including Bothnian Sea and Bothnian Bay. In Sheppard, C. R. C. [Ed.] Seas at the Millenium: An Environmental Evaluation. Pergamon, Elsevier Sciences, UK, pp. 121–33.
Knight, M. & Parke, M. 1950. A biological study of Fucus vesiculosus and F. serratus L. J.
Mar. Biol. Assoc. UK 29:439–99.
Korol A, Rashkovetsky E, Iliadi K, Nevo E. 2006. Drosophila flies in "Evolution Canyon" as a model for incipient sympatric speciation. Proc Natl Acad Sci USA, 103:18184-18189. Kristiansen, A. A., Pedersen, P. M. & Moseholm, L. 1994. Salinitytemperature effects on growth and reproduction of Scytosiphon lomentaria (Fucophyceae) along the salinity gradient in Danish waters. Phycologia 33:444–54.
Kubanek, J., Lester, S. E., Fenical, W., & Hay, M. E. 2004. Ambiguous role of phlorotannins as chemical defenses in the brown alga Fucus vesiculosus. Marine Ecology Progress Series,
277(2), 79–93.
LeClerc, J. E., Payne, W. L., Kupchella, E., and Cebula, T. A. 1998. Detection of mutator subpopulations in Salmonella typhimurium LT2 by reversion of his alleles. Mutation. Res. 400, 89-97.
Leidenberger, S., Harding K., Johnsson P. R., 2012. Ecology and the distribution of the Isopod Genus Idotea in the Baltic Sea: Key species in a changing environment. J. Crustac.
Biol. 32: 359-381.
Lobban, Christopher S., Paul J. Harrison, and Mary Jo Duncan. Physiological ecology of seaweeds. Cambridge University Press, 1985.
Lohbeck, K. T., Riebesell, U., & Reusch, T. B. H. 2012. Adaptive evolution of a key phytoplankton species to ocean acidification. Nature Geoscience, 5(5), 346–351.
Luttikhuizen, P. C., Drent, J. & Baker, A. J. 2003. Disjunct distribution of highly diverged mitochondrial lineage clade and FUCUS RADICANS 1037 population subdivision in a marine bivalve with pelagic larval dispersal. Mol. Ecol. 12:2215–29.
Malm, T. & Kautsky, L. 2003. Differences in life-history characteristics are consistent with the vertical distribution pattern of Fucus serratus and Fucus vesiculosus (Fucales, Phaeophyceae) in the central Baltic Sea. J. Phycol. 39:880–7.
Malm, T., Kautsky, L. & Engkvist, R. 2001. Reproduction, recruitment and geographical distribution of Fucus serratus L. in the Baltic Sea. Bot. Mar. 44:101–8.
Mathieson, A., Dawes, C., Wallace, A., et al. 2006. Distribution, morphology, and genetic affinities of dwarf embedded Fucus populations from the Northwest Atlantic Ocean.
Botanica Marina, 49(4), pp. 283-303.
Mayr, E. 1963. Animal Species and Evolution Belknap Press,Cambridge.
Meier, H. E. M., Kjellström, E., & Graham, L. P. 2006. Estimating uncertainties of projected Baltic Sea salinity in the late 21st century. Geophysical Research Letters, 33(15), 1–4. http://doi.org/10.1029/2006GL026488
Nylund, G. M., Pereyra, R. T., Wood, H. L., Johannesson, K., & Pavia, A. H. 2012. Increased resistance towards generalist herbivory in the new range of a habitat-forming seaweed. Retrieved from http://dx.doi.org/10.1890/.
Olsen, J. L., Stam, W. T., Coyer, J. A., Reusch, T. B. H., Billingham, M., Bostrom, C., Calvert, E., Christie, H., Granger, S., La Lumiere, R., Milchakova, N., Oudot-Le Secq, M. P., Procaccini, G., Pearson, G., Kautsky, L. & Serra˜o, E. 2000. Recent evolution in Baltic Fucus vesiculosus: reduced tolerance to emersion stresses compared to intertidal (North Sea) populations. Mar. Ecol. Prog. Ser. 202:67–79.
Olsen, J. L., Sadowski, G., Stam, W. T., Veldsink, T. H., Jones, K. 2002 Characterization of microsatellite loci in the marine seaweed Ascophyllum nodosum (Phaeophyceae; Fucales)..
Molecular Ecology Notes, 2, 33–34.
Pavia, H., Cervin, G., Lindgren, a, & Aberg, P. 1997. Effects of UVB radiation and simulated herbivory on phlorotannins in the brown alga Ascophylum nodosum Marine
Ecology Progress Series, 157, 139–146.
Pavia H., Toth G., Aberg P. 1999. Trade- offs between phlorotannin production and annual growth in natural populations of the brown seaweed Ascophyllum nodosum. J.Ecol. 87: 761-771.
Pearson, G., Serra˜o, E. A. & Cancela, M. L. 2001. Suppression subtractive hybridization for studying gene expression during aerial exposure and desiccation in fucoid algae. Eur. J.
Phycol. 36:359–66.
Pedersen, A. 1984. Studies on phenol content and heavy metal uptake in fucoids.
Hydrobiologia 116/117: 498–504.
Pereyra, R. T., Bergström, L., Kautsky, L., & Johannesson, K. 2009. Rapid speciation in a newly opened postglacial marine environment, the Baltic Sea. BMC Evolutionary Biology.. Pereyra, R. T., Huenchuñir, C., Johansson, D., Forslund, H., Kautsky, L., Jonsson, P. R., & Johannesson, K. 2013. Parallel speciation or long-distance dispersal? Lessons from seaweeds (Fucus) in the Baltic Sea. Journal of Evolutionary Biology..
Pritchard, J. K., Stephens, M., & Donnelly, P. 2000a. Inference of population structure using multilocus genotype data. Genetic,s 155:945–959.
Pritchard, J. K., Stephens, M., Rosenberg, N. A., and Donnelly, P. 2000b. Association mapping in structured populations. Am. J. Hum. Genet., 67:170–181.
R Core Team, 2014. R: A Language and Environment for Statistical Computing. R Foundation for Statistical Computing. Vienna, Austria. Available at:
http://www.rproject.org.
Ragan M. A., Globitza K. W. 1986. Phlorotannins, brown algal polyphenols. Prog. Phycol.
Res. 4: 129-241.
Ragan, M.A. and A. Jensen. 1978. Quantitative studies on brown algal phenols. II. Seasonal variation in polyphenol content of Ascophyllum nodosum (L.) Le Jol. and Fucus vesiculosus (L.).J. Exp. Mar. Biol. Ecol. 34: 245–258.
Rieseberg LH, Widmer A, Arntz MA, Burke JM. 2002. Directional selection is the primary cause of phenotypic diversification. Proc Natl Acad Sci USA, 99:12242-12245.
Rietema,H. 1991. Evidence for ecotypic divergence between Phycodrys rubens populations from the Baltic Sea and North Sea. Bot. Mar. 34:375–81.
Rietema, H. 1993. Ecotypic differences between Baltic and North Sea populations of Delesseria sanguinea and Membranoptera alata. Bot. Mar. 36:15–21.
Rietema, H. 1995. Ecoclinal variation in Rhodomela confervoides along a salinity gradient in the North Sea and Baltic Sea.Bot. Mar. 38:475–9.
Roff, J., Zacharias, M., 2011. Marine conservation ecology. Earthscan, UK.
Russell, G. 1985. Recent evolutionary changes in the algae of the Baltic Sea. Br. Phycol. J. 20:87–104.
Ruuskanen, A. & Bäck, S. 1999a. Morphological variation of northern Baltic Sea Fucus
vesiculosus L. Ophelia 50:43–59.
Ruuskanen, A. & Ba¨ck, S. 1999b. Does environmental stress affect fertility and frond regeneration of Fucus vesiculosus? Ann. Bot. Fennici 36:285–90.
Ruuskanen, A. & Ba¨ck, S. 2002. Morphological changes in submerged Fucus vesiculosus (L.) (Phaeophyta) along the salinity gradient of the River Keret estuary, Russia. Sarsia 87:185–8.
Santos M. G. L, Xavier C. C. A, Goes G. R. M, Rocha H. A. O, Leite E. L. 2004. Purification and chemical characterization of fucoidan from Fucus vesiculosus. In: Proc 2nd Int Symp Biochem Macromol Biotechnol. Recife, Brazil.
Schagerström, E., Forslund, H., Kautsky, L., Pärnoja, M., Kotta, J. 2014. Does thalli complexity and biomass affect the associated flora and fauna of two co-occurring Fucus species in the baltic Sea? Eust., Coast. Shelf Sci. 149: 187-193.