UNIVERSITA' DEGLI STUDI DI PISA
FACOLTA' DI MEDICINA E CHIRURGIA
DOTTORATO DI RICERCA
Fisiopatologia e Clinica dell’Apparato Cardiovascolare e
Respiratorio
Markers of small airway involvement and asthma control in
moderate-to-severe asthmatic patients
Relatore
Chiar.mo Prof. Pierluigi Paggiaro
Candidato
Dott. ssa Laura Malagrinò
* * *
Table of contents
Summary
4
Glossary
5
Introduction
6
Patients and methods
8
Study population
8
Study design8
Methods9
Statistic analysis11
Results
12
Discussion
14
References
18
Attachment A
26
Attachment B
29
SUMMARY
Background: Involvement of small airways has been hypothesized to be
responsible of poor asthma control in subgroups of patients, also due to the difficulty of inhaled drugs to reach peripheral airways.
Aim: To evaluate in a sample of moderate-severe asthmatic patients under
treatment with inhaled corticosteroid/long acting beta2-agonist (ICS/LABA) combinations, the relationship between asthma control, as assessed by traditional clinical, functional and biological findings, and some measurements of small airway involvement.
Patients and methods: 31 asthmatic patients regularly treated with ICS/LABA
combinations were evaluated for the level of asthma control according to GINA guidelines, by a 4-month period of diary card and peak expiratory flow (PEF) monitoring, FEV1 and exacerbation rate; sputum eosinophils and fractional exhaled nitric oxide (eNO50) were also measured. Small airway involvement
was assessed by single breath nitrogen washout (CV, ΔN2%), alveolo-arterial
O2 and arterial-alveolar CO2 gradients (AaDO2, aADCO2), and alveolar
concentration of nitric oxide (CalvNO).
Results: According to GINA guidelines, patients were defined as well controlled
(N=10), partly controlled (N=11) and not controlled (N=10). No significant difference was observed among the groups as regards markers of small airway involvement, as well as for biomarkers. When well controlled and partly controlled were considered together, not controlled patients showed a significantly higher AaDO2 difference. A significant correlation was observed
between AaDO2 and FEV1 %pred, sputum eosinophil percentage, and rescue medication use.
Conclusions: Small airway involvement as assessed by AaDO2 may be
observed in clinically not controlled moderate-severe asthmatics under ICS/LABA combination treatment, despite a not significant difference in FEV1 and airway biomarkers.
Glossary
V/Q Ventilation/perfusion eNO Exhaled nitric oxide
CalNO Alveolar concentration of nitric oxide JawNO Bronchial production of nitric oxide
FEV1 Forced expiratory volume in 1 second AaDO2 Alveolar-arterial difference in oxygen
aADO2 Arterial-alveolar difference in carbon dioxide
PEF Peak expiratory flow VC Vital capacity
TLC Total lung capacity RV Residual volume
ΔN2 L-1 Slope of the nitrogen alveolar plateau (phase III)
CV Closing volume
CV/VC Closing volume as percentage of vital capacity PaO2 Partial tension of oxygen
PaCO2 Partial tension of carbon dioxide
PAO2 Medium alveolar pressure of oxygen
PACO2 Medium alveolar pressure of carbon dioxide
Vd/Vt Physiologic deadspace ventilation ICS Inhaled corticosteroids
INTRODUCTION
Asthma is a chronic airway disease characterized by episodic symptoms that are associated with functional alterations. It is well known that airways inflammation plays a basic role in the pathogenesis of asthma, and many autoptic and bioptic studies have shown that inflammation involves the entire bronchial tree, from proximal to distal airways (1,2). Many studies have demonstrated that inflammatory cells, particularly eosinophils, are well represented in both the inner and the outer layer of the small airway walls, sometimes with a higher density in comparison with large airway walls (3,4). Small airways are the most peripheral airways with an internal diameter < 2 mm and in this zone oxygen and carbon dioxide exchanges take place. The contribution of small airways to the development of the clinical features and functional impairment in asthma is incompletely understood, probably due to the unavailability of definite non invasive techniques for the study of small airways. Pathological changes in the small airways can be detected by physiological tests. Among these, the single breath nitrogen washout test (SbN2) can be used
to evaluate the presence of uneven ventilation. In asthma, In’t Venn showed that airway closure as measured by the single breath nitrogen test, with evaluation of the slope of the phase III and of the closing volume, can discriminate between severe asthmatic patients with and without recurrent exacerbations during clinically stable episodes (5). This abnormal distribution of alveolar ventilation may result in a ventilation-perfusion (V/Q) ratio imbalance, determining pulmonary gas-exchange abnormalities that may reflect changes in the small airways (6,7). It was demonstrated that bronchoconstriction induced by methacoline (with a direct mechanism on smooth muscular cells) or by adenosine-5-monophosphate (with an indirect mechanism determining an inflammatory process) induces pulmonary gas exchange abnormalities as assessed by V/Q ratio (8). Interestingly, after inhaled salbutamol, which acts mainly on proximal airways, these disturbances persisted. Other indices of abnormal distribution of ventilation (like those derived from multiple-breath nitrogen washout technique or impulse oscillometry) have been used to assess small airway involvement (9-11), with some positive results in terms of either a distinction between symptomatic vs non symptomatic patients or a correlation
with other functional or inflammatory markers of airway involvement.
Some biomarkers have been studied to detect small airway inflammation in asthma (12). Fractional exhaled nitric oxide (eNO50) is currently the most
widely used biomarker in the exhaled breath and it is often increased in asthma, even in mild and asymptomatic condition (13). This measure can be done also at different expiratory flows resulting, by a mathematical model, in a measure of alveolar nitric oxide concentration (CalvNO) and bronchial nitric oxide flux (JawNO) (14). CalvNO has been considered as a marker of eosinophilic inflammation involving small airways (15), and some papers have shown that this measurement, but not eNO50, may distinguish controlled from uncontrolled
asthmatics (16, 17).
It is known that there are asthmatics with the same level of functional impairment of large airways as assessed by FEV1, but with different clinical control of disease, in terms of symptoms and exacerbations. Among the many possible explanations, it has been postulated that this different asthma control might be due to a different involvement of the peripheral airways. However, it is not clear if the pathology of small airways represents a different phenotype of asthma or if it represents just a marker of greater severity of the disease.
According to this background, we postulated that small airways dysfunction, as assessed by some functional and biological findings, may distinguish asthmatic patients with different levels of asthma control. In this attempt, we selected a homogeneous group of patients under regular treatment, and we compared markers of involvement of large (FEV1, sputum eosinophils) and small airways (single-breath test, alveolar-arterial differences of oxygen and carbon dioxide, eNO) between patients with controlled and uncontrolled asthma as assessed by GINA guidelines (18,19). Our hypothesis was that markers of small airway involvement may distinguish better than markers of large airway involvement uncontrolled asthmatics from controlled asthmatics.
PATIENTS AND METHODS Study population
Thirty-one patients (13 males, age: 55.9±10.7 yrs) were studied. All patients have been followed in our clinic since 1 year at least, and the diagnosis of asthma had been previously performed according to GINA guidelines in presence of typical symptoms and risk factors, and the demonstration of reversible airway obstruction and/or bronchial hyperresponsiveness (19). All patients had skin prick test performed to assess the presence of atopy, which was defined as a positive response (mean wheal diameter ≥ 5 mm) to at least one of the 11 common inhalants.
Patients were selected from our clinic routine according to the following criteria: a) male or female, never smoker or ex-smoker with less than 10 pack-years; b) regular treatment with GINA step 3 or step 4 level of therapy (medium-high doses of inhaled steroids and long acting beta-2-agonists) and a good level of compliance to treatment (as evaluated by the physician); c) a post-bronchodilator forced expiratory volume in 1 second (FEV1) ≥ 60% pred. To be included in the study, they needed to be clinically stable, without history of recent (< 4 weeks) exacerbations, and to have signed an informed consent.
Exclusion criteria included the frequent use of oral corticosteroids, severe comorbidities, or an history of brittle asthma. The study had been notified to the Local Ethic Committee.
Study design
The study took place in two days. In the first visit, all inclusion and exclusion criteria were checked and patients were asked to participate to the study. In the second visit, four weeks apart, each subject underwent, in the following: a) traditional standard pulmonary function tests, including expiratory flow/volume curves, static lung volumes by body pletismography, carbon monoxide diffusing capacity, and SBN2; b) resting alveolar-arterial and
arterial-alveolar differences of respiratory gases (AaDO2 and aADCO2); c)
measurement of biomarkers of airway inflammation (eNO and eosinophil percentages in sputum induction). All measurements were performed in the morning (between 8:30 to 12 am), after the patients had taken their regular
drugs in the early morning.
During the four weeks between visit 1 and visit 2, patients monitored daytime and nighttime symptoms and rescue medication use, and measured Peak Expiratory Flow (PEF) by Mini-Wright Peak Flow Meter (Clement Clarke International Limited, Edimburgh Way, Essex, CM20 2TT, UK) in the morning and in the evening, reporting these data on a diary card. At the second visit, asthma control was assessed, by taking in consideration the frequency of symptoms and rescue medication use, limitation in daily life, FEV1 and the rate of exacerbations in the last year. According to GINA Guidelines (12), patients were considered well controlled if they reported occasional symptoms and use of rescue medication (less than 2 times a week) as assessed by diary card of the previous 4 weeks, no limitation in daily life, FEV1 (in % of the best as assessed on the FEV1 measurements obtained in the year before the current study), no exacerbation in the last year and a PEF variability (as expressed by the mean value over 4 weeks of daily maximal amplitude: highest – lowest/mean) < 20%. Patients were defined as partly controlled if they did not satisfy to one or two of the previous criteria, while they were defined uncontrolled if three or more of the previous criteria were not satisfied. Patients were excluded from the study if they had presented an acute asthma exacerbation during the 4-week monitoring period.
Methods
Pulmonary function tests were obtained by a Medical Graphics Elite Series Tm Pletismograph (St. Paul, Minnesota, USA). The measurement of the flow/volume curves, static lung volumes and diffusing capacity were performed according to the acceptability and reproducibility criteria of ERS/ATS guidelines (20). SbN2 test was performed with the same apparatus (21). During this test
each patient performed a slow full inspiratory and expiratory vital capacity (VC) maneuver at flow rate of 0.5 L/sec while inhaling pure oxygen. The expiratory nitrogen concentration (%N2) was plotted against lung volume (between total lung capacity, TLC, and residual volume, RV), producing the expiratory nitrogen washout curve (21, 22). The slope of the nitrogen alveolar plateau (ΔN2) was
calculated by drawing the best fit line through phase III of expiratory volume/concentration curve (21). The first departure from this straight line
indicates the closing volume (CV), expressed as the ratio of VC (CV/VC). Both ΔN2 and CV/VC were directly calculated by the computer program and checked
by the same investigator, which might change the value if appropriate. The measurements were accepted only if VC during the single breath N2 test was
within 10% of the VC measured at spirometry.
A computer program to measure breath by breath alveolar pressure (PA), alveolo-arterial O2 gradient (AaDO2) and arterial-alveolar CO2 gradient
(aADCO2) by a mass-spectrometer (MSX of Collins-Morgan-Ferraris, Pisa, Italy)
was implemented.
This technique allows to assess the AaDO2 and aADCO2 by measuring
simultaneously the partial tensions of oxygen (PaO2) and carbon dioxide
(PaCO2) in the arterial blood (by arterial blood gas analysis) and their medium
alveolar pressure (PAO2 and PACO2), breath by breath, when the
instantaneous respiratory quotient equals the average within each tidal volume (Rahn's definition). In addition, analysis of arterial tension of CO2 and its
average expiratory pressure can estimate the physiological dead space (vd), expressed as the ratio of tidal volume (Vd/Vt), index of effective ventilation for gas exchange using Enghoff equation (PaCO2-PECO2/PaCO2) (23, 24).
Fractional eNO was measured in real time by NOA Sievers analyzer (NOA 280; Sievers, Boulder, CO, USA) on a single breath of 10 seconds against a resistance that results in an expiratory flow of 50 ml/sec (eNO50). The
mean value of at least two acceptable measures on the alveolar plateau of the nitric oxide (NO) concentration curve was considered. This method is well standardized and this value expresses the production of NO by lower airways (25). Fractional NO production was also computed using the mathematical model that allows analysis of the NO concentration measured at the mouth with a similar procedure, but obtained from different expiratory flows (50, 100 and 200 ml/sec, using different expiratory resistances). This technique allows to measure the NO concentration derived from the bronchioloalveolar district (CalvNO) and the NO production from the large and medium airways (JawNO) (14).
Sputum was induced according to the method previously described (26) using salbutamol pretreatment, hypertonic saline (NaCl, 4.5%) nebulized with an ultrasonic nebulizer (Ultraneb 2000, DeVilbiss, Somerset, Pa., USA) for
5-minute periods for up to 15 5-minutes, and FEV1 measurement before and every 5 minutes. Inhalation was stopped in presence of symptoms of bronchoconstriction, or excessive FEV1 decline(> 30% from baseline). The whole sputum sample was diluted with an equal volume of 0.1% dithiotreithol (Sputasol; Unipath Ltd, Basingstoke, UK). Samples were treated as previously reported (27) At least 300 non-squamous cells were counted. Macrophage, lymphocyte, neutrophil, eosinophil percentages were expressed as percent of total inflammatory cells, excluding squamous cells. The upper limit of normal range for sputum eosinophils was set at 2%, as measured in a group of normal subjects (28).
Furthermore, we presumed that in these patients with abnormal markers of small airway involvement, the addition of montelukast, an oral anti-inflammatory agent which may easily reach the small airways by the systemic administration, might modify these abnormalities. In this attempt, we added oral montelukast to the current inhaled therapy for one month and then we repeated all baseline measurements (see attachment A).
In addition, it is possible that alterations of small airways can cause flow limitation at rest. For this reason, in a subgroup of patients, the measurement of flow limitation, by Hyatt technique, using dedicated software, was performed (see attachment B).
Statistical analysis
Due to the exploratory nature of the study, no formal sample size calculation was made.
Patients were divided into “well controlled”, “partly controlled” and “not controlled” according to GINA Guidelines, after taking in consideration clinical and functional data as previously reported.
Data are expressed as mean (± standard deviation) or median (range) for normally and non normally distributed parameters. The comparison between controlled and non controlled patients were performed by one-way ANOVA comparison or by Mann-Withney or Kruskall Wallis tests for normally and non normally distributed parameters, respectively, and correlations between two variables by Pearson or Spearman tests respectively. A level of probability lower than 0.05 was considered as statistically significant.
RESULTS
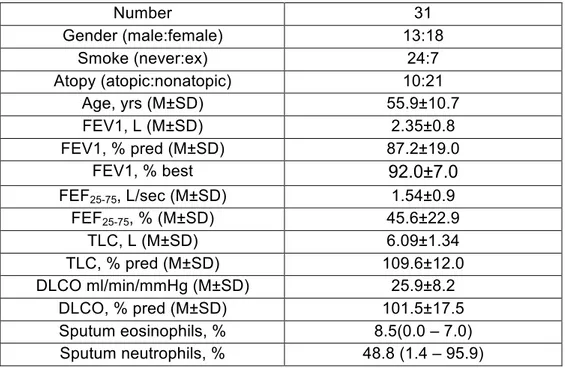
Thirty-two patients were enrolled in the study. One of them was not included due to the occurrence of asthma exacerbation during the monitoring period, requiring a short course of oral corticosteroids. The main clinical and functional data of the 31 patients examined are reported in Table 1. In the last 6 months, all patients were under regular treatment with inhaled corticosteroids (ICS: budesonide, 1600 mcg daily in 13 patients, fluticasone propionate 1000 mcg daily in 18 patients) associated with long-acting beta2-agonists (LABA). No patients had used montelukast or regular low-dose oral corticosteroids or anti-IgE treatment. They represented a sample of moderate-severe asthmatic patients, with mean FEV1 in the normal range: although 13 of them had a FEV1 value < 80%pred, it was however > 80% of their best value measured in the previous years. Static lung volumes and diffusion lung capacity were normal.
At the second visit, after the 4-week monitoring period, the control of asthma was assessed according to that previously reported (see methods). FEV1 value measured at this visit was compared with the best FEV1 obtained by the patient in the visits performed in our Unit in the previous years. According to GINA guidelines, patients were divided in: well controlled (N=10), partly controlled (N=11) and not controlled (N= 10). Table 2 shows the single values which contributed to the definition of the asthma control. Patients with partly controlled asthma were different from well controlled patients only for a higher number of asthma exacerbations in the previous year; in contrast patients with not controlled asthma differed from well controlled and/or partly controlled patients with respect to almost all findings which contributed to the evaluation of the asthma control, apart from FEV1.
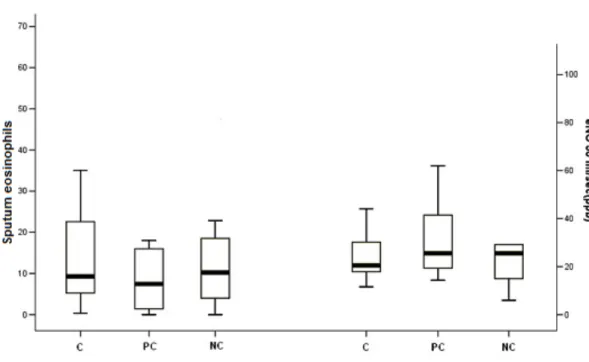
Sputum eosinophil percentage and fractional exhaled nitric oxide concentration in exhaled breath (eNO50) were not different among the different
categories of asthma control, both when three categories were considered separately (Figure 1) and when well controlled and partly controlled were considered together in comparison with not controlled patients. No difference among groups with different asthma control was observed for sputum neutrophil percentages (52.2[10.7-70.7]% vs 46.8[3.8-95.9]% vs 52.3[1.4-88.8]% in well controlled, partly controlled and not controlled patients, respectively.
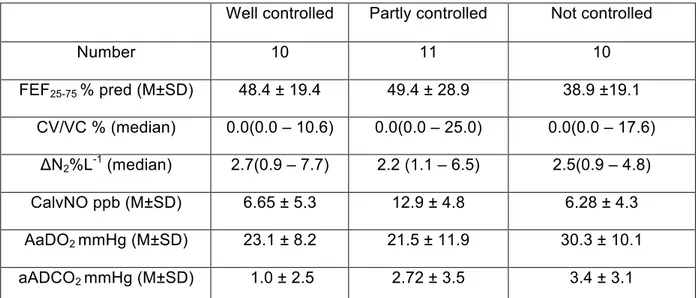
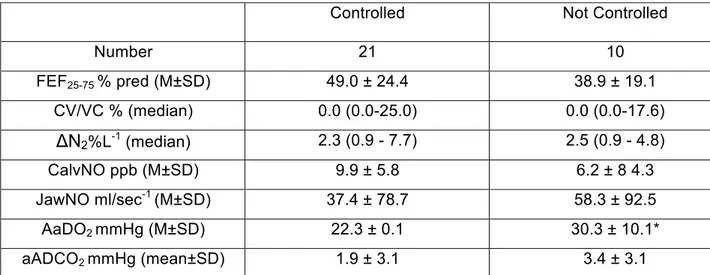
Markers of small airway involvement were not significantly different in the three categories of asthma control (Table 3). However, when we included patients with well controlled and partly controlled asthma in a same category of “controlled asthma”, we observed that not controlled patients showed a higher alveolar-arterial O2 difference than not controlled patients (Table 4). No
significant difference was still observed between these two categories as regards other markers of small airway involvement (mid-expiratory flow, single breath analysis, eNO).
Among markers of small airway involvement, alveolar-arterial O2
difference significantly correlated with FEV1 %pred (r=-0.49, p<0.05), weekly beta2use (r=0.42, p<0.05) and sputum eosinophil percentage (r=0.66, p<0.05) (Figure 2), while arterial-alveolar CO2 difference correlated with FEV1 %pred
(r=-0.40, p<0.05) and with PEF maximal amplitude (r=0.44, p<0.05). The slope of the nitrogen alveolar plateau significantly correlated only with FEV1 %pred (r=-0.42, p<0.05).
When patients were divided in two groups according to the normal value of the three markers of small airway involvement (ΔN2: < 1.5 %N2L-1, AaDO2: <
18 mmHg, and CalvNO: < 5 ppb), patients with abnormal AaDO2 had a
significantly higher rescue beta2 use (1.6±2.1 vs 0.3±0.7, p<0.05) and sputum eosinophil percentages (15.1[0-70] vs 2.6[0-13], p<0.05) compared with patients with normal AaDO2. No difference was found between patients with the
normal and abnormal values of ΔN2 and CalvNO.
There was no significant correlation between different markers of small airways involvement (ΔN2, AaDO2, CalvNO).
There was no significant difference between atopic and nonatopic patients for clinical and functional findings, including small airways involvement, except for a higher level of asthma severity in atopic subjects, as expressed by a higher rescue beta2-agonist use and a poorer level of control in atopic patients in comparison with nonatopic patients.
DISCUSSION
Our exploratory study shows that the measurement of the alveolar-arterial oxygen difference (AaDO2) may distinguish patients with uncontrolled
asthma from patients with well controlled or partly controlled asthma, despite they did not demonstrate a significant difference in FEV1 and other markers of large airway inflammation (like sputum eosinophil percentage and eNO50).
Because AaDO2 is an indirect measurement of the ventilation/perfusion (V/Q)
inequality related to an heterogeneous peripheral distribution of the alveolar ventilation, this finding supports the hypothesis that involvement of small airways is associated with poor asthma control.
Small airway dysfunction in asthma is well known to marginally contribute to the total airway resistance, while it strongly influences the peripheral distribution of the ventilation and the efficiency of the gas exchange. The evaluations of the alveolar-arterial and arterial-alveolar gradients of oxygen and carbon dioxide has been used several years ago to detect and quantify the abnormal V/Q ratio in patients with asthma or chronic obstructive pulmonary disease (COPD) showing that these measurements were frequently abnormal despite mildly reduced or normal FEV1 values (6, 29). Only few authors have evaluated the sensitivity of AaDO2 in detecting functional abnormalities in gas
exchange, in comparison with other methods commonly used for studying the abnormalities in the ventilation/perfusion ratio (8,30); in these cases, AaDO2
significantly increased after bronchial challenge also in presence of mild non significant reduction in FEV1. It is commonly believed that in airway diseases alveolar gradients of oxygen and carbon monoxide may be representative of the abnormal distribution of the convective ventilation due to some heterogeneity in the small airway involvement. We used a well validated method (23) for the assessment of gas exchange by automated analysis of O2 and CO2 alveolar to arterial differences according to Rahn’s definition. Contrary to the end-tidal values of gas concentration, this automatic technique allows a more precise determination of both extremes of the asynchronous emptying of the lung units, because the contribution of both low (shunt effect) and high (wasted ventilation) V/Q mismatch is considered (24). The importance of this technique, in comparison with the end-tidal method, has been demonstrated by Wagner (31)
in COPD patients using the multiple inert gas technique in terms of a better accuracy.
To our knowledge, this is the first study which used this specific measurement of V/Q inequality as a test of involvement of small airways in asthma, showing an association with poor asthma control. Many studies have assessed the inequality of distribution of ventilation in asthmatic patients, using different methods (single and multiple-washout nitrogen test, lung imaging, impulse oscillometry); in general these studies showed a relationship between these indices and the level of severity or control of asthma (10, 32) and an improvement in these indices after treatment with inhaled ICS or ICS/LABA combinations with the potential of reaching the lower airways (33). According to our data, we suggest that the measurement of the alveolar-arterial gradients of oxygen and carbon dioxide may represent a new test for the assessment of small airways involvement in asthma, maybe more sensitive than other traditional measurements.
Differently from other studies which examined patients with large variety of asthma severity and asthma treatment (from mild intermittent to severe persistent asthmatics, from untreated to regularly treated asthmatics with different level of asthma therapy) (10, 17), we selected a fairly homogeneous population with moderate-to-severe asthma, regularly treated with medium-high dose of ICS/LABA combinations but with different level of asthma control as assessed according to GINA guidelines. Furthermore, the evaluation of control was based on the accurate recording of symptoms, rescue medication use and PEF variability measured during a 4-week period immediately before the functional evaluation. Interestingly, the level of control was related neither to a different FEV1 in %pred, which showed a mild not significant difference among the three groups of asthma control, nor to a different level of markers of large airway inflammation (like sputum eosinophil percentage and eNO50). Although
there is still some uncertainty on which part of the airways sputum eosinophil and fractional eNO50 come from, there is large consensus that these
measurements are mainly expression of the inflammation of the more proximal airways (34). The possibility to distinguish controlled from not controlled asthmatic patients according to AaDO2 and not to FEV1, sputum eosinophils
factor contributing to a poorer asthma control.
Despite the lack of difference in sputum eosinophil percentage among patients with different level of asthma control, there was a significant correlation between AaDO2 and sputum eosinophil percentage. This observation might be
explained by the hypothesis that sputum eosinophil in larger airways (as assessed by the standard sputum induction procedure) may be associated with a higher level of eosinophilic inflammation also in the small airways, as it has been suggested by some morphologic studies (4), and then that this greater inflammatory involvement of the lower airways may influence the V/Q lung distribution as assessed by AaDO2. In alternative, sputum samples obtained
during the induction procedure may include secretions coming from both the large and the small airways (particularly the samples collected at the end of the induction procedure), then representing the inflammatory profile of both large and small airways.
We did not find any significant difference among categories of asthma control as regards single-breath nitrogen washout indices and fractional NO. This is in contrast with previous observations, which however included patients with a larger variety of asthma severity (from mild untreated to severe treated asthmatics) (16) or greater number of patients (35). This fact might be explained by a greater inter-patient variability in the measurement of ΔN2 and CalvNO in
comparison with AaDO2, therefore allowing to obtain a significant difference
between small samples of patients included in the different asthma categories with a more reproducible test than with other less reproducible tests.
Our study has some limitations. Firstly, the number of patients studied is relatively small and due to the exploratory characteristic of this study, a formal power calculation was not performed. However, we selected a fairly homogeneous group of moderate-severe asthmatic patients, in order to reduce the influence of asthma severity and level of anti-asthma treatment. Furthermore, other previous studies included a similar number of asthmatic patients (32, 36). Secondly, we did not use other putative markers of small airway involvement, like impulse oscillometry or lung imaging. However, we compared the new marker (AaDO2) with the two more frequently used tests
(ΔN2 and CalvNO) for studying small airways. Finally, a control group was not
asthmatics showing a clear distinction with the sample studied.
In conclusion, our study suggests that V/Q inequality of peripheral lung as measured by AaDO2 may be a marker of small airway involvement in
moderate-severe asthmatics using treatment with ICS and LABA, and that this measurement may be associated with a different level of asthma control better than more traditional markers of large airway involvement.
REFERENCES
1) Kraft M, Djukanovic R, Wilson S, et al. Alveolar tissue inflammation in asthma. Am J Respir Crit Care Med 1996; 154: 1505-10.
2) Carrol N, Cook C, James A. The distribution of eosinophils and lymphocytes in the large and small airways of asthmatics. Eur Respir J 1997; 10: 292-300.
3) Saetta M, Di Stefano A, Rosina C, et al. Quantitative structural analysis of peripheral airways in sudden fatal asthma. Am Rev Respir Dis 1991; 143: 138-143
4) Hamid Q, Song Y, Kotsimbos TC, et al. Inflammation of small airways in asthma. J Allergy Clin Immunol 1997; 100: 44-51.
5) In’t Venn JCCM, Beekman AJ, Bel EH, et al. Recurrent exacerbations in severe asthma are associated with enhanced airway closure during stable episodes. Am J Respir Crit Care Med 2000; 161: 1902-1906.
6) Levine G, Housley F, MacLeod P, Macklem PT. Gas exhange abnormalities in mild bronchitis and asymptomatic asthma. N Engl J Med 1970: 282: 1277-1282.
7) Wagner PD, West JB. Ventilation-perfusion relationships. In. West JB ed. Pulmonary gas exchange. New York: Academic Press, 1980: 219-62, chap 7. 8) Manrique HA, Gomez FP, Munoz AM, et al. Adenosine 5’-monophosphate in asthma: gas exchange and sputum cellular responses. Eur Respir J 2008; 31: 1205-1212.
9) Farah CS, King GG, Brown NJ, et al. The role of the small airways in the clinical expression of asthma in adults. J Allergy Clin Immunol. 2012;129: 381-387.
10) Shi Y, Aledia AS, Tatavoosian AV, et al. Relating small airways to asthma control by using impulse oscillometry in children. J Allergy Clin Immunol 2012; 129: 671-8.
11) LaPrad AS, Lutchen KR. Respiratory impedance measurements for assessment of lung mechanics: focus on asthma. Respir Physiol Neurobiol 2008; 30: 163: 64-73.
12) Kharitonov SA, Barnes PJ. Exhaled markers of pulmonary disease. Am J Respir Crit Care Med 2001; 163: 1693-722.
exhaled air of asthmatics. Eur Respir J 1993; 6: 1368-70.
14) Tsoukias NM, George SC. A two-compartment model of pulmonary nitric oxide exchange dynamics. J Appl Physiol 1998; 85: 653-666.
15) Jorres RA. Modelling the production of nitric oxide within the human airways. Eur Respir J 2000; 16: 555-560.
16) Berry M, Hargadon B, Morgan a, et al. Alveolar nitric oxide in adults with asthma: evidence of distal lung inflammation in refractory asthma. Eur Resp J 2005; 25: 986-991.
17) Lethimaki L, Kankaanranta H, Saarelainen S, et al. Increased alveolar oxide concentration in asthmatic patients with nocturnal symptoms. Eur Respir J 2002; 20: 841-845.
18) Bateman ED, Boushey HA, Bousquet J, et al. Can guideline-defined asthma control be achieved? The Gaining Optimal Asthma ControL study. Am J Respir Crit Care Med. 2004; 170: 836-44.
19) Global Initiative for Asthma (GINA), update 2012, www.ginasthma.org . 20) Miller MR, Hankinson J, Brusasco V, et al. Standardization of spirometry. Eur Respir J 2005; 26: 319-338.
21) Buist AS, Ross BB. Predicted values for closing volumes using a modified single breath nitrogen test. Am Rev Respir Dis 1973; 107: 744-52. 22) Sterk PJ, Quanjer PH, van Zomeren BC, et al. The single breath nitrogen test in epidemiological surveys; an appraisal. Bull Eur Physiopathol Respir 1981; 17: 381-97.
23) Giannella-Neto A, Paoletti P, Fornai E, Giuntini C. Estimates of mean alveolar gas in patients with chronic airways obstruction. Eur Respir J 1989; 2: 451-60.
24) Paoletti P, Fornai E, Giannella-Neto A, et al. The assessment of gas
exchange by automated analysis of O2 and CO2 alveolar to arterial differences. International Journal of Clinical Monitoring and Computing, 1986; 3: 89-97. 25) ATS/ERS. Recommendations for standardized procedure for the online and offline measurement of exhaled lower respiratory nitric oxide and nasal nitric oxide in adults and children. Am J Respir Crit Care Med 1999; 160: 2104-2177.
26) Bacci E, Cianchetti S, Carnevali S, et al. Induced sputum is a reproducible method to assess airway inflammation in asthma. Mediators
Inflamm 2002; 11(5): 293-8.
27) Cianchetti S, Bacci E, Ruocco L, et al. Granulocyte markers in hypertonic and isotonic saline-induced sputum of asthmatic subjects. Eur Respir J. 2004; 24: 1018-24.
28) Belda J, Leigh R, Parameswaran K, et al. Induced sputum cell counts in healthy adults. Am J Respir Crit Care Med. 2000; 161: 475-8.
29) Wagner PD. Ventilation-perfusion matching during exercise. Chest 1992; 101: 192S-198S.
30) Rodriguez Roisin R, Drakulovic M, Rodriguez D, et al. Ventilation-perfusion imbalance and chronic obstructive pulmonary disease staging severity. J Appl Physiol 2009; 106: 1902-8.
31) Wagner PD, Dantzker DR, Dueck R, et al. Ventilation-perfusion inequality in chronic pulmonary disease. J Clin Invest 1977; 59: 203-206.
32) Bourdin A, Paganin F, Préfaut C, et al. Nitrogen washout slope in poorly controlled asthma. Allergy 2006; 61: 85-9.
33) Scichilone N, Battaglia S, Sorino C, et al. Effects of extra-fine inhaled beclomethasone/formoterol on both large and small airways in asthma. Allergy. 2010; 65: 897-902.
34) Gershman NH, Liu H, Wong HH, et al. Fractional analysis of sequential induced sputum samples during sputum induction: evidence that different lung compartments are sampled at different time points. J Allergy Clin Immunol 1999;104: 322-8.
35) Puckett JL, Taylor RWE, Leu S-Y, et al. Clinical patterns in asthma based on proximal and distal airway nitric oxide categories. Respiratory Res 2010; 11: 47-55.
36) Verbanck S, Schuermans D, Noppen M, et al. Evidence of acinar airway involvement in asthma. Am J Respir Crit Care Med 1999; 159: 1545-50.
Legend of the figures
Figure 1. Box-plot of sputum eosinophil percentage and exhaled Nitric Oxide in controlled, partly controlled and non controlled patients.
C=controlled; PC= partly controlled; NC= not controlled; Eosinophils %= sputum eosinophils percentage; eNO= exhaled nitric oxide
Figure 2. Correlation between alveolar-arterial difference of oxygen and FEV1 (% predicted), sputum eosinophils (%) and use of β-2 agonist (weekly mean), respectively.
AaDO2= alveolar-arterial difference in oxygen, FEV1%= forced expiratory volume in the first second; Eosinophils %= sputum eosinophil percentage.
Table 1. Clinical and functional characteristics of the examined patients Number 31 Gender (male:female) 13:18 Smoke (never:ex) 24:7 Atopy (atopic:nonatopic) 10:21 Age, yrs (M±SD) 55.9±10.7 FEV1, L (M±SD) 2.35±0.8 FEV1, % pred (M±SD) 87.2±19.0 FEV1, % best 92.0±7.0 FEF25-75, L/sec (M±SD) 1.54±0.9 FEF25-75, % (M±SD) 45.6±22.9 TLC, L (M±SD) 6.09±1.34 TLC, % pred (M±SD) 109.6±12.0 DLCO ml/min/mmHg (M±SD) 25.9±8.2 DLCO, % pred (M±SD) 101.5±17.5 Sputum eosinophils, % 8.5(0.0 – 7.0) Sputum neutrophils, % 48.8 (1.4 – 95.9)
M= mean; SD= standard deviation; FEV1= forced expiratory volume in the first second; FEF25-75= forced expiratory flow between 25 and 75% of forced vital capacity; TLC= total lung capacity; DLCO= lung diffusion of carbon monoxide
Table 2. Level of control defined at the second visit, according to GINA guidelines, in the 31 examined patients
Well controlled Partly controlled Not controlled
N° 10 11 10 FEV1 % pred (M±SD) 89.6 ± 18.7 87.5 ± 24.6 82.7±16.3 Symptoms/week (M±SD) 0.3 ± 0.6 1.7 ± 2.1 10.6 ± 10.4* PEF-MA % (M±SD) 13.4 ± 7.2 22.0 ± 9.4 22.4 ± 7.6 ** beta2-use/week (median) 0.0 (0.0 - 2.0) 0.0 (0.0 – 2.0) 2.0 (1.5 - 7.0)* Exacerbations (median) 0.0 (0.0 – 1.0) 1.0 (0.0 – 2.0) ** 1.0 (1.0 – 3.0)** M= mean; SD= standard deviation; FEV1= forced expiratory volume in the first second; PEF-MA= daily maximal amplitude of Peak Expiratory Flow
*p<0.05 vs well controlled and partly controlled; ** p<0.05 vs well controlled § p<0.05 vs well controlled
Table 3. Comparison of the markers of small airway involvement between controlled, partly controlled and not controlled asthmatic patients.
Well controlled Partly controlled Not controlled
Number 10 11 10 FEF25-75 % pred (M±SD) 48.4 ± 19.4 49.4 ± 28.9 38.9 ±19.1 CV/VC % (median) 0.0(0.0 – 10.6) 0.0(0.0 – 25.0) 0.0(0.0 – 17.6) ΔN2%L-1 (median) 2.7(0.9 – 7.7) 2.2 (1.1 – 6.5) 2.5(0.9 – 4.8) CalvNO ppb (M±SD) 6.65 ± 5.3 12.9 ± 4.8 6.28 ± 4.3 AaDO2 mmHg (M±SD) 23.1 ± 8.2 21.5 ± 11.9 30.3 ± 10.1 aADCO2 mmHg (M±SD) 1.0 ± 2.5 2.72 ± 3.5 3.4 ± 3.1 M= mean; SD= standard deviation; FEF25-75= forced expiratory flow between 25 and 75% of forced vital capacity; ΔN2= the slope of the phase III obtained by the single breath nitrogen washout; CV= closing volume; VC= vital capacity; CalvNO= alveolar concentration of eNO; A-aDO2 and a-ADCO2= alveolar-arterial and arterial-alveolar differences in oxygen and carbon dioxide.
Table 4. Comparison of the markers of small airway involvement between controlled (well controlled and partly controlled) and not controlled patients
Controlled Not Controlled
Number 21 10 FEF25-75 % pred (M±SD) 49.0 ± 24.4 38.9 ± 19.1 CV/VC % (median) 0.0 (0.0-25.0) 0.0 (0.0-17.6) ΔN2%L-1 (median) 2.3 (0.9 - 7.7) 2.5 (0.9 - 4.8) CalvNO ppb (M±SD) 9.9 ± 5.8 6.2 ± 8 4.3 JawNO ml/sec-1 (M±SD) 37.4 ± 78.7 58.3 ± 92.5 AaDO2 mmHg (M±SD) 22.3 ± 0.1 30.3 ± 10.1* aADCO2 mmHg (mean±SD) 1.9 ± 3.1 3.4 ± 3.1
M= mean; SD= standard deviation; FEF25-75= forced expiratory flow between 25 and 75% of forced vital capacity; ΔN2= the slope of the phase III obtained by the single
breath nitrogen washout; CV= closing volume; VC= vital capacity; CalvNO= alveolar concentration of eNO; JawNO= bronchial production of eNO; A-aDO2 and a-ADCO2= alveolar-arterial and arterial-alveolar differences in oxygen and carbon dioxide. . *p<0.05
Attachment A
Twenty four of the 31 patients who completed the baseline evaluation accepted to add oral montelukast to the current therapy and to repeat all measurements after one month. After montelukast, no significant change in symptoms, rescue medication use, daily PEF variability, FEV1 (from 83.2±19.7 to 84.1±18.8 %pred, n.s.), and sputum eosinophils percentage (from 1.2 (0.3-70.0) to 12.8 (0.0-73.0) %,n.s.) was observed in comparison with the baseline evaluation, in all 24 patients. When indices of small airways involvement were considered (Table), no significant change was still observed. The selection of the 7 patients out of 24 who resulted not controlled at the baseline evaluation showed a trend to improve FEV1 (from 79.4±14.4 to 85.1±18.4 %pred, p=0.09) and fractional eNO (from 35.4±32.8 to 24.3±21.7 ppb, p=0.07) and a significant reduction in AaDO2 (from 32.1±7.9 to 25.87±.7 mmHg, p=0.034).
The addition of oral montelukast did not induce any significant improvement in the clinical, functional and biological findings, as well as in indices of small airway involvement. Our hypothesis was that the oral administration might allow to reach small airways and then improve at this level the inflammatory process, as suggested by previous papers (1). Also in this case, the exploratory characteristic of this study does not allow to draw any conclusion from this part of the study. In particular, only not controlled patients showed a significant improvement of AaDO2: this group was numerically very
small and there was no control group. Furthermore, the duration of montelukast treatment might be too short for demonstrate a positive effect, as some studies suggest that a longer duration of treatment is needed for obtaining a consistent anti-inflammatory effect. Therefore, no conclusion can be drawn from this part of the study, although the mild improvement in AaDO2 observed in not
controlled asthmatics might require to be assessed in larger groups of patients in presence of a control group.
Reference
1) Zelder MR, Kleerup EC, Goldin JG, et al. Montelukast improves regional air-trapping due to small airways obstruction in asthma. Eur Respir J 2006; 27: 307-15.
Table. Mean values of FEV1, sputum eosinophil percentages and indices of small airway involvement, before and one month after the addition of oral montelukast to the current therapy, in 24 asthmatic patients
Pre-montelukast Post-montelukast FEV1 % (M±SD) 83.2±19.7 84.1±18.8 FEF25-75 % pred (M ± SD) 38.1±16.9 40.2±14.9 CV/VC % (median) 0.0(0.0 – 25.0) 0.0(0.0 – 23.4) ΔN2 % L-1 (median) 2.3(0.9 – 7.7) 2.4(0.9 – 4.8) eNO50 ppb (M ± SD) 28.6±19.5 26.8±19.7 CalvNO ppb (M±SD) 9.1±6.0 10.8±8.1 PBrNO nl/sec-1(M±SD) 23.9±60.6 31.7±80.8 Sputum eosinophils % (median) 12.2(0.3 – 70.0) 12.8(0.0 – 73.0) AaDO2 mmHg (M±SD) 26.6±9.3 25.1±7.7 aADCO2 mmHg (M±SD) 2.63±2.8 2.45±2.9 PaO2 mmHg (M±SD) 84.0±9.2 84.8±8.1 Symptoms/Week (M±SD) 2.8±4.2 2.1±4.4 PEF-MA (M±SD) 20.2±8.7 16.9±11.1 beta2-use/week (median) 0.0(0.0 – 5.0) 0.0(0.0 – 3.0) M= mean; SD= standard deviation; FEV1= forced expiratory flow in the first second; FEF25-75= forced expiratory flow between 25 and 75% of forced vital capacity; CV= closing volume; VC= vital capacity; ΔN2= the slope of the phase III obtained by the
single breath nitrogen washout; eNO= exhaled nitric oxide; CalvNO= alveolar concentration of eNO; JawNO=bronchial production of eNO; Eo%= sputum eosinophil percentage; A-aDO2 and a-ADCO2= alveolar-arterial and arterial-alveolar differences in oxygen and carbon dioxide; PAO2= partial pressure of oxygen; PEF-MA= daily maximal amplitude of Peak Expiratory Flow. *p<0.05
Attachment B Ancillary Project
Flow-limitation (FL) at rest is a condition in which there is a reduction of expiratory flow reserve, whereby the subject breathes using the maximal expiratory flows at any given lung volume in rest conditions. In the case that a flow-limited patient needs to increase his or her minute ventilation (for example as a result of an effort), he or she will have to breath at larger lung volumes since at larger volumes higher flow rates are possible.
This situation causes an increase in Functional Residual Capacity (FRC), and therefore a reduction of Inspiratory Capacity (IC), called dynamic hyperinflation. This physiologic condition may be responsible for dyspnoea, since patients breaths in a less favourable area of the compliance (pressure/volume) curve and requires bigger efforts to achieve similar volumetric changes. FL can be evaluated by overlapping the maximal and tidal flow/volume curves, and FL is present if the two curves are superimposed and the ventilatory reserve is exhausted.
In COPD patients, FL has been studied in correlation to dyspnoea (1) and as possible determinant of exercise tolerance (2). However, in asthma we can make some simple considerations:
- maximal and tidal flow/volume curves may overlap at the average flow level (indices of small airways disease)
- inflammation, because of the “air trapping” phenomenon, correlates with increase in the static volume and then with lung hyperinflation
- lung hyperinflation may be a consequence of FL
FL may be an expression of the small airways dysfunction and may help to better characterize the different phenotypes of asthma.
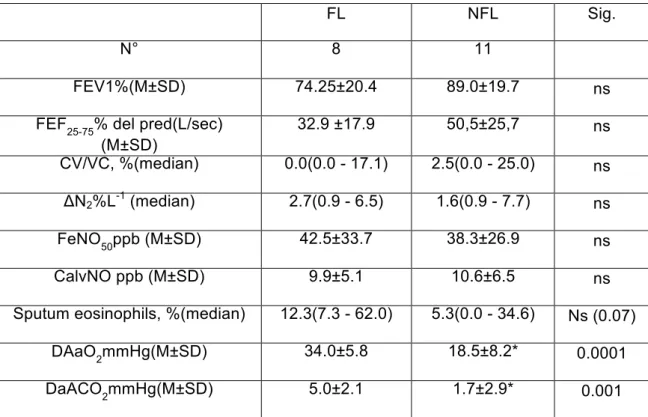
Based on the above considerations, a subgroup of our patients also underwent FL measurement according to the Hyatt technique (maximal and tidal flow/volume curves overlapping). Of nineteen asthmatics patients, who underwent FL measurement, eight were flow limited at rest. No significant differences in FEV1 and other functional parameters, including some small airway markers, was observed between flow limited and non flow limited patients, with the exception of AaDO2 and aADCO2 that are significantly higher
in the flow limited group. In this group a trend towards an increased inflammation has also been found (Table 1). Furthermore, flow limited patients used more frequently beta2 agonist as needed in comparison with non flow limited patients (Table 2).
These results indicate that the FL can identify a group of asthmatic patients with a more severe degree of disease. In fact, this group had a greater involvement of small airways (greater impairment of gas exchange), a lower disease control (greater beta2 agonist use) and had a greater tendency to inflammation.
Our sample is still too small to draw the final conclusion. It is possible that the FL may add useful information that can help to better characterize the asthmatic patient, as has been well demonstrated in COPD patient.
References
1) Eltayara L, Becklake MR, Volta CA, Milic-Emily J. Relationship between chronic dyspnea and expiratory flow limitation in patients with chronic obstructive pulmonary disease. Am J Respir Crit Care Med 1996; 154: 17260-17234.
2) Boni E, Corda L, Franchini D, Chiroli P, Damiani GP, Pini L, Grassi V, Tantucci C. Volume effect and exertional dyspnoea after bronchodilator in patients with COPD with and without expiratory flow limitation at rest. Thorax 2002; 57: 528-532.
Table1. Comparison of the functional and biological parameters between flow limited (FL) and no flow limited (NFL) asthmatic patients.
FL NFL Sig.
N° 8 11
FEV1%(M±SD) 74.25±20.4 89.0±19.7 ns
FEF25-75% del pred(L/sec) (M±SD) 32.9 ±17.9 50,5±25,7 ns CV/VC, %(median) 0.0(0.0 - 17.1) 2.5(0.0 - 25.0) ns ΔN2%L-1 (median) 2.7(0.9 - 6.5) 1.6(0.9 - 7.7) ns FeNO50ppb (M±SD) 42.5±33.7 38.3±26.9 ns CalvNO ppb (M±SD) 9.9±5.1 10.6±6.5 ns
Sputum eosinophils, %(median) 12.3(7.3 - 62.0) 5.3(0.0 - 34.6) Ns (0.07)
DAaO2mmHg(M±SD) 34.0±5.8 18.5±8.2* 0.0001
DaACO2mmHg(M±SD) 5.0±2.1 1.7±2.9* 0.001
M= mean; SD= standard deviation; FEV1= forced expiratory volume in first second; FEF25-75=
forced expiratory flow between 25 and 75% of forced vital capacity; ΔN2= the slope of the phase
III obtained by the single breath nitrogen washout; CV= closing volume; VC= vital capacity; CalvNO= alveolar concentration of eNO; A-aDO2 and a-ADCO2= alveolar-arterial and
arterial-alveolar differences in oxygen and carbon dioxide.
Table 2. Comparison of the clinical parameters between flow limited (FL) and no flow limited (NFL) asthmatic patients.
FL NFL Sig. N° 8 11 Symptoms/week (M±SD) 4.8±7.6 4.9±10.6 ns PEF-MA % (M±SD) 25.8±6.8 18.1±79.8 ns(0.08) beta2-use/week (median) 2.0(0.0 - 7.0) 0.0(0.0 – 2.0)* 0.02 Exacerbations (median) 1.0(0.0 – 3.0) 1.0(0.0 - 2.0) ns M= mean; SD= standard deviation; FEV1= forced expiratory volume in the first second;