DOI: 10.1126/science.1199172
, 69 (2011);
332
Science
et al.
O. Adriani
PAMELA Measurements of Cosmic-Ray Proton and Helium Spectra
This copy is for your personal, non-commercial use only.
clicking here.
colleagues, clients, or customers by
, you can order high-quality copies for your
If you wish to distribute this article to others
here.
following the guidelines
can be obtained by
Permission to republish or repurpose articles or portions of articles
):
October 23, 2012
www.sciencemag.org (this information is current as of
The following resources related to this article are available online at
http://www.sciencemag.org/content/332/6025/69.full.html
version of this article at:
including high-resolution figures, can be found in the online
Updated information and services,
http://www.sciencemag.org/content/suppl/2011/03/01/science.1199172.DC1.html
can be found at:
Supporting Online Material
http://www.sciencemag.org/content/332/6025/69.full.html#ref-list-1
, 1 of which can be accessed free:
cites 30 articles
This article
http://www.sciencemag.org/content/332/6025/69.full.html#related-urls
1 articles hosted by HighWire Press; see:
cited by
This article has been
http://www.sciencemag.org/cgi/collection/astronomy
Astronomy
subject collections:
This article appears in the following
is a
Science
2011 by the American Association for the Advancement of Science; all rights reserved. The title
Copyright
American Association for the Advancement of Science, 1200 New York Avenue NW, Washington, DC 20005.
(print ISSN 0036-8075; online ISSN 1095-9203) is published weekly, except the last week in December, by the
Science
on October 23, 2012
www.sciencemag.org
PAMELA Measurements of
Cosmic-Ray Proton and Helium Spectra
O. Adriani,1,2G. C. Barbarino,3,4G. A. Bazilevskaya,5R. Bellotti,6,7M. Boezio,8 E. A. Bogomolov,9L. Bonechi,1,2M. Bongi,2V. Bonvicini,8S. Borisov,10,11,12S. Bottai,2 A. Bruno,6,7F. Cafagna,7D. Campana,4R. Carbone,4,11P. Carlson,13M. Casolino,10 G. Castellini,14L. Consiglio,4M. P. De Pascale,10,11C. De Santis,10,11N. De Simone,10,11 V. Di Felice,10A. M. Galper,12W. Gillard,13L. Grishantseva,12G. Jerse,8,15A. V. Karelin,12 S. V. Koldashov,12S. Y. Krutkov,9A. N. Kvashnin,5A. Leonov,12V. Malakhov,12V. Malvezzi,10 L. Marcelli,10A. G. Mayorov,12W. Menn,16V. V. Mikhailov,12E. Mocchiutti,8A. Monaco,6,7 N. Mori,1,2N. Nikonov,9,10,11G. Osteria,4F. Palma,10,11P. Papini,2M. Pearce,13
P. Picozza,10,11* C. Pizzolotto,8M. Ricci,17S. B. Ricciarini,2L. Rossetto,13R. Sarkar,8 M. Simon,16R. Sparvoli,10,11P. Spillantini,1,2Y. I. Stozhkov,5A. Vacchi,8E. Vannuccini,2 G. Vasilyev,9S. A. Voronov,12Y. T. Yurkin,12J. Wu,13† G. Zampa,8N. Zampa,8V. G. Zverev12 Protons and helium nuclei are the most abundant components of the cosmic radiation. Precise measurements of their fluxes are needed to understand the acceleration and subsequent propagation of cosmic rays in our Galaxy. We report precision measurements of the proton and helium spectra in the rigidity range 1 gigavolt to 1.2 teravolts performed by the satellite-borne experiment PAMELA (payload for antimatter matter exploration and light-nuclei astrophysics). We find that the spectral shapes of these two species are different and cannot be described well by a single power law. These data challenge the current paradigm of cosmic-ray acceleration in supernova remnants followed by diffusive propagation in the Galaxy. More complex processes of acceleration and propagation of cosmic rays are required to explain the spectral structures observed in our data.
S
ince the discovery of cosmic rays, various mechanisms have been proposed to explain the acceleration of particles to relativistic energies and their subsequent propagation in our Galaxy. It was pointed out long ago (1, 2) that supernovae fulfill the power requirement to en-ergize Galactic cosmic rays. Subsequently, mod-els were put forward explaining the acceleration of cosmic-ray particles via diffusive shock accel-eration produced by supernova shock waves prop-agating in the interstellar medium [see (3) for a review].At the end of the acceleration phase, particles are injected into the interstellar medium where they propagate, diffusing through the turbulent Galactic magnetic fields. Nowadays, this propa-gation is well described by solving, numerically (4) or analytically (5, 6), the transport equations for particle diffusion in the Galaxy. The Galac-tic magneGalac-tic fields mask the arrival direction of charged particles, making the cosmic-ray flux isotropic, although there are hints of anisotropy in the 10- to 100-TeV range (7).
Recent PAMELA ( payload for antimatter matter exploration and light-nuclei astrophysics) measurements of the antiparticle component of the cosmic radiation (8–10) have prompted a re-evaluation of possible contributions from addi-tional Galactic sources, either of astrophysical [e.g., pulsars (11)] or exotic [e.g., dark matter (12, 13)] origin. Detailed knowledge of cosmic-ray spectra is needed to: (i) identify sources and acceleration/propagation mechanisms of cosmic rays; (ii) estimate the production of secondary particles, such as positrons and antiprotons, to disentangle the secondary-particle component from possible exotic sources; and (iii) estimate the par-ticle flux in the geomagnetic field and in Earth’s atmosphere for in-orbit dose estimations and to derive the atmospheric muon and neutrino flux, respectively.
We present absolute cosmic-ray proton and helium spectra in the rigidity interval between 1 GV and 1.2 TV (Fig. 1 and tables S1 and S2), based on data gathered between 2006 and 2008 with PAMELA, a detector orbiting Earth in a
350- to 610-km, 70°-inclination orbit as part of the Russian Resurs-DK1 spacecraft (14).
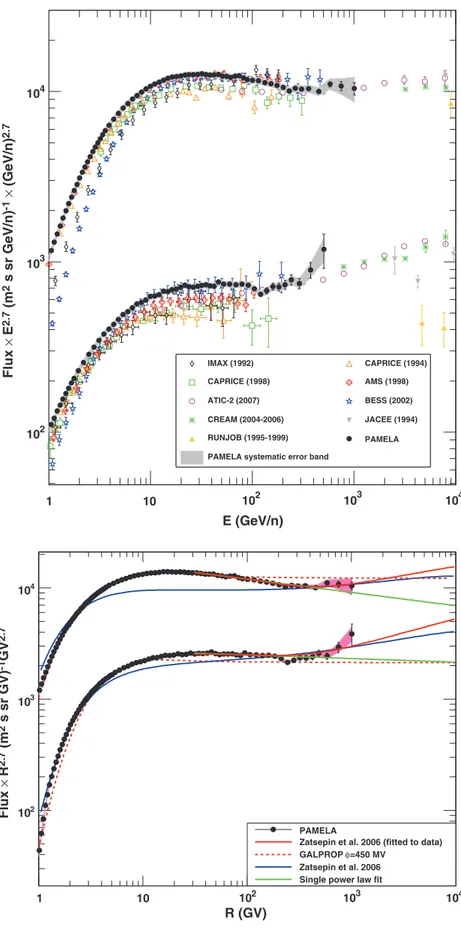
Our results are consistent with those of other experiments (Fig. 1), considering the statistical and systematic uncertainties of the various ex-periments. There are differences at low energies (< 30 GeV) caused by solar-modulation effects [PAMELA was operating during a period of min-imum solar activity with a solar-modulation pa-rameter (F) of 450 to 550 MV in the spherical force-field approximation (15)]. PAMELA results overlap with Advanced Thin Ionization Calorim-eter (ATIC)–2 data (16) between ~200 and ~1200 GV, but differ both in shape and absolute normal-ization at lower energies. The extrapolation to higher energy of the PAMELA fluxes suggests a broad agreement with the results of CREAM (Cos-mic Ray Energetics and Mass Experiment) (17) and JACEE (Japanese-American Collaborative Emulsion Experiment) (18); the extrapolation of PAMELA helium flux is higher than the helium flux measured by RUNJOB (Russia-Nipon Joint Balloon) experiment (19).
To gain a better understanding of the spectra, we have analyzed our results in terms of rigidity instead of kinetic energy per nucleon (Fig. 2 and tables S3 and S4). Two important conclusions can be drawn from the PAMELA data.
First, the proton and helium spectra [J(R)] have different spectral shapes. If a single power law,JðRÞ ¼ AR− gR(whereA is the normalization constant,R is rigidity, and g is the spectral index), is fit to the data between 30 GV (above the influ-ence of solar modulation) and 1.2 TV, the result-ing spectral indices are gR30−1000 GV,p¼ 2:820 T 0:003(stat) T0:005(syst) and gR
30−1000 GV,He¼
2:732 T0:005(stat)þ0:008
−0:003(syst), which establishes
that there is a significant difference between the two spectral indices in this rigidity region (stat, statistical errors; syst, systematic errors; p, proton; He, helium). These effects are also seen in Fig. 3 (and in table S5), where the proton-to-helium flux ratio is shown as a function of rigidity. Present-ing the results as a ratio reduces the possible impact of systematic errors, because a number of instru-mental effects cancel in the ratio (for example, the estimation of live time and the error associated with the alignment of the tracker and the track-reconstruction algorithm). The proton-to-helium flux ratio shows a continuous and smooth de-crease as the rigidity inde-creases. The same ratio cast in terms of kinetic energy per nucleon or total kinetic energy exhibits more irregular behavior (fig. S1). By applying a power-law approxima-tion to the two spectra, the ratio can be used to determine the difference between the two spec-tral indices with a smaller associated systematic error DgR¼ gRp− gRHe¼ 0:101 T 0:0014 (stat) T
0:0001(sys). The ratio is well described by a power law down to rigidities as low as 5 GV (green line in Fig. 3). For rigiditiesR >> F, the ratio of the two species is independent of the solar-modulation parameter and allows∆gfor the interstellar spectrum to be measured in the
1Department of Physics, University of Florence, I-50019 Sesto
Fiorentino, Florence, Italy.2Istituto Nazionale di Fisica Nucleare
(INFN), Sezione di Florence, I-50019 Sesto Fiorentino, Florence, Italy.3Department of Physics, University of Naples“Federico II,” I-80126 Naples, Italy.4INFN, Sezione di Naples, I-80126 Naples,
Italy.5Lebedev Physical Institute, RU-119991, Moscow, Russia. 6
Department of Physics, University of Bari, I-70126 Bari, Italy.
7INFN, Sezione di Bari, I-70126 Bari, Italy.8INFN, Sezione di
Trieste, I-34149 Trieste, Italy.9Ioffe Physical Technical Institute,
RU-194021 St. Petersburg, Russia.10INFN, Sezione di Rome “Tor Vergata,” I-00133 Rome, Italy.11Department of Physics,
University of Rome“Tor Vergata,” I-00133 Rome, Italy.12Moscow
Engineering and Physics Institute, RU-11540 Moscow, Russia.
13
Department of Physics, Kungliga Tekniska Högskolan, and the Oskar Klein Centre for Cosmoparticle Physics, AlbaNova Uni-versity Centre, SE-10691 Stockholm, Sweden.14Istituto di Fisica
Applicata Nello Carrara, I-50019 Sesto Fiorentino, Florence, Italy.15Department of Physics, University of Trieste, I-34147
Trieste, Italy.16Department of Physics, Universität Siegen,
D-57068 Siegen, Germany.17INFN, Laboratori Nazionali di Frascati, Via Enrico Fermi 40, I-00044 Frascati, Italy. *To whom correspondence should be addressed. E-mail: [email protected]
†On leave from School of Mathematics and Physics, China University of Geosciences, CN-430074 Wuhan, China.
REPORTS
on October 23, 2012
www.sciencemag.org
rigidity range of 5 to 30 GV, where solar-modulation effects dominate. Previous measure-ments (20–24) did not have the statistical and systematic precision to demonstrate this decrease in the ratio.
Secondly, as seen in Fig. 4, the PAMELA data show clear deviations from a single–power-law model. The spectrum of protons gradually softens in the rigidity range 30 to 230 GV. In the rigidity range 30 to 80 GV, gR30−80GV;p¼ 2:801 T
0:007(stat) T 0:002(syst), which is lower than the value fitted between 80 to 230 GV: gR80−230GV,p¼
2:850 T 0:015(stat) T 0:004(syst). In the case of helium, gR30−80GV,He ¼ 2:71 T 0:01(stat) T 0:002(syst), which is lower than gR
80−230GV,He¼
Fig. 1. Proton and helium absolute fluxes measured by PAMELA above 1 GeV per nucleon, compared with a few of the previous measurements (16–24). All but one of the previous measurements (24) come from balloon-borne experiments. Previous data up to few hundred billion electron volts per nucleon were collected by magnetic spectrometer experiments (20–24), whereas higher-energy data come from calorimetric measurements. PAMELA data cover the energy range 1 GeV to 1.2 TeV (1 to 600 GeV per nucleon for He). The fluxes are expressed in terms of kinetic energy per nucleon, converted from the rigidity measured in the tracker and neglecting any contribution from less abundant deuterium (d/p ≃ 1%) (where d is deuterium) and3He (3He/4He≃ 10%). Therefore, pure proton and4He samples are assumed. Error bars are statis-tical and indicate 1 SD; the gray shaded areas represent the estimated systematic uncertainty. E, kinetic energy per nucleon.
E (GeV/n) 1 10 102 103 104 Flux × E 2.7 (m 2 s sr GeV/n) -1 × (GeV/n) 2.7 2 10 3 10 4 10 IMAX (1992) CAPRICE (1994) CAPRICE (1998) AMS (1998) ATIC-2 (2007) BESS (2002) CREAM (2004-2006) JACEE (1994) RUNJOB (1995-1999) PAMELA
PAMELA systematic error band
IMAX (1992) CAPRICE (1994) CAPRICE (1998) AMS (1998) ATIC-2 (2007) BESS (2002) CREAM (2004-2006) JACEE (1994) RUNJOB (1995-1999) PAMELA PAMELA systematic error band
Fig. 2. Proton (top data set) and helium (bottom data set) fluxes measured by PAMELA in the rigidity range 1 GV to 1.2 TV. The pink shaded areas represent the estimated systematic uncertainty. The lines represent the fit with a single power law and the GALPROP (36) and Zatsepin (29) models. Details of the models are presented in tables S1 and S2. R (GV) 1 10 102 103 104 Flux × R 2.7 (m 2 s sr GV) -1GV 2.7 2 10 3 10 4 10 PAMELA
Zatsepin et al. 2006 (fitted to data) =450 MV
φ
GALPROP Zatsepin et al. 2006 Single power law fit
REPORTS
on October 23, 2012
www.sciencemag.org
2:77 T 0:03(stat) T 0:004(syst). We applied Fisher’s and Student’s t tests to the single–power-law hypothesis in the range 30 to 230 GV for both protons and helium [see section 5 of the sup-porting online material (SOM) for details]. This hypothesis is rejected at the 95% confidence level (CL). Considering the same rigidity interval in terms of kinetic energy per nucleon, the Fisher’s and Student’s t tests reject a single–power-law hypothesis at 99.7% CL.
At 230 to 240 GV, the proton and helium data exhibit an abrupt spectral hardening. Applying Fisher’s test and Student’s t test to the proton spectrum above 80 GV, the single–power-law hypothesis is rejected at 99.7% CL if only sta-tistical errors are considered. A similar result is obtained if the fluxes are increased in line with the systematic uncertainties. If the fluxes are instead decreased, the single–power-law hypoth-esis is rejected at 95% CL. The hardening of the
proton spectrum occurs at 232þ35−30GV with change of spectral index from gR80−232GV;p¼ 2:85 T
0:015(stat) T 0:004(syst) to gR
>232GV;p¼ 2:67 T
0:03 T 0:05. For the helium data, the single– power-law hypothesis is rejected at 95% CL with spectral hardening setting in at 243þ27−31 GV and a corresponding change of spectral in-dex of gR80−240GV;He¼ 2:766 T 0:01 T 0:027 and
gR
>243GV;He¼ 2:477 T 0:06 T 0:03. As a
con-sistency check, we repeated this analysis with the three highest-energy data points excluded; no changes in the proton and helium results were observed. We obtained similar results when we used alternative statistical methods such as the cumulative sum test (see section 5.4 in the SOM). One of the most notable features of the cos-mic rays before PAMELA observations was their apparently featureless energy spectra. Until now, single power laws, as predicted by the shock dif-fusion acceleration model and diffusive propaga-tion in the Galaxy [see (25) for a recent review], could reproduce spectra using similar spectral indices (a fit to the experimental data yields g ≃ 2:7) for protons and heavier nuclei up to energies of about≈1015eV (the so-called“knee” region). Such assumptions are routinely incorpo-rated into commonly used propagation models such as GALPROP (4), which is widely con-sidered to be the standard model of cosmic-ray acceleration and propagation. Our results chal-lenge this scenario (26). As can be seen in Figs. 2 and 3, the GALPROP calculation does not re-produce PAMELA data across the full-rigidity region. Moreover, it is difficult, even with recent models of nonlinear shock acceleration (27, 28), to produce significant differences in the proton and helium spectra as low as a few tens of gigavolts. The hardening in the spectra observed by PAMELA around 200 GV could be interpreted as an indication of different populations of cosmic-ray sources. As an example of a multisource model, Fig. 2 shows a comparison with a calculation by Zatsepin and Sokolskaya (29) (blue curves), which was put forward to explain ATIC-2 data (16) and considered novae stars and explosions in super-bubbles as additional cosmic-ray sources. The pa-rameters of the model were fitted to match ATIC-2 data and, consequently, are in disagreement with PAMELA data in absolute fluxes and the ratio. If the parameters of this model are fitted to the PAMELA data, the agreement can be greatly im-proved (red curves in Figs. 2 and 3). CREAM also reported a direct measurement, albeit with a low statistical and systematic significance, of a change of the slope for nuclei (Z ≥ 3) at 200 GeV per nucleon; that is, at a higher rigidity ð≃ 400 GVÞ than our observed break in the he-lium spectrum.
An indication that proton and helium have dif-ferent spectral indices at high energy (~10 TeV) was reported by JACEE (18). More recently, CREAM (17)—also using AMS (alpha magnetic spectrometer) (24) and BESS (balloon-borne experiments with a superconducting spectrometer) (30) data—indirectly inferred that spectral
defor-R (GV) 1 10 102 103 104 p/He 1 10 PAMELA
Zatsepin et al. 2006 (fitted to data) =450 MV
φ
GALPROP Zatsepin et al. 2006 Single power law fit
Fig. 3. Ratio of the flux between proton and helium data of PAMELA versus rigidity. The gray shaded area represents the estimated systematic uncertainty. Lines show the fit using a single power law (describing the difference of the two spectral indices) and the GALPROP (36) and Zatsepin models with the original values of the paper (29) fitted to the data. Details of the models are presented in tables S1 and S2.
R (GV) R (GV) 10 102 103 Flux × R 2.7 (m 2 s sr GV) -1 GV 2.7 Flux × R 2.7 (m 2 s sr GV) -1 GV 2.7 4 10 Proton 10 102 103 3 10 Helium
Fig. 4. Proton (left) and helium (right) spectra in the range 10 GV to 1.2 TV. The gray shaded area represents the estimated systematic uncertainty, and the pink shaded area represents the contribution due to tracker alignment. The green lines represent fits with a single power law in the rigidity range 30 to 240 GV. The red curves represent the fit with a rigidity-dependent power law (30 to 240 GV) and with a single power law above 240 GV.
on October 23, 2012
www.sciencemag.org
mation should occur at ~200 GeV per nucleon for both species. This is similar to our results for protons but higher (400 GV) than our results for helium. Results from ATIC-2 (16) implied that protons and helium nuclei have different energy spectra, although the results suffered from unclear sys-tematic uncertainties, and there were differences with respect to previously reported ATIC-1 (31) data.
References and Notes
1. P. O. Lagage, C. J. Cesarsky, Astron. Astrophys. 118, 223 (1983).
2. V. L. Ginzburg, S. I. Syrovatskii, The Origin of Cosmic Rays (Macmillan, New York, 1964).
3. M. A. Malkov, L. O.’C. Drury, Rep. Prog. Phys. 64, 429
(2001).
4. A. W. Strong, I. V. Moskalenko, Astrophys. J. 509, 212 (1998).
5. F. C. Jones, A. Lukasiak, V. Ptuskin, W. Webber, Astrophys. J. 547, 264 (2001).
6. F. Donato et al., Astrophys. J. 563, 172 (2001). 7. M. Amenomori et al., Science 314, 439 (2006). 8. O. Adriani et al., Nature 458, 607 (2009). 9. O. Adriani et al., Phys. Rev. Lett. 102, 051101 (2009). 10. O. Adriani et al., Phys. Rev. Lett. 105, 121101 (2010). 11. C. Grimani, Class. Quantum Gravity 26, 235009 (2009). 12. N. Arkani-Hamed, D. P. Finkbeiner, T. R. Slatyer,
N. Weiner, Phys. Rev. D 79, 015014 (2009). 13. G. Kane, R. Lu, S. Watson, Phys. Lett. B 681, 151 (2009). 14. PAMELA comprises a number of high-performance
detectors, capable of identifying particles through the determination of charge (Z), rigidity (R = pc/|Z|e, where p is the momentum of a particle of charge Ze, c is the speed of light, and e is the electron charge), and velocity (b = v/c, where v is the velocity) over a wide energy range. The device is built around a permanent magnet with a six-plane double-sided silicon microstrip
tracker, providing absolute charge information and
track-deflection (h = T1/R, with the sign depending on
the sign of the charge derived from the curvature direction) information. A scintillator system, composed of three double layers of scintillators (S1, S2, S3 in fig. S2) provides the trigger, a time-of-flight measurement, and an additional estimation of absolute charge. A silicon-tungsten tracking calorimeter, a bottom scintillator (S4), and a neutron detector are used to perform lepton-hadron discrimination. An anticoincidence system is used off-line to reject spurious event triggers generated by particles interacting in the apparatus. Respect to balloon-borne experiments, PAMELA has the advantage of a substantially longer period of uninterrupted observing time. Furthermore, taking data in space is not affected by environmental systematics such as those due to correction for secondary particles produced in the residual atmosphere that affects balloon-borne experiments. A more detailed description of PAMELA and the analysis methodology can be found in (32, 33) and in the SOM.
15. L. J. Gleeson, W. I. Axford, Astrophys. J. 154, 1011 (1968). 16. J. P. Wefel et al., in Proceedings of the 30th International
Cosmic Ray Conference, R. Caballero et al., Eds. (Universidad Nacional Autónoma de México, Mexico City,
2008), vol. 2, pp. 31–34.
17. H. S. Ahn et al., Astrophys. J. Lett. 714, L89 (2010). 18. K. Asakimori et al., Astrophys. J. 502, 278 (1998). 19. M. Hareyama, RUNJOB collaboration, J. Phys. Conf. Ser.
31, 159 (2006).
20. W. Menn et al., Astrophys. J. 533, 281 (2000). 21. M. Boezio et al., Astrophys. J. 518, 457 (1999). 22. M. Boezio et al., Astropart. Phys. 19, 583 (2003). 23. S. Haino et al., Phys. Lett. B 594, 35 (2004). 24. AMS Collaboration, Phys. Lett. B 490, 27 (2000). 25. A. W. Strong, I. V. Moskalenko, V. S. Ptuskin, Annu. Rev.
Nucl. Part. Sci. 57, 285 (2007).
26. The changing spectral characteristics of the proton spectrum between 30 and 230 GV may be partly due to heliospheric effects. Although solar-modulation effects are considered negligible above 30 GV in the spherical
force-field approximation (15), more detailed models, which use the full Parker equation to describe the propagation of cosmic rays in a two- or three-dimensional heliosphere (34, 35), may be needed to fully understand the impact of this effect.
27. D. Caprioli, P. Blasi, E. Amato, Astroparticle Phys.; preprint available at http://arxiv.org/abs/1007.1925.v2 (2010).
28. D. C. Ellison, D. J. Patnaude, P. Slane, P. Blasi, S. Gabici, Astrophys. J. 661, 879 (2007).
29. V. I. Zatsepin, N. V. Sokolskaya, Astron. Astrophys. 458, 1 (2006).
30. T. Sanuki et al., Adv. Space Res. 27, 761 (2001). 31. H. S. Ahn et al., Adv. Space Res. 37, 1950 (2006). 32. P. Picozza et al., Astropart. Phys. 27, 296 (2007). 33. M. Casolino et al., Adv. Space Res. 42, 455 (2008). 34. J. R. Jokipii, E. H. Levy, W. B. Hubbard, Astrophys. J. 213,
861 (1977).
35. M. S. Potgieter, J. Atmos. Sol. Terr. Phys. 70, 207 (2008). 36. A. E. Vladimirov et al., preprint available at http://arxiv.
org/abs/1008.3642v1 (2010).
37. We thank P. Blasi, F. Donato, P. Lipari, and I. Moskalenko for helpful discussions concerning the interpretation of our results and D. Marinucci for helpful discussions on statistical methods. We acknowledge support from the Italian Space Agency, Deutsches Zentrum für Luft- und Raumfahrt, the Swedish National Space Board, the Swedish Research Council, the Russian Space Agency (Roscosmos), and the Russian Foundation for Basic Research.
Supporting Online Material
www.sciencemag.org/cgi/content/full/science.1199172/DC1 SOM Text
Figs. S1 to S6 Tables S1 to S7 References
18 October 2010; accepted 9 February 2011 Published online 3 March 2011;
10.1126/science.1199172
Spontaneous Ferroelectric Order in a
Bent-Core Smectic Liquid Crystal of
Fluid Orthorhombic Layers
R. Amaranatha Reddy,1Chenhui Zhu,2Renfan Shao,2Eva Korblova,1Tao Gong,1 Yongqiang Shen,2Edgardo Garcia,1,3Matthew A. Glaser,2Joseph E. Maclennan,2 David M. Walba,1Noel A. Clark2*
Macroscopic polarization density, characteristic of ferroelectric phases, is stabilized by dipolar intermolecular interactions. These are weakened as materials become more fluid and of higher symmetry, limiting ferroelectricity to crystals and to smectic liquid crystal stackings of fluid layers. We report the SmAPF, the smectic of fluid polar orthorhombic layers that order into a
three-dimensional ferroelectric state, the highest-symmetry layered ferroelectric possible and the highest-symmetry ferroelectric material found to date. Its bent-core molecular design employs a single flexible tail that stabilizes layers with untilted molecules and in-plane polar ordering, evident in monolayer-thick freely suspended films. Electro-optic response reveals the three-dimensional orthorhombic ferroelectric structure, stabilized by silane molecular terminations that promote parallel alignment of the molecular dipoles in adjacent layers.
T
he first theoretical description of the orientational ordering of liquid crystals was by Born, who in 1916 formulated an electric analog of the Curie-Weiss mean-field mod-el of ferromagnetism [see, for example, (1)] to describe a fluid with spontaneous macroscopicordering of its molecular electric dipoles (2). Such a liquid crystal would be the highest symmetry ferroelectric phase, with only a fluid macroscopic polarization and its required uniaxial optical an-isotropy as broken symmetries. This phase, in which the polarization would be fluid
(energet-ically free to adopt any orientation), has not yet been realized because known molecular archi-tectures do not have interactions that are strong enough to stabilize polar order in the translation-ally symmetric milieu of a three-dimensional (3D) liquid. The more recent discoveries of spontane-ous polar ordering (3) and macroscopic chirality (4) in fluid smectic liquid crystals (LCs) of achiral bent-core molecules, phases of stacked 2D fluid layers, has opened a new path for making ma-terials with polar fluid degrees of freedom, exploit-ing the much stronger intermolecular interaction afforded by their polar steric molecular shape, the exploration of which has generated a rich new class of soft materials (5, 6).
The bent-core fluid lamellar LCs can be grouped according to whether the constituent 2D layers have an optical dielectric tensor principal axis (OPA) along the layer normal (SmA, orthogonal) or not (SmC, monoclinic). The orthogonal achiral
1
Department of Chemistry and Biochemistry, Liquid Crystal Materials Research Center, University of Colorado, Boulder, CO 80309–0215, USA.2Department of Physics, Liquid Crystal
Materials Research Center, University of Colorado, Boulder, CO 80309–0390, USA.3Laboratório de Química Computacional, Instituto de Química, Universidade de Brasilia, Brasilia DF 70910-900, Brasil.
*To whom correspondence should be addressed. E-mail: [email protected]