POLITECNICO DI MILANO
School of Industrial and Information Engineering
MSc. in Management Engineering
“A Framework for Data Quality Risk Assessment and
Improvement of Business Processes in Information
Systems”
Counselor Professor:
Eng. Cinzia Cappiello
Masters Degree Tesina by:
Angie Paola Quintero Atara - 817618
Iván Ricardo Jiménez Lopera - 813363
Contents
1.1. The concept of Data Quality ... 3
1.2. Scope and objective of our work contribution ... 4
1.3. Structure and presentation of the current document ... 5
2.1. BPM Basics Concept ... 6
2.2. Data Quality in Business Processes ... 7
2.3. Data Quality Dimensions ... 8
2.4. Data Quality Breaches ... 9
2.5. The Cost of allowing poor Data Quality and its implications ... 11
2.6. Direct and Hidden Costs caused by low Data Quality ... 13
2.7. Data Quality English TIQM Costs ... 16
3.1. Failure Modes and Effect Analysis (FMEA) ... 18
3.2. FMEA development ... 19
3.3. FMEA Procedure ... 19
3.3.1. Identification of the product or process ... 19
3.3.2. Creating a Chart/Map/Diagram ... 20
3.3.3. FMEA Worksheet ... 20
3.3.4. Severity ... 21
3.3.5. Causes of Failure Mode ... 22
3.3.6. Occurrence ... 22
3.3.7. Detection ... 23
3.3.8. Risk Priority Numbers ... 24
4.1. Errors Classification, Data Quality Breaches and Failures ... 25
4.2. Definition of a Cost Based FMEA ... 28
4.2.1. Introduction of Cost Quality Factors ... 28
4.2.2. The Proposed System of Cost Evaluation ... 29
4.4. Mapping and translating the possible Variables ... 35
4.5. Severity Ranking Criteria ... 36
4.6. Occurrence Ranking Criteria ... 37
4.7. Detection Ranking Criteria ... 39
4.8. Implementation of Improvement Actions ... 40
4.9. Recalculation of RPN parameter after Improvement Actions ... 42
4.10. Guidelines to carry out a Data Quality Risk assessment using FMEA ... 42
5.1. Creating a Business Process Prototype Model ... 45
5.2. Definition of Improvement Actions ... 47
5.3. Allocation of improvement actions in the Business Process ... 48
5.4. Cost Based FMEA and Data Quality Analysis in a Business Process ... 49
1.
Nowadays, many companies worldwide are giving much more importance to the approaching of business processes (BPMN), as a way to model the reality in which they are working on a daily basis with the aim of identifying the primary (core) and secondary processes, the key performance indicators and opportunities for improvement among others. In this context, since Data is used in almost all business processes performed within a company and it is used as a basis for decision-making a sensible topic emerges: Data Quality.
In the era of Big Data, a company’s’ competitiveness will be relying more on its ability to offer customized products or services based on an increasingly fine segmentation of its customer database, and it is here where the Data Quality Risk Assessment plays an important role. The consequences of Poor Data Quality could be devastating for a company while on the other hand, an excellent Data Quality Management could set the pace of a successful growing corporate path.
1.1. The concept of Data Quality
In order to come up with a clear definition of the term Quality, first, it is important to look deep into the context in which it is applied. The term is frequently used in the manufacturing industry when trying to achieve objectives through the management of the production process. In fact, in the manufacturing industry there are some statistical techniques aimed to optimize the Quality of the products (statistical processes under control).
Even though for physical objects is more easily to understand the concept of Quality, this is not the situation for data. In the case of data, the concept of Quality is more related to intangible properties such as completeness and consistency. In the end, Data is the output of a production process and the way in which this process is performed, can have a significant influence in the Quality of Data.
When trying to understand the concept of Data Quality, some authors refer to this term dividing it into subcategories and dimensions. Ballou and Pazer (1995) for instance, divide Data Quality in four
dimensions: accuracy, timeliness, completeness and consistency. They argue that accuracy is an easier dimension to measure, by simply comparing actual values versus correct values. As for the timeliness, they also say that it can be measured in a similar way. Completeness assessment can be done by taking into account predefined data completeness level and as long as the focus is on whether the data is complete or not. The consistency is a little bit more complex to evaluate as different schemes are needed to make an effective comparison.
All in all, by looking into the literature the definition of Data Quality, the term comprises many dimensions, so that the Quality of Data can be defined as a multidimensional concept. The Quality Dimensions have the aim of capturing a system behavior from a particular point of view depending on the Quality Dimension selected.
1.2. Scope and objective of our work contribution
Within the scope of the present document, a model for the evaluation of risks associated with Data Quality in Business Processes is proposed taking as foundations a well-known methodology used in the quality systems of manufacturing companies mainly, but also applied in other areas of engineering as an useful engineering instrument tool, to recognize and detect failures (FMEA: Failure Mode and Effects Analysis). The proposed model will also include a risk assessment procedure formulating some guidelines to effectuate the analysis and integrate it to the methodology while at the same time also including different types of costs associated with the context of risk evaluation in Data Quality.
Starting with the definition of different parameters and variables to introduce in the model such as error types with the associated failures, data breaches and data quality dimensions affected, the methodology proposed would be on one hand a qualitative model, considering the qualification and ranking values of subjective factors such as severity criteria, occurrence and accordance detection mechanisms, while on the other hand, being also a quantitative model from the perspective of including a numerical algorithm with the values of the mentioned variables to provide the calculation of the RPN number as a measurement of data quality. Furthermore, the model will adapt the influence of preventive and detective controls analyzing their impact in terms of risk evaluation and improvements to Data Quality.
1.3. Structure and presentation of the current document
The general organization of the present work attempts to display a well-structured document starting with the definition of the main objectives, scope of the performed research and the development of the contribution work.
Beginning with the definition of the baseline topics that consolidate the theoretical background in chapter
N°2 and serve as an input to formulate the model criteria, the variables to be analyzed, the foundations of
Data Quality as part of Business Process Management, Data Quality dimensions, breaches, risk assessment and cost theory analyzing the implications of low data quality.
Then after in chapter N°3 the foundations of the (FMEA-Failure Mode and Effects Analysis) original methodology is presented, summarizing the concepts of the general procedure, application on specific processes, how to identify possible failure modes, the evaluation of the model criteria as: Severity, occurrence, detection and the importance of defining and calculating a Risk Priority Number based on the critical variables, the analysis on the numerical analysis and how it defines an overall evaluation of Quality.
In chapter N°4 a cost based FMEA methodology is presented to evaluate data quality in business processes, the model is considered to be our own work contribution adapting the original FMEA methodology with focus in manufacturing production processes and re-defining it into the context of Information Systems and the concept of Data Quality for business processes under this scope. The adaptation of the new model includes the mapping of the variables under analysis, the redefinition of the ranking criteria parameters: Severity, occurrence, detection and the improvement of the original model by including a cost analysis methodology to strategically evaluate the implications of poor Data Quality in Business processes, introduction of possible improvement actions and finally the definition of the general guidelines to carry out a Data Quality Risk assessment using the improved cost based model would be presented.
An exemplification of the model is presented in chapter N°5 showing an application of the methodology to evaluate the data quality in the context of a typical business process transaction, a simulation in excel will be presented to execute the analysis with the relevant variables, definitions and finally calculation of the data quality criteria with improvement actions. The excel simulation will serve as a based template and guidelines for implementing the model and creating future evaluations of Data Quality in generic Business Process. Finally conclusions and overall final recommendations would be described in chapter N°6.
2.
2.1. BPM Basics Concept
BPM stands for Business Process Management and the term is attached to all the current business excellence models used in the companies intended to simplify the processes in a way that the companies can make some improvements either internally or externally. Elzinga et. al (1995) argues that many companies are focused in finding a way in which their productivity, the product quality and operations can be improved and a new area that might sheds the lights on these improvements, is the business process management (BPM).
According to Zairi (1997), BPM must be governed by certain rules among which it is important to mention the following:
The principal activities have to be properly identified and documented. BPM creates horizontal linkages focusing on customers.
BPM must ensure discipline, consistency and repeatability of quality performance.
BPM relies on KPI-s to evaluate the performance of the processes, to set goals and deliver output levels intended to meet corporate objectives.
The continuous approach to optimization through problem solving must be considered as a base in which the BPM can rely on.
Trough continuous improvement and best practices the BPM must ensure a competitiveness enhancement.
One of the first big companies in applying the business process management was Hewlett-Packard and some authors defined this application as a “Plan, Do, Check, Act, (PDCA) Cycle” since the approach of the company consisted in defining some metrics for their processes, doing a tracking of those metrics including management reports and taking the corrective actions where needed. From the latter, BPM could be considered as a customer-focused approach to the systematic
management, measurement and improvement of all the company processes by means of a cross-functional teamwork and employment empowerment.
2.2. Data Quality in Business Processes
Without doubts, one of the most important things in enterprises nowadays, concerns the Quality of Data affecting directly their business processes. Enterprises that can manage in an efficient and effective way their business processes along with the Quality of Data are more successful in doing businesses as this allows for instance, to increase the revenues and have a more reliable Data for their customer database (enhancement of CRM and/ or ERP systems). This is one of the reasons for allocating more corporate annually investments in the budget of the enterprises pertaining to Data warehousing intended to improve the CRM or ERP systems within the companies.
In the era of Big Data, the information has become an important asset to increase the capital value of any firm by means of the Data Quality Management. An excellent Data Governance policy could bring important advantages in terms of business processes and hence for the companies:
Improvement in the Quality of products or services and the enhancement of the decision-making procedures.
General costs reductions.
Improving the ability to change the strategies of the company in fast-paced environments (increase of the competitiveness).
Improvement of the Business Intelligence tools.
Increase in the customer service level ( i.e. customer satisfaction)
Increase on the positioning of a company in the market (i.e. brand positioning).
The Data Quality Management within an enterprise is a very expensive task, but the prevention of errors could cost ten times less than one single error. The costs of Poor Quality Data for enterprises can account to a range from 10% to 25% either of the total revenues or from the total budget in an organization1. The consequences or losses in terms of money, due to Poor Data Quality are very complex to estimate as the Data have either impacts on tangible and intangible factors of business processes. Nevertheless, without at least an estimation of these costs due to Poor Data Quality the companies are unable to act or eager to take some actions towards the solution of the problems regarding the Data Quality.
1
Kovacic Andreja ; Business renovation: business rules (still) the missing link.,Business Process Management, pages 158–170, 2004.
Some studies have estimated that these costs due to Poor Data Quality, without any intervention from the companies amounts to approximately 20% of the revenues of the company2.
2.3. Data Quality Dimensions
When performing an assessment of Data Quality it is important to keep in mind the client who will be impacted for the data (i.e. data consumers who use the data). Data consumers have now more chances of selection and the kind of data they use. So in order to make an approach to a Data Quality problem within an organization it is necessary to have a broader view, beyond the stored data which will be part of an intrinsic view, to include instead data in production and utilization processes (Strong et al., 1997).
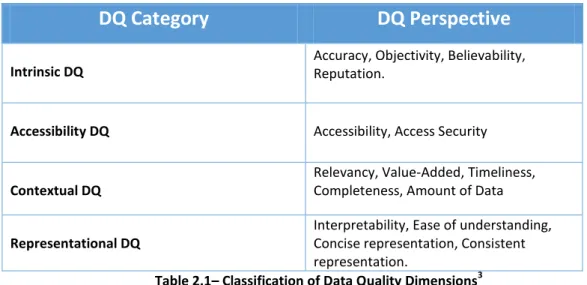
The Data Quality can be defined as a concept “fitness for use”, which means that the term Data Quality is subjective. In other words, Data Quality must be seen and evaluated from the perspective of the user in a way to find to which extent the data will serve the purpose of the user. According to this usefulness and usability of data (Strong et al., 1997) provides a classification of Data based on high Data Quality and four categories: intrinsic, accessibility, contextual and representational aspects as showed as follows:
DQ Category
DQ Perspective
Intrinsic DQ
Accuracy, Objectivity, Believability, Reputation.
Accessibility DQ Accessibility, Access Security
Contextual DQ
Relevancy, Value-Added, Timeliness, Completeness, Amount of Data
Representational DQ
Interpretability, Ease of understanding, Concise representation, Consistent representation.
Table 2.1– Classification of Data Quality Dimensions3
Wand and Wang (1996) provides another classification for Data Quality, having as a foundation an intrinsic view and therefore defining four intrinsic dimensions: completeness, unambiguousness, meaningfulness and correctness. The latter dimensions were argued by (Haug et. al 2009) who discussed the representational data quality dimension, because according to him, this dimension
2
Pierce Elizabeth M, Information Quality, AMIS, 2006 3
can be seen as an accessibility data quality and not a category on his own. Having said this, he proposed three dimensions: intrinsic, accessibility and usefulness.
Since there is no only one definition, but many for every Quality Dimension and there are ways types to measure them (indicators), for the purpose of this work, the Quality Dimensions proposed by (Strong et al., 1997) has been used when developing the Data Risk Assessment model, because these dimensions have the dynamic component which is very important when evaluating Data Quality Scenarios within the business processes.
2.4. Data Quality Breaches
The model proposed in chapter 4, takes into account 10 quality breaches described by Strong, Lee and Wang4, therefore it is important to describe briefly every Data Quality problem as these information Quality problems could have a major impact in one or more Data Quality Dimensions (as described above in table 2.1) at a time.
1) Multiples sources of the same information produce different values: this Quality breach affects the dimensions of consistency and believability. The problem here is simply since different sources of information can create confusion for Data consumers and thus Data might present inconsistency. The solution in this case is to establish common definitions and consistent definition by reviewing the information production process.
2) Information is produced using subjective judgments, leading to bias: the dimensions affected by this Information Quality problem are objectivity and believability. This information Quality problem is about including subjective values in the Data construction process and leaving therefore misleading information for data consumers. The solution to this problem consists on doing continuous improvements to the activities involving subjective evaluations.
3) Systemic errors in information production leads to lost information: dimensions affected by this problem are correctness, completeness and relevancy. Systemic errors are those repetitive errors that can affect the entire system and thus influencing the whole information production process. The typical solution consists in applying a statistical process control like the one performed for manufacturing processes. (e.g. acceptance sampling).
4
Diane M. Strong, Yang W. Lee, and Richard Y. Wang. 1997. 10 Potholes in the Road to Information Quality. Computer 30, 8 (August 1997), 38-46. DOI=http://dx.doi.org/10.1109/2.607057
4) Large volumes of stored information make it difficult to access information in a
reasonable time: when large volumes of Data are managed, the dimensions affected are
concise representation, timeliness, value-added, and accessibility. Big amount of information is difficult to manage as some information that must be retrieved might experiment significance delays. The proposed solution to this problem is to filter and analyzed the information in order to make regular backups of information regularly according to the needs.
5) Distributed heterogeneous systems lead to inconsistent definitions, formats and values:
this Information quality problem affects the dimensions of consistent representation, timeliness and value-added. This problem appears when the Data users are trying to get or consolidate the information from many sources, which can cause data inconsistencies and delays in retrieving the information. In this case, the solution is data warehouses that can help by pulling information from old systems or different sources, executing routines and solving inconsistencies at a time.
6) Nonnumeric information is difficult to index: the quality dimensions affected by this
problem are concise representation, value-added and accessibility. Representing nonnumeric information concisely and easy to access is the main problem described here. The solution to this problem is to evaluate the benefits of electronic storage when compare with the costs to input and storage the information, in order to determine the feasibility of doing it.
7) Automated content analysis across information collections is not yet available: this
problem affects analysis requirements, consistent representation, relevance and value-added quality dimensions. This quality data issue consists on having an easy access to the information from the various sources in a way that the Data user can manipulate the Data for constructing reports, analysis, trends, etc. The solution is the awareness of new analysis routines to compute trends across different databases that will come with electronic storage development.
8) As information consumers tasks and the organizational environmental change, the information that is relevant and useful changes: this Data Quality issue affects the
dimensions of relevance, value-added and completeness. This Quality breach is about the dynamic process of information as it changes since the Data consumers changes constantly, thus generating mismatches between the information provided by the systems and the
information required for the Data user. In this case, the solution is to anticipate the changes in the processes and information systems according to consumer needs.
9) Easy access to information may conflict with requirements for security, privacy and confidentiality: the dimensions affected in this Information Quality problem are security,
accessibility and value-added. This Data Quality Breach lies on the problem that some kind of information is important for some users (restricted information) but at the same time, the same information has some barriers that prevent them to see it (security barriers). The proposed solution in this case is to develop security settings for the information, as it is entered for the first time to the system.
10) Lack of sufficient computing resources limits access: dimensions affected by this Quality
Breach are accessibility and value-added. As the words “lack of” indicates, this problems regards the scarce computing resources available to access Data, making the transactions more difficult to be executed with the consequence of losing value for delays. The solution in this case is not to acquire more computers but developing upgrade policies in order to make the use of the equipment more efficient.
2.5. The Cost of allowing poor Data Quality and its implications
In today’s business environment in the Big Data era, information is the most valuable asset of companies; it is used in almost all the activities in the business context and it is considered the basis for decisions on operational and strategic levels, having high quality data is a relevant factor to a company's success.
Information Technology has leveraged in the recent years up to reaching a level where organizations have to gather and store huge amounts of data information. Nonetheless, as data volumes increase, so the complexity to manage information and to apply the appropriate techniques to store more complex information collected from different technological resources in the organization and this certainly increases the risk of having poor data quality.
Another data related issue usually mentioned, is that companies often manage data at a local level, for example at the level of different internal areas or locations of the organization and this implies the creation of 'information silos' in which data are redundantly stored, managed and processed.5
5
In this way, data silos imply that many companies face a multitude of inconsistencies in data definitions, data formats and data values, which makes it almost impossible to easily process, classify and interpret the data analytics to extract and use relevant data.
Organizations typically overestimate the quality of their data and underestimate the cost of errors, and it is therefore very important to analyze the impact of having poor data quality since this could bring significantly negative monetary impacts on the efficiency of an organization6. The implications of poor quality data carry negative effects to business users through reducing customer satisfaction, increased running costs, inefficient decision-making processes, lower performance and lowered employee job satisfaction7.
Poor data quality also increases operational costs since time and other resources are compromised during the execution of detecting and correcting errors tasks. Information is created and used in all daily operations, data is a critical input to almost all decisions and poor data quality also means that it becomes difficult to build trust in the company data, which may imply a lack of user acceptance of any initiatives based on such data8.
From a solution perspective, today leading IT companies offer Data warehousing solutions performing the business analytics and data integration of large volumes of structured data for complex warehouse environments, for example Hadoop Software9, is open source software to manage large data sets across multiple clusters and repositories, it can be scale from a single to multiple servers configuration. It also enables applications to work with large volumes of data stored and combined in different servers of massive clusters. Together with the new generation of software architectures and technologies as Big Data, today it is possible to manage the complexity of data integration and accessibility through Business Intelligence and Data Mining tools for the monitoring of strategic business process, performance management, KPI’s metrics and data analytics reporting functionalities by dashboards, scorecards to be delivered, customized and visualized according to the role of the person in the organization, management-executive level, IT department, business operations, finance or a customer view. In this way, the relevant information can easily be accessed, processed and interpreted to facilitate the decision making process based on the visualization of the relevant data.
6
Ballou et al., 2004; Wang & Strong, 1996 7 Kahn et al., 2003; Leo et al., 2002; Redman, 1998 8
Levitin & Redman, 1998; Ryu et al., 2006 9
2.6. Direct and Hidden Costs caused by low Data Quality
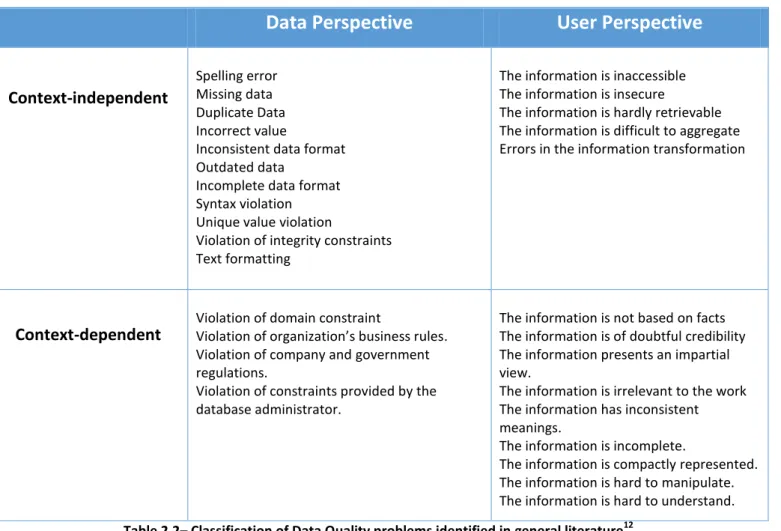
The costs of poor data quality are significant in many companies, only very few studies demonstrate how to identify, categorize and measure such costs10
. In practice, low quality data can bring monetary damages to an organization in a variety of ways. Some authors11 have offered different categorizations of costs in relation to information quality assessment and classify typical data quality problems from Data and the User perspective, as shown in the following table.
Data Perspective
User Perspective
Context-independent
Spelling error Missing data Duplicate Data Incorrect value
Inconsistent data format Outdated data
Incomplete data format Syntax violation Unique value violation
Violation of integrity constraints Text formatting
The information is inaccessible The information is insecure
The information is hardly retrievable The information is difficult to aggregate Errors in the information transformation
Context-dependent
Violation of domain constraint
Violation of organization’s business rules. Violation of company and government regulations.
Violation of constraints provided by the database administrator.
The information is not based on facts The information is of doubtful credibility The information presents an impartial view.
The information is irrelevant to the work The information has inconsistent meanings.
The information is incomplete.
The information is compactly represented. The information is hard to manipulate. The information is hard to understand.
Table 2.2– Classification of Data Quality problems identified in general literature12
On the issue of data quality management, the authors mention that this is an intersection between the fields of quality management, information management and knowledge management. Finally, on the issue of contextual data quality they provide an overview of which publications relate to different data application contexts, which include: database, information management systems, accounting, data warehouse, decision-making, enterprise resource planning, customer relationship management, finance, e-business systems among others.13
10
Eppler & Helfert, 2004; Kim & Choi, 2003
11
Ge and Helfert et al 2007
12
Ge and Helfert et al 2007
13
The authors14 review and categorize the potential costs associated with low quality data. They propose a classification framework and a cost progression analysis to support the development of quantifiable measures of data quality costs for researchers, they identify 23 examples of costs resulting from poor quality data, which amongst others are: higher maintenance costs, excess labor costs, assessment costs, data re-input costs, loss of revenue, costs of losing current customers, higher retrieval costs, higher data administration costs, process failure costs, information scrap and rework costs and costs due to increased time of delivery. Additionally, they identify 10 cost examples of assuring data quality, which are 1) information quality assessment or inspection costs, 2) information quality process improvement and defect prevention costs, 3) preventing low quality data, 4) detecting low quality data, 5) repairing low quality data, 6) costs of improving data format, 7) investment costs of improving data infrastructures, 8) investment costs of improving data processes, 9) training costs of improving data quality know-how and lastly 10) management and administrative costs associated with ensuring data quality. Finally, the authors state that data quality costs consist of two major types: improvement costs and costs due to low data quality. Based on this, they provided a simple classification of data quality costs, as shown in the following table.
Data Quality Costs
Costs caused by low Data Quality Direct Costs Verification costs Re-entry costs Compensation costs Indirect Costs
Costs based on lower reputation
Costs based on wrong decision or actions Stuck investment costs
Costs of improving or assuring Data Quality
Prevention Costs
Training costs Monitoring costs
Standard development and deployment costs
Detection Costs
Analysis costs Reporting costs
Repair Costs Repair planning costs
Repair implementation costs
Table 2.3– A Data Quality cost taxonomy15
14
Eppler and Helfert et al 2004
15
Furthermore, a classification of costs inflicted by poor quality data has been proposed and it is related to how visible the costs are for the organization. In the context of manufacturing processes, a categorization of the costs is proposed in Direct and Hidden costs. Direct costs can be defined as costs that are immediately present and visible to the C level of an organization, this could be for example be faulty delivery addresses for registered customers, resulting in wrong deliveries. Conversely, Hidden costs refer to the costs that the company is incurring but which the C level of an organization is not aware of, for example the expenses and costs of faulty decisions making from not knowing the profitability of products and its implications.
The following table displays the different errors involving Direct Costs in the context of a manufacturing process; it describes the associated possible errors in the process as Manufacturing Errors, wrong deliveries, payment errors and problems in delivery times. The table also provides the corresponding errors mapping with the Data Quality Dimension affected.
Cost Type
Error Types
Causes
DQ Dimension Affected
Direct Costs
Manufacturing errors
Inaccurate data of the order processing. Not sufficient data for Materials Requirements Planning (MRP). • Accuracy • Completness • Consistency • Believability Wrong deliveries
Mixed data and categorization of customers' information. Lack of updating data repositories with expired registers of previous customers in the system.
• Accuracy • Believability • Consistency
Payment errors
Inaccurate records of stored data prices in the system. Inconsistencies between prices information and inventory in the system. • Accuracy • Consistency • Value Added Problems in delivery times
Low data quality and inaccurate information as input for logistic and operational processes in the company.
• Accuracy • Consistency • Believability
• Concise Representation • Value-Added
Table 2.4 –Error Types involving Direct Costs in a Manufacturing Process context
The following table displays the different errors involving Hidden Costs in the context of a manufacturing process; it describes the associated possible errors in the process as long lead times, focus on wrong customer segments, poor production planning and poor price policies. The table also provides the corresponding errors mapping with the Data Quality Dimension affected.
Our contribution in the upcoming chapters would be the one to formulate a Data Quality assessment cost based model and adapt the cost theory from the manufacturing context into the
one of Data Quality in Information Systems as it would be seen in chapter 4 of the present document.
Cost Type
Error Types
Causes
DQ Dimension Affected
Hidden Costs
Long lead times Lack of data timeliness in a daily
operational basis.
• Accuracy • Consistency
• Concise Representation
Data being registered multiple times
Lack of implementation of procedures for data de-duplication and information checks validation. • Accuracy • Consistency • Interpretability Focus on wrong customer segments
Low data quality and inaccurate
processing of the information contained in Strategic Market segmentation surveys. • Accuracy • Believability • Interpretability Poor production planning
Wrong analysis in data tendencies and techniques fro predicting production planning. • Accuracy • Objectivity • Consistency • Concise Representation • Value-Added
Poor price policies
Inaccurate interpretation of current market price information and wrong data tendencies analysis.
• Accuracy • Consistency
• Concise Representation
Table 2.5 –Error Types involving Hidden Costs in a Manufacturing Process context
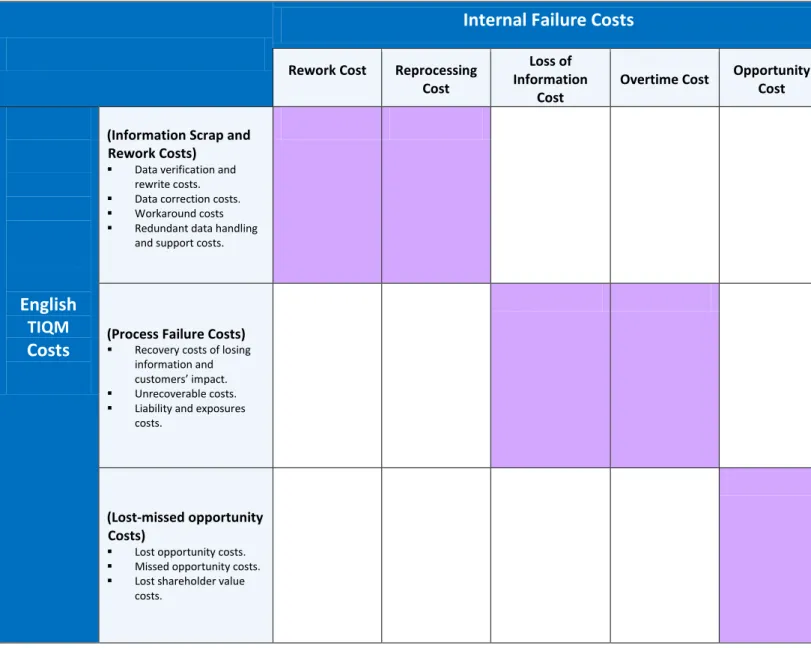
2.7. Data Quality English TIQM Costs
The TIQM (Total Information Quality Management)methodology [English 1999] has been designed to support data warehouse projects and it focuses on the management activities that are responsible for the integration of operational data sources. Another classification to evaluate the cost of poor data quality has been proposed by [English 1999] that categorizes the TIQM costs generally according to Process Costs; Such as the costs associated with the re-execution of the whole process due to data errors and Opportunity Costs; Due to lost and missed revenues.
In TIQM, data quality costs correspond to the costs of business processes and data management processes due to poor data quality. Costs for information quality assessment or inspection measure data quality dimensions to verify that processes are performing properly. Finally, process improvement and defect prevention costs involve activities to improve the quality of data, with the objective of eliminating, or reducing, the costs of poor data quality. Costs due to poor data quality are analyzed in depth in the TIQM approach, and are subdivided into three categories:
Process failure costs: Are incurred when poor quality data causes a process not to perform
properly. As an example, inaccurate mailing addresses cause correspondence to be wrongly delivered. It involves recovery costs of losing information and customers’ impact, unrecoverable costs, liability and exposures costs.
Information scrap and rework: When data is of poor quality, it involves several types of
defect management activities, such as Data verification and rewrite costs, data correction costs, workaround costs, redundant data handling and support costs.
Loss and missed opportunity costs: Correspond to the revenues and profits lost because of
poor data quality. For example, due to low accuracy of customer e-mail addresses, a percentage of customers already acquired cannot be reached by periodic advertising campaigns, resulting in lower revenues, roughly proportional to the decrease of the accuracy of addresses. It also involves recovery costs of losing information and customers’ impact, unrecoverable costs, liability and exposures costs.
In the upcoming chapter number 4, the English TIQM methodology costs would be also considered as a base to formulate a Data Quality assessment cost based model, integrating the whole theory costs reviewed in this chapter.
3.
The purpose of this chapter is to introduce the main theory of the FMEA methodology, since it is important to understand the underlying concepts that will be used in the risk assessment model. Some important definitions and concepts related to the original methodology which will be used as foundations for the model, in a general way, are also introduced in this chapter as well.
3.1. Failure Modes and Effect Analysis (FMEA)
The failure Modes and Effect Analysis (FMEA) is a methodology for analyzing potential reliability problems early in the development cycle, typically in manufacturing processes, where it is easier to take actions to overcome these issues, overall, enhancing the reliability trough design. FMEA is used to identify potential failure modes, determine their impact on the operation of the product, and identify actions to mitigate those impacts and therefore, the failures.
An important step on the development of this methodology is the anticipation of what might go wrong with the product. Like this process of anticipating every failure mode is an impossible task, the development team or responsible for the application of the methodology, should express as long as possible the failure mode list. The bigger the list, the better the chances for identification of possible failures.
The continuous and early use of FMEA methodology at the design time, allows predicting the possible failures, and producing more reliable, safe and quality products. Moreover, the methodology also allows capturing valuable information regarding further improvements to the product or service.16In other words,the proper use of the methodology can anticipate and prevent problems therefore, reducing costs, shortening the lead times of the products, and achieving highly reliable products and processes.
The NASA defines FMEA, as a forward logic (bottom-up) tabular methodology that explores the ways or modes in which each system element can fail and evaluates the consequences for each
16
Somnath Deb, Sudipto Ghoshal, Amit Mathur, Roshan Shrestha and Krishna R. Pattipati, Multisignal Modeling for Diagnosis, FMECA, and Reliability,IEEE,pp. 3-17.
failure. FMEA is also according to NASA, a useful tool for costs that facilitates the studies to implement effective risk mitigation and countermeasure.
The different approaches or definitions from this tool have something in common, because there is always and afterwards an examination of potential failures. After this, there is an evaluation of the identified failures17.
3.2. FMEA development
US Army first used the methodology in 1949 by the introduction of Military Procedures Document (MILP-P) 1629, Procedures for Performing a Failure Mode Effect and Critically Analysis, and afterwards NASA used it for the Apollo missions in 1960’s. NASA used this methodology having in mind the goal of mitigation of risks due to small sample sizes. In the late 1970’s, the methodology was introduced in the automotive industry with the aim to prevent liability costs (Ford Motor Company).
Nowadays, even though the FMEA initially was developed by the military, the use of this technique has been spread out all over different areas such the manufacturing industry, the design of products, the performance of services, quality assurance procedures, etc. Moreover, the tool is often required to comply with safety and quality requirements, such as Process Safety Management (PSM), Six Sigma, FDA Good Manufacturing Practices (GMPs), ISO 9001, etc.
3.3. FMEA Procedure
Even though there are several different approaches to perform a Failure Modes and Effect Analysis, one possible way is described as follows:
3.3.1. Identification of the product or process
Prior to the application of the methodology, it is important to perform certain preparatory steps. The starting point begins with the description of the product or process, because an overall view of the product or process is essential for the properly application of the methodology. This understanding make it easier for the people who is performing the assessment in the identification of those products or processes uses that fall into the methodology; in other words, this characterization phase will help to simplify those products or processes by considering either the intentional and unintentional uses.
17
3.3.2. Creating a Chart/Map/Diagram
The next step, is characterized by the describing the full picture of the process/product through the sketching of a diagram or map or a chart. The most frequently tool used is a business process diagram or a chart. This diagram shows major components or process steps as blocks connected together by lines indicating how the components or steps are integrated. This diagram can be very useful for showing the logical relationships of the components by establishing a structure around which the FMEA can be performed.
3.3.3. FMEA Worksheet
Once the diagram has been completed, the next step is to construct a framework, which is basically a worksheet listing the products or processes to evaluate under the methodology according to the diagram performed in the previous step (see the example of a header in table n.1). Afterwards, the Failure Modes must be identified. A failure mode can be defined as the way in which a component, subsystem, process, system, etc. could potentially fail. A failure mode in one process can serve as the cause of a failure mode in another process. Subsequently, for each failure is necessary to identify whether or not the failure is likely to occur (probability of occurrence).
Table 3.1 - Example of a header for product or process in FMEA methodology
Comparing or looking at similar processes or products and failures that have been previously documented, could be a good starting point. Then, it is needed to describe the effects of those failure modes, and the evaluator must determine what the ultimate effect will be for every failure mode. The failure effect can be defined as the consequences of a failure mode from the customer perspective related to the function of a product/process. Those effects must be described in a way of what the customer can see or experience.
Preventive Controls Detective Controls 8 Protecting IT Assets To block unauthorized requests Rules not appropriately configured IP Spoofing Diversion of sensitive data traffic, fraud 8 Procedures not followed 2 Procedures available 4 64 D e t R P N P o t e nt ia l T e c hnic a l E f f e c t ( s ) o f F a ilure P o t e nt ia l B us ine s s C o ns e que nc e ( s ) o f F a ilure S e v P o t e nt ia l C a us e ( s ) / M e c ha nis m ( s ) o f F a ilure P r o b C urre nt C o nt ro ls Sl.No. B us ine s s / S e rv ic e F unc t io n P o t e nt ia l F a ilure M o de ( s )
3.3.4. Severity
In the context of the FMEA methodology, the severity is defined as an assessment of the seriousness of the effect and it is linked directly to the potential failure mode, which is under the subject of study. For measuring the severity, there is a ranking that represents how difficult it will be for the subsequent operations to be completed regarding its specification in performance, cost and time.
There are several rankings, but a suggested criteria usually used in the industry nowadays is showed in table n. 2 A common industry standard also suggest a scale from 1 to 10 in which 1 represents no effect while 10 indicates very severe with failure affecting system operation and safety without warning. The aim of the ranking is helping the analyst to determine whether a failure would be a minor trouble or a catastrophic occurrence to the customer either internal or external. This ranking will also be the first critical step in the prioritization of the failures, thus addressing the real big issues first.
Effect
Severity of Effect
Ranking
Catastrophic Resource not available / Problem unknown 10 Extreme Resource not available / Problem unknown 9 Very High Resource not available / Problem known and can be
controlled 8
High Resource Available / Major violations of policies 7 Moderate Resource Available / Major violations of process 6 Low Resource Available / Major violations of procedures 5 Very Low Resource Available / Minor violations of policies 4 Minor Resource Available / Minor violations of process 3 Very Minor Resource Available / Minor violations of procedures 2
None No effect 1
3.3.5. Causes of Failure Mode
For each failure mode is necessary to identify the causes. These causes are defined as design weaknesses that may result in a failure. The causes should be listed in technical terms instead of symptoms. As an example in the case of a product, the improper operating conditions, too much solvent, excessive voltage or improper alignment can be potential causes.
3.3.6. Occurrence
Once the severity is finished, the occurrence is the next stage. This term is defined as the assessment of the probability that the specific cause of the Failure mode will occur. In other words, the occurrence is the likelihood of occurrence for each cause of failure.
A numerical weight should be assigned to each cause, which indicates how likely that cause is (probability of occurrence for each cause of failure). This is why frequently the failure history is helpful in increasing the truth of the probability.
A common industry standard uses a scale in which 1 represents the probability that the failure will not occur (unlikely event) and 10 to indicate an imminent probability of occurrence. Sometimes a CPk indicator is also associated to the scale of occurrence as showed in the table n. 3. This number comes from the Quality Systems to indicate the process capability.
Probability of Failure
Failure Prob.
Cpk
Ranking
Very High: Failure is almost inevitable >1 in 2
<0,33 10
1 in 3 0,33 9
High: Repeated failures
1 in 8 0,51 8
1 in 20 0,67 7
Moderate: Occasional failures
1 in 80 0,83 6
1 in 400 1,00 5
1 in 2,000 1,17 4
Low: Relatively few failures
1 in 15,000 1,33 3
1 in 150,000 1,50 2
Remote: Failure is unlikely <1 in 1,500,000 >1,67 1
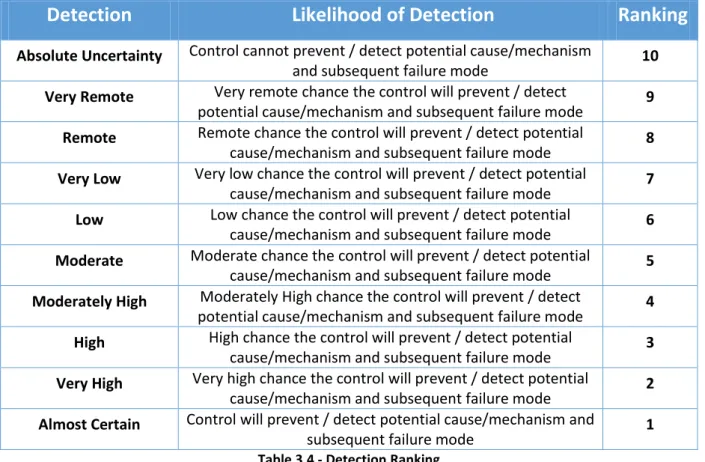
3.3.7. Detection
There are two types of detection. On one hand, there is the necessity to identify the current controls (design or process) which are mechanisms that prevent the cause of the failure mode from occurring or detect the failure before it reaches the final user (customer). The person in charge of applying the methodology should identify in this stage testing, analysis, monitoring and other techniques that can be used on the same or similar products/processes to detect failures.
Each of these controls should be evaluated to determine how well it is expected to identify or detect failure modes. After a new product or process has been in use previously undetected or unidentified failure modes may appear. The FMEA should then be updated and new plans have to be made to address those failures in order to eliminate them from the product/process.
On the other hand, the evaluator has to assess the probability that the proposed process controls will detect a potential cause of failure or a process weakness. Improving Product and/or Process design is the best strategy for reducing the Detection ranking - Improving means of Detection still requires improved designs with its subsequent improvement of the basic design. Higher rankings should question the method of the Control. The ranking and suggested criterion is as described in table n.4.
Detection
Likelihood of Detection
Ranking
Absolute Uncertainty Control cannot prevent / detect potential cause/mechanism
and subsequent failure mode 10
Very Remote Very remote chance the control will prevent / detect
potential cause/mechanism and subsequent failure mode 9
Remote Remote chance the control will prevent / detect potential
cause/mechanism and subsequent failure mode 8
Very Low Very low chance the control will prevent / detect potential
cause/mechanism and subsequent failure mode 7
Low Low chance the control will prevent / detect potential
cause/mechanism and subsequent failure mode 6
Moderate Moderate chance the control will prevent / detect potential
cause/mechanism and subsequent failure mode 5
Moderately High Moderately High chance the control will prevent / detect
potential cause/mechanism and subsequent failure mode 4
High High chance the control will prevent / detect potential
cause/mechanism and subsequent failure mode 3
Very High Very high chance the control will prevent / detect potential
cause/mechanism and subsequent failure mode 2
Almost Certain Control will prevent / detect potential cause/mechanism and
subsequent failure mode 1
3.3.8. Risk Priority Numbers
The Risk Priority Numbers is the mathematical result obtained by the product of three ratings: Severity, Occurrence and Detection.
RPN = (Severity) x (Probability) x (Detection)
The RPN is used to prioritize items that require additional quality planning or action. The final numbers coming out as RPN numbers, normally range from 1 to 5 or from 1 to 10 and the criteria used for each rating scale will depend on the particular circumstances for the product or process that is being analyzed. All the failures are rated according to the same set of rating scales and this number can be used to compare and rank failures within the analysis. Nonetheless, since ratings are assigned relative to a particular analysis, it is not commonly appropriate to compare RPN results among different analyses.
4.
As integration to the current research and the theory analyzed in previous chapters, this chapter attempts to present the final output and contribution to the current document with the formulation of a Cost Based FMEA Data Quality Model based on the fundamentals of the FMEA theory from the original context of evaluating quality in manufacturing processes to the context of Data Quality analysis in Information Business Processes.
4.1. Errors Classification, Data Quality Breaches and Failures
Applying the theoretical concepts of Data Quality breaches and Information Failures Categories, the next step is to define the possible Error Types along the whole transaction path of the business process, identifying the parts of the process where they might occur, an accurate description of the errors classification, their implications and overall how they system could be affected. For the analysis of this research, the error classification was used and readapted in the context of the business process in reference and in accordance with the description of data quality potholes and based literature18 that generally classifies the information errors in the following types:
Ambiguous Information: Interpreted in different incorrect ways.
Incorrect Information: Information is provided, but it is incorrect.
Misread, Misinterpret: Reading errors, errors in understanding consistency and correct
information.
Omitted Information: Information essential for the correct execution of a process or
operation is not available or has never been prepared.
Inadequate Warning: A warning is sent and readily available, but the method of warning is
not adequate to attract the operator’s attention.
18
Then after, each type of error would be categorize within the different ten different types of Data
Quality Breaches and according to this classification the procedure continues with the definition of
the associated consequences of an error known as Failures. It is important at this point to map the relationship between errors and the possible failures to provide a description in a certain degree of the impact at the organizational level, implication in the business process activities and overall vulnerabilities caused by a determined error type. A Failure may fall into one of the following categories:
Incomplete: The activity does not fully perform its function (e.g. when trying to discover an
important disease if one test is missed this could represent an incomplete failure)
Invalid: The correct service does not last for a right period of time (e.g. necessary resources
to performed an activity are not available enough time for example 1 hour so there is an invalid failure)
Inconsistent: The activity cannot perform consistently (e.g. in a hospital some activities are
performed consistently with machines involving cutting edge technology, however some activities requiring human factor involvement can present inconsistencies)
Timeliness: The activity is not enacted on time (e.g. in a hospital some activity can take
longer than expected so that the patient cannot receive the appropriate treatment on time) Inaccurate: The activity is not enacted for the right purpose (e.g. when performing a blood
test the outcome can be wrong because the sample can be contaminated and as a consequence the result might have deviations from the real values)
In the process of identifying and classifying the different Error Types, it was found that some of them were overlapping or classified within the same general category, while some others did not depend directly on data quality evaluation and therefore are not to be contemplated in the scope of this research. In this order of ideas we propose a classification in the following table mainly based in the context of general error classifications related to Data in Information systems, and particularly contextualized into Data quality evaluation of Business Processes transactions, with this on mind, the definition and classification present an analysis for errors such as: Data Entry
Processing and Inaccurate Information in the System referring to Erroneous Data arising from
errors on data entry and also considering that incorrect data processing can lead to incorrect information attributes; Misalignment with External sources if any connection with external applications that serve as data input to the business process activities; Inconsistencies in External
Sources referring mainly to inconsistent data with variations in the codification of information’s
values, misspelling, or wrong formatting; Missing confirmation/validation notifications to the user Missing Data resulting from incomplete collection of information, missing record or attributes; Data
Duplication issues of encoding information with the same value. The table presents the relevant
Error Types matching the corresponding Failures, definition and analysis accordingly.
ERROR TYPES - FAILURES
ERROR TYPE DQ BREACH FAILURES FAILURES CATEGORY
1
Data Entry Processing and Inaccurate Information in the System
The system does not process correctly the information inserted or selected by the user in the web interface causing a Halt/ Fault in the process.
This leads to wrong or inaccurate information presented by the GUI.
Automated content analysis across information collections is not yet available.
Distributed Heterogeneous Systems lead to inconsistent, formats and values.
Inaccuracies in the business process activity, low business metrics on Service Delivery objectives and customers’ dissatisfaction due to wrong data provided by the system. Loss of sales for the company due to
inaccurate data presented to the user. Constraints on reputation and
credibility.
Inaccuracy / Invalidity/ Inconsistency
2
Misalignment with External sources
The system can get stuck in a loop when linking and validating information of external web sources, like information provide from Banking/Online Payment portals.
Multiple sources of the same information produce different values.
Automated content analysis across information collections is not yet available.
Constraints on reputation and credibility.
Incomplete outputs in the Business Process activities.
Unexpected Halt/Ending of the Business Process.
Loss of Sales for incomplete information and unavailability of external sources in the user’s transaction.
Incompleteness/ Timeliness
3
Inconsistencies in External Sources
Having inconsistent information from third party sources, affect the overall user transaction and creates Security Breaches.
Access to information may conflict with requirements for security, privacy, and confidentiality.
Vulnerabilities with PCI Data Security Standards.
Loss of Sales for inconsistency with external sources in the user’s transaction.
Inconsistency
4
Missing confirmation/validation notifications to the user
The system generates errors that prevent the user from receiving important notifications of the transaction procedure.
Systemic errors in information production lead to lost information. Distributed Heterogeneous
Systems lead to inconsistent, formats and values.
Customers’ dissatisfaction due to wrong output in the Business Process missing data and incoherent service delivery.
Customers’ affected monetarily to correct incoherent outputs of the process.
Constraints on reputation and credibility.
Incompleteness
5
Data Duplication Error
The system accepts data duplicated from a same user when attempting to overwrite an already done transaction.
Large Volumes of stored information difficult to access.
Inconsistency on user's information processing.
Same activities of the Business Process with repeated outputs.
Inaccurate data presented to the user when overwriting duplicated information in the system.
Storage capacity misusage due to amounts of duplicated data.
Inconsistency
4.2. Definition of a Cost Based FMEA
In order to evaluate the risks associated with the Data Quality errors during the design of a business process and to determine which are the most important preventive/corrective actions to be taken, it is necessary to measure the Risk Priority Number (RPN) which is the result of multiplying the severity of each failure mode (error type) by its probability of occurrence and detection.
It would be also relevant to perform a cost analysis, selection and integration of the costs associated with Data Quality to create a cost based FMEA model and emphasize the implication of introducing these new variables to the adaptation of the original approach.
Generally the cost variables would be introduced as an adaptation of the costs theory analyze in previous chapters, while also using as a reference the research document of “A Cost-Based FMEA Decision Tool for Product Quality Design and Management”19. In the following sections the model would be developed to analyze and integrate the different types of costs and formulate a Cost analysis to integrate in the model.
4.2.1. Introduction of Cost Quality Factors
The original FMEA model is a quality/reliability methodology in the stage of product design in manufacturing processes, however under the scope of the current document the objective is to adapt the model in the design phase of business processes. Furthermore, it is important to emphasize the re design of the methodology by making an improvement of the original model introducing quality cost factors for the FMEA evaluation. In this context, the new cost based FMEA with the orientation of Data Quality analysis in Business Processes would be used to identify, prioritize, and try to reduce the occurrence of possible failures modes (error types) in the activities of a process before its output reaches the final user, the model could also be used as a prevention tool to reference areas of weakness to apply process re-engineering, to create preventive plans, to reduce the occurrence of failure modes in the execution of the process and to estimate the risk of specific causes with regard to the possible failure modes.
Another aim of the present document is to integrate the traditional FMEA criteria parameters with different quality cost factors with the purpose of evaluating the impact of having poor data quality in a business process, in this particular case and based on recent research papers on the subject of matter, “ the cost of poor quality, which will be used to determine the effects of quality failure and
19
Wang, Michael H. "A cost-based FMEA decision tool for product quality design and management." Intelligence and Security
evaluate the severity, is bounded only to internal failure costs”, therefore the approach of these type of costs would be consider to formulate the cost based FMEA. In the following sections it would be presented an analysis on how to integrate all the different types of failures and how do they fit into the category of Internal Failure Costs to finally submit a costs system into the model.
4.2.2. The Proposed System of Cost Evaluation
In general and according to Juran20 “the cost of quality is the sum of all the incurred costs by a
company in preventing poor quality”. For the purpose of integrating and re defining a cost based
FMEA model, this document improves the traditional scheme by making use of Feigenbaum statement with a slight adaptation considering cost of quality as the sum of all associated costs to analyze Data Quality, in this case incorporating solely the following three categories: Internal
Failure Costs, Prevention/Control Costs and Detection Costs.
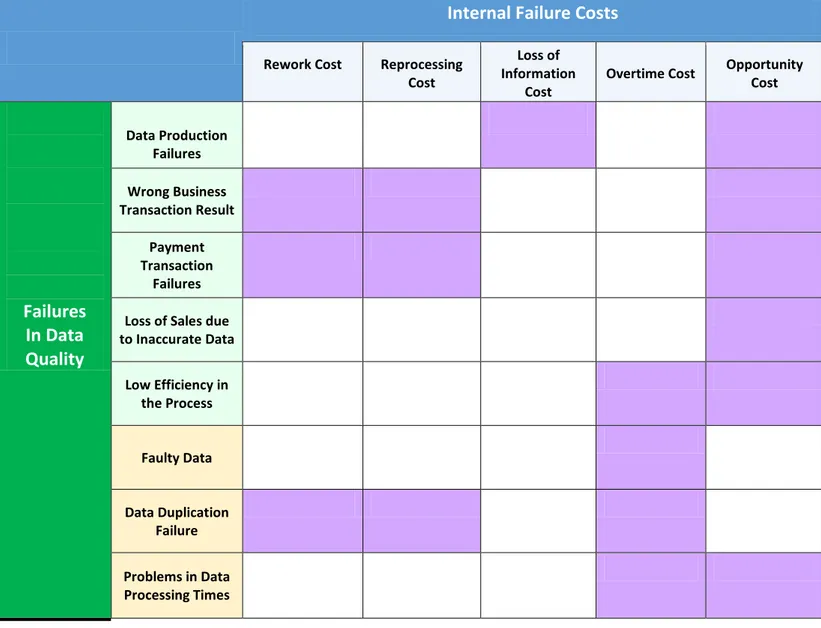
a. Internal Failure Cost: The cost associated with not meeting customer requirements in executing properly the business process activities. Includes all of the costs resulting from poor quality product or service, which is found before the process is delivered to the user, it will be used to identify the severity value and re-defined as:
Internal Failure Cost = Rework Cost + Reprocessing Cost + Lost of Information Cost + Overtime Cost +
Opportunity Cost
b. Prevention/Control Cost: Cost resulting from activities undertaken in verifying, checking and evaluating in order to prevent poor quality and to ensure that failures do not occur during the execution of the business process activities.
c. Detection Cost: Associated cost to the implementation of detective control techniques in terms of Data Quality as an improvement of the capability to detect a failure mode in the Business Process operation.
20
In order to clearly express this approach, all the different types of failures involved in Data Quality would be mapped one-to-one within the category of Internal Failure Costs and incorporated in the evaluation of the Severity Criteria parameter of FMEA as the incurred internal failure costs to apply prevention or optimization techniques to reduce severity. Additionally, the Prevention/Control
Cost is included in the evaluation of the Occurrence Criteria Parameter as the incurred costs to
place mechanisms and mitigate the likelihood that the potential failures will occur. Finally, the
Detection Cost is evaluated under the Detection Criteria as the resulting cost from implementing
procedures and carrying out activities to improve the probability of detecting a failure. The relationship of these costs and the FMEA ranking criteria is displayed in the following table.
FMEA Ranking Parameter
Associated Cost
Severity Criteria Internal Failure Cost Occurrence Criteria Prevention/Control Cost
Detection Criteria Detection Cost
Table 4.2 – Associated Costs with FMEA parameters
As a matter of fact, the proposed system suggests a subjective qualitative cost evaluation with the objective of performing an overall assessment of all the involved Costs in Data Quality, their classification, impact and how do they affect in one way or another the improvement of each ranking criteria parameter (severity, occurrence, detection) of the FMEA model to provide the calculation of the RPN number. The Cost Based FMEA will serve as guidance of interpretation and assessment by the final user to determine the cost implications of implementing improvement actions to increase data quality by improving the ranking value of each parameter to recalculate and obtain a better RPN Number, if the user decides to apply the improvement techniques into the system.
In this way, the user will evaluate a trade-off scenario comparing the balance of increasing data quality versus its costs implications and it would be up to the user decision’s to compare both variables depending on the importance and criticality of improving Data Quality and the monetary investments in carrying out the procedures and improvement techniques to accomplish the objective.
Within this scope, once the effects of each failure mode have been determined to evaluate its severity, the model will then integrate the evaluation of the cost of each effect and the associated