Chapter 5
Results and Discussion
5.1 3-D Scaffold CAD Design
In figure 1 the three superimposed scaffold layers are shown he PAM CAD structures realized in this work. The three layers represent in order shown in the figure the three geometries (exagons, squares and octagons) that better approximate the section of bone μct (micro-computed-tomography) represented in figure 2.
l―l 1.5 mm l―l 1.5 mm
a: First Layer (exagonal) b: Second Layer (squared)
l―l 1.5 mm
c: Third Layer (octagonal)
Figure 1: CAD design of three superimposed layers of the three-dimensional scaffold. a (first layer), b (second layer), c (third layer)
5.2 3-D Scaffold CAM Realization
The three different layers realized with PAM system are shown in figure 3, while complete 3-D PLLA scaffold and 3-D PLLA/MWCNT scaffold are shown in figure 4.
l―l 250 μm l―l 250 μm
a: First Layer (exagonal) b: Second Layer (squared)
l―l 250 μm
c: Third Layer (octagonal)
l―l 250 μm l―l 250 μm
a: 3-D PLLA scaffold b: 3-D PLLA/MWCNTs scaffold
Figure 4: Optical images of complete 3-D PLLA (a) and 3-D PLLA/MWCNTs (b) scaffold
5.3 Mechanical Characterization of the Scaffolds
Before starting PAM scaffold realization, a mechanical characterization of MWCNT/PLLA composite film was performed in order to optimize the composite polymer composition. The best MWCNT concentration in polymer solution was chosen at 1.25% (w/v) at which corresponds the highest Young’s Modulus of the 2-D PLLA/MWCNT films obtained by spin-coating as shown in figure 5 and figure 6.
Figure 6: Stress-Strain Tests performed on 2-D PLLA and 2-D PLLA/MWCNT films
Results shown in figure 6 are obtained by quasistatic tension tests on 2-D PLLA and 2-D PLLA/MWCNT flat films at different MWCNT concentration in the polymer solution.
The reason why Young’s Modulus decreases to high concentration of MWCNT in the polymeric solution is may due to the formation of lumps that affect the stiffness of the structures.
Then, quasistatic tension tests were performed on pure-polymeric (PLLA) three-dimensional scaffolds and on composite (PLLA/MWCNT) three-dimensional scaffolds with a UGO BASILE Biological Research Apparatus (www.ugobasile.com) (figure 7).
In these tests the transducer was calibrated before starting the experiments and the scaffolds were cut in stripes and positioned in the machine with a preload, then the sampling data recording frequency was fixed at 1. When the test started the first 30 seconds were weight-free and then every 3 minutes weights were added according to the sequence 1.0 from 0.2 gr to 100 gr. The total time for each sample was 75 minutes.
Figure 8 shows the stress-strain plots of the PLLA based scaffolds and of PLLA/MWCNT composite scaffolds. The Young’s Moduli are indicated in the top of the respective diagrams. It is evident that CNT/polymer composite scaffold presented a higher value of elastic modulus (resulting in an overall stiffer substrate).
0 2 4 6 8 10 12 14 16 18 0 0,05 0,1 0,15 0,2 str e ss (M Pa) strain (%) PLLA/MWCNT 1.25% (w/v) PLLA PLLA/MWCNT 7.50% (w/v) PLLA/MWCNT 2.50% (w/v)
Figure 7: UGO BASILE 7600 isotonic transducer
a: 3-D PLLA Scaffold
b: 3-D PLLA/MWCNT Scaffold
As shown in figure 8 Young’s Modulus recorded at 2% of strain of 3-D PLLA/MWCNT scaffold is almost two times higher than 3-D PLLA scaffold.
Figure 9 shows Young’s Moduli of the single layers of the 3-D PLLA/MWCNT scaffold in comparison to Young’s Modulus of complete scaffold.
Figure 9: Young’s Moduli of octagons, exagons and grid compared to entire 3-D microstructure
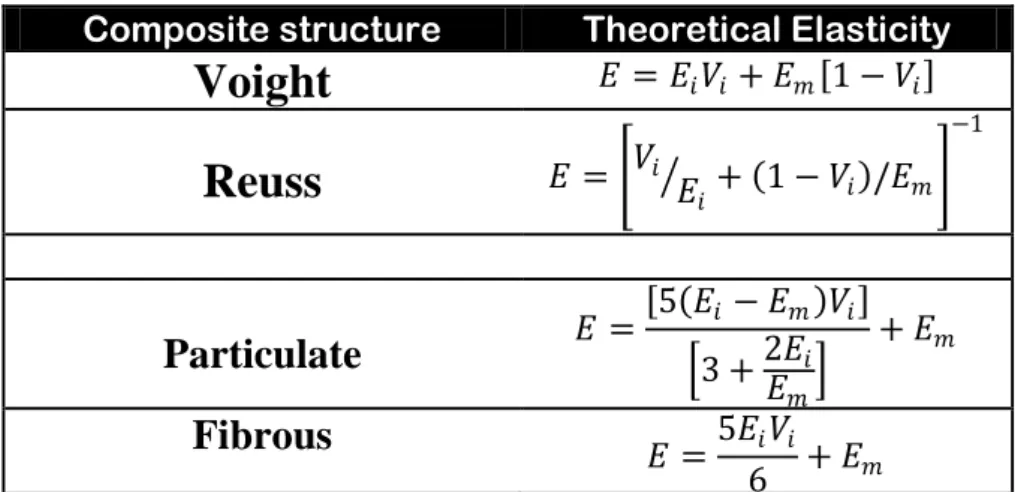
Using these results it was analyzed the theoretical mechanical model that better fits them. As shown in table 1 “𝑉𝑖“represents the volumetric fraction of inclusions while ”𝐸𝑚” and ”𝐸𝑖“ represent Young’s Moduli of matrices and inclusions respectively.
Composite structure Theoretical Elasticity
Voight
𝐸 = 𝐸𝑖𝑉𝑖 + 𝐸𝑚 1 − 𝑉𝑖Reuss
𝐸 = 𝑉𝑖 + 1 − 𝑉𝐸𝑖 𝑖 /𝐸𝑚 −1Particulate
𝐸 = 5 𝐸𝑖 − 𝐸𝑚 𝑉𝑖 3 +2𝐸𝑖 𝐸𝑚 + 𝐸𝑚Fibrous
𝐸 =5𝐸𝑖𝑉𝑖 6 + 𝐸𝑚Table 1: Theoretical Elasticity E in different mechanical models
0 1 2 3 4 5 6 7 8 9 10 E (M Pa)
Figure 10 shows the results of comparison between the experimental recorded Young’s Modulus and Young’s Modulus calculated according to the main theoretical models. It is deduced that is difficult compare the real mechanical behavior to a precise theoretical one, since the results show different mechanical properties for each concentration of MWCNT in the polymeric solution.
Figure 10: Young’s Modulus of different theoretical model in comparison to experimental results
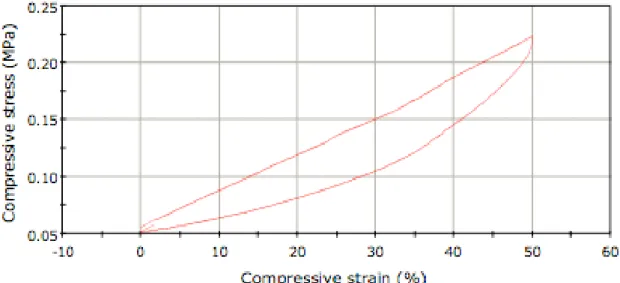
Then, cyclic-compression tests were performed on both PLLA and PLLA/MWCNT scaffolds with a BOSE system (www.boseelectroforce. com). These tests are very important at macroscopic level for bone tissue engineering because bones are subjected to cyclic-compressive loads much more than quasistatic axial and transversal loads. The samples were prepared in squares of 5 mm side and positioned under the pressing machine. The samples were compressed at 50% of their thickness at constant compression and maximum load limit of 200N. Figure 11 shows the stress-strain plots for the PLLA and PLLA/CNTs scaffolds respectively.
0 2 4 6 8 10 12 14 1,25% 2,50% 7,50% E (M Pa) MWCNT % PLLA Reuss R-Particulate R-Particulate&Fibrous
a: 3-D PLLA Scaffold cyclic compression
b: 3-D PLLA/MWCNT Scaffold cyclic compression
Figure 11: Comparison of the experimental results obtained with cyclic-compressive tests performed on 3-d PLLA vs 3-D PLLA/MWCNT Scaffolds
Cyclic-Compressive tests revealed similar viscoelastic behavior for both scaffolds, but at 50% of compressive strain the compressive stress recorded in 3-D PLLA/MWCNT scaffold is 8 MPa in comparison to just 0.2 MPa recorded in 3-D PLLA scaffold (almost 40 times higher).
Finally, Nano Indentation tests were performed on both PLLA and PLLA/MWCNT scaffolds surface using a flat punch with a diameter of 97 μm. Nano indentation tests give mechanical response
from microscopic point of view of scaffold surface stiffness, and this is the most important parameter related to cell adhesion to scaffold. Three different strain-rates have been used for these tests, more exactly 0.01 (1/s), 0.1 (1/s) and 1 (1/s). The results revealed the same viscoelastic behavior for both the scaffolds, and this is may due to the fact that the low percentage of MWCNT in the composite scaffolds doesn’t affect the viscoelasticity of the biopolymer. On the other hand, has been recorded 7 times higher Young’s Modulus of the composite PLLA/MWCNT scaffolds in comparison to that of pure PLLA scaffolds as shown in figure 12.
a: 3-D PLLA Scaffold nano-indentation
B: 3-D PLLA/MWCNT Scaffold nano-indentation
Figure 12: Young’s Modulus vs Strain Rate in Nano-Indentation Tests of 3-D PLLA (a) and 3-D PLLA/MWCNT Scaffolds
5.4 Cell Culture and Viability Results
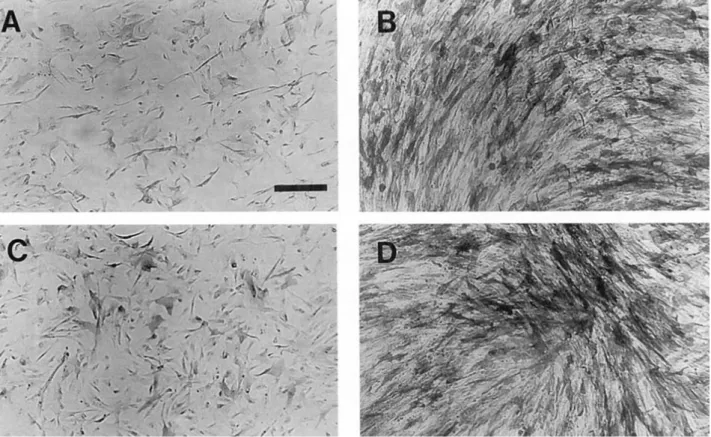
As mentioned in Chapter 4 the cell line used in experiments is hFOB 1.19 (human fetal osteoblasts). This cell line presents a temperature-switching gene that regulates proliferation and differentiation. In particular cells exhibited rapid proliferation when cultured at 33.5˚C, while no proliferation occurred at 37˚C at which cells expressed alkaline phosphatase activity and mature osteoblastic phenotype as shown in figure 13.
Figure 13: hfob 1.19 at subconfluent state (A and C) and at confluent state with Alkaline Phosphatase Activity (C and D)
When hFOB 1.19 cells reached the confluent state were seeded on 3-D Scaffolds, 2-D Flat films and on a Petri Dish at the density of 3x10⁴ cells per cm². Figure 14 shows cell density at 24h, 48h and 72h from cell seeding. As expected, cell density is more or less the same in all dishes containing the samples.
Figure 14: Cell density vs Time
The reason why cell density is more or less the same in all samples is related to temperature switching behavior of hFOB 1.19 cells because little or no cell division occurs when they are cultured at 37°C. For this reason a Cell-Viability Assay has been performed to see how many cells were viable in the samples. Then, CellTiter-Blue Viability Assay (www.promega.com) [1] was performed at 24 hours, 48 hours and 72 hours after incubation and revealed different behaviour of the hFOB 1.19 cells in response to different stiffness and different morphology of the substrates as shown in figure 15.
a: CellTiter-Blue Viability Assay at 24 h
0 5000 10000 15000 20000 25000 30000 35000 CE LL D EN SITY (c e lls/c m ²) 24h 48h 72h PLLA SC PLLA/MWCNT SC PLLA FILM PLLA/MWCNT FILM CONTROL 0 20 40 60 80 100 120 PLLA SC PLLA/MWCNT SC
PLLA FILM PLLA/MWCNT FILM CONTROL VIA B IL ITY %
b: CellTiter-Blue Viability Assay at 48 h
c: CellTiter-Blue Viability Assay at 72 h
Figure 15: CellTiter-Blu Viability Assay at 24 h (a), 48 h (b) and 72 h (c)
The interesting expected result is that cell viability after 72 hours is the highest on PLLA/MWCNT scaffold. The first response after 24 hours is dominated by the adhesive properties of the samples, and, since the pure PLLA surface is more homogeneous than composite one, the viability is higher on PLLA scaffolds and on PLLA flat film in comparison to the control.
0 20 40 60 80 100 120 PLLA SC PLLA/MWCNT SC
PLLA FILM PLLA/MWCNT FILM CONTROL VIA B IL ITY % 0 20 40 60 80 100 120 PLLA SC PLLA/MWCNT SC
PLLA FILM PLLA/MWCNT FILM CONTROL VIA B IL ITY %
But after 48 hours it has been recorded an increase in viability of both the samples containing MWCNT (scaffolds and flat films) and this is may due to the stiffness of the substrates that is the second stimulus that cells feel from a chronological point of view.
Finally, after 72 hours the highest viability is recorded only on the PLLA/MWCNT scaffolds and this means that the third stimulus for the cells is the morphology of the substrate in terms of three-dimensional patterns of the scaffolds. The stiffness is not enough, the cells need more stimuli (like morphology) and this is the reason why the viability on the composite flat films at 72 hours is lower than that recorded at 48 hours.
It is interesting to compare the viability in time as shown in figure 16 to determine cell stimuli from a chronological point of view (adhesion, stiffness and morphology).
Figure 16: Viability in Time
0 20 40 60 80 100 120 24h 48h 72h VIA B IL ITY % PLLA SC PLLA/MWCNT SC PLLA FILM PLLA/MWCNT FILM CONTROL
5.5 Optical Pictures of Cell-Seeded Scaffolds and Films
Figure 17 represent 3-D PLLA seeded-scaffold 24h after seeding. Hfob 1.19 cells have been fixed to scaffold and colored with “crystal violet”. Cell density is low in comparison to the scaffold area.Figure 17: 3D-PLLA Scaffold with hfob 1.19 4x
Figure 18 is a 10x magnification of a particular corner of 3-D PLLA seeded scaffold that shows how cells prefer the corners to attach to scaffold.
Figure 19 is a 4x magnification of 3-D PLLA/MWCNT seeded-scaffold 24h after seeding. In this case it is difficult to see cell morphology since scaffold’s color is black and the picture lacks contrast.
Figure 19: 3D-PLLA/MWCNT Scaffold with hfob 1.19 4x
Figure 20 is a 20x magnification of a particular corner of 3-D PLLA/MWCNT seeded-scaffold and reveals how cells prefer the scaffold corners. Even in this case it’s difficult to see cell morphology due to scaffold dark color.
Figure 21 is a 4x magnification of hfob 1.19 cells fixed and colored on 2-D PLLA flat film at 24h from cell seeding.
Figure 21: 2D-PLLA Film with hfob 1.19 4x
Figure 22 is a 4x magnification of hfob 1.19 seeded on 2-D PLLA/MWCNT flat film. It is interesting to see that dimension of MWCNT is bigger than cell dimension.
5.6 SEM Pictures of Cell-Seeded Scaffolds and Films
Figure 23 is a SEM picture of hfob 1.19 cells (white) seeded on 3-D PLLA scaffold. The picture shows that scaffold surface is flat without pores. It is difficult to create porous scaffolds with PAM microfabrication technique.
Figure 23: hfob 1.19 cells on a 3D-PLLA Scaffold
Figure 24 shows a hfob 1.19 cell (surrounded by MWCNTs) attached to 3-D PLLA/MWCNT scaffold.
Figure 25 represents two hfob 1.19 cells connected on a 2-D PLLA flat film obtained by spin-coating.
Figure 25: hfob 1.19 cells on a 2D-PLLA Film
Figure 26 shows 2 hfob 1.19 cells on 2-D PLLA/MWCNT flat film. It is interesting to notice that this film obtained by spin-coating is porous due to the fact that polymeric solution containing MWCNT is not omogeneous.
References