A
A
l
l
m
m
a
a
M
M
a
a
t
t
e
e
r
r
S
S
t
t
u
u
d
d
i
i
o
o
r
r
u
u
m
m
–
–
U
U
n
n
i
i
v
v
e
e
r
r
s
s
i
i
t
t
à
à
d
d
i
i
B
B
o
o
l
l
o
o
g
g
n
n
a
a
DOTTORATO DI RICERCA IN
Scienze della Terra
Ciclo XXV
Settore Concorsuale di afferenza: 04/A4 Settore Scientifico disciplinare: GEO/12
Study of the inter-annual variability of particle vertical fluxes in two
moorings in the Ross Sea (Antarctica)
Presentata da: Dott.ssa Francesca Chiarini
Coordinatore Dottorato
Relatore
Prof. Roberto Barbieri Dott.ssa Mariangela Ravaioli
Correlatori
Dott.ssa Lucilla Capotondi Dott. Leonardo Langone Dott. Federico Giglio
2
Abstract
The most ocean - atmosphere exchanges take place in polar environments due to the low temperatures which favor the absorption processes of atmospheric gases, in particular CO2. For this
reason, the alterations of biogeochemical cycles in these areas can have a strong impact on the global climate. The study of particle fluxes along the water column is therefore important to assess the transfer of the organic carbon and biogenic silica through the system. These waters have not the same efficiency in preserving organic particulate that they have for biogenic silica, so the different rate of the processes of silica dissolution and carbon oxidative degradation involves a decoupling of the biogenic silica and organic carbon cycles.
Over 20 years of Antarctic cruises (ROSSMIZE, BIOSESO 1 and 2, ROAVERRS and ABIOCLEAR projects) have led to a great archive of samples to be analyzed (cores, box-cores and sediment trap samples) in order to improve the existing biogeochemical models and to provide more accurate information on the Antarctic ecosystem changes related to global climate changes.
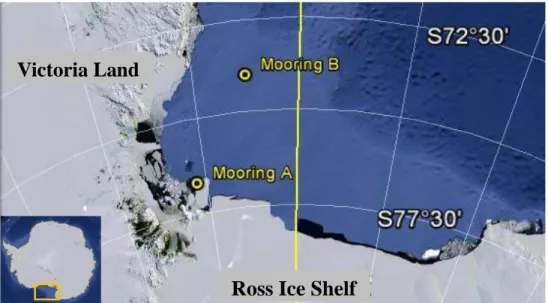
With the aim of contributing to the definition of the mechanisms that regulate the biogeochemical fluxes we have analyzed the particles collected in different years in two sites (mooring A and B) located in the Ross Sea in two areas with different characteristics. So it has been developed a more efficient method to prepare sediment trap samples for the analyses. This has permitted to determine the mass and biogenic fluxes and the composition of samples of a remarkable set of data. We have also processed satellite data of sea ice, chlorophyll a and diatoms concentration.
At both sites, in each year considered (1996, 1998, 1999, 2005 and 2008), there was a high seasonal and inter-annual variability of biogeochemical fluxes closely correlated with sea ice cover, which usually begins in late February and ends in mid-December. The highest values of mass and biogeochemical fluxes happened about two months after the algal bloom.
The comparison between the samples collected at mooring A and B in 2008 highlighted the main differences between these two sites. Particle fluxes at mooring A are higher than mooring B ones and they happen about a month before because mooring A is located in a polynia area with greater primary productivity and which is first sea ice free.
In the mooring B area, thanks to a consisting time series of data, it was possible to correlate the particles fluxes to the sea ice concentration anomalies and with the atmospheric changes in response to El Niño Southern Oscillations. In 1996 and 1999, years subjected to La Niña, the concentrations of sea ice in this area have been less than in 1998, year subjected to El Niño. Inverse correlation was found for 2005 and 2008.
In the mooring A area significant differences in the fluxes during two years (2005 and 2008) has been recorded. This allowed to underline the high variability of lateral advection processes and to connect them to physical forcing.
3
Riassunto
Gli ambienti polari rappresentano il principale luogo in cui avvengono i maggiori scambi tra atmosfera e oceano grazie alle basse temperature che favoriscono i processi di assorbimento dei gas atmosferici, in particolare di CO2. Per questo motivo le alterazioni dei cicli biogeochimici di queste
regioni, con la conseguente variazione di CO2 in atmosfera, possono avere un forte impatto sul
clima globale. Lo studio dei flussi di particelle lungo la colonna d’acqua è quindi importante per valutare il trasferimento del carbonio organico e della silice biogena attraverso il sistema. Non si riscontra per il particolato organico la stessa efficienza che queste acque hanno nel preservare la silice biogena, e questa differenza nei tassi dei processi chiave di dissoluzione per la silice e degradazione ossidativa per il carbonio implica un disaccoppiamento dei cicli della silice biogenica e della materia organica.
Oltre 20 anni di campagne in Antartide (progetti ROSSMIZE, BIOSESO 1 e 2, ROAVERRS e ABIOCLEAR) hanno portato ad avere un enorme archivio di campioni da analizzare (carote di sedimento, box-core e campioni di trappole di sedimento) per migliorare i modelli biogeochimici esistenti e fornire indicazioni sempre più precise sulle variazioni dell’ecosistema antartico marino in relazione ai cambiamenti climatici globali.
Ci si è proposti quindi di contribuire alla definizione dei meccanismi che regolano attualmente i flussi biogeochimici analizzando il particellato raccolto in vari anni in due siti fissi (mooring A e B) situati nel Mare di Ross in due aree dalle differenti caratteristiche. A tal fine è stato messo a punto un metodo di preparazione dei campioni di trappola più efficiente che ha consentito di determinare i flussi di massa e biogenici e la composizione dei campioni di un consistente set di dati. Inoltre sono stati elaborati i dati da satellite relativi alla concentrazione dei ghiacci, di clorofilla a e di diatomee. In ognuno degli anni esaminati (1996, 1998, 1999, 2005 e 2008), in entrambi i siti, si è osservata un’alta variabilità stagionale e interannuale dei flussi biogeochimici strettamente correlata con la copertura di ghiaccio, che di solito inizia a fine febbraio e termina a metà dicembre. I valori più alti di flussi di massa e biogeochimici sono stati registrati circa due mesi dopo i bloom algali.
Il confronto tra i campioni relativi al 2008 raccolti dai mooring A e B ha evidenziato le principali differenze tra i due siti. Il mooring A presenta flussi più alti e anticipati di circa un mese rispetto al
mooring B perché si trova in un’area di polynia a maggiore produttività primaria e che si libera
prima dai ghiacci stagionali.
Nella zona del mooring B, grazie ad una serie temporale consistente di dati, è stato possibile correlare i flussi di particelle alle fluttuazioni dei ghiacci e con le variazioni atmosferiche dovute a El Niño Southern Oscillation. Nel 1996 e 1999, anni soggetti a La Niña, le concentrazioni dei ghiacci in quest’area sono state minori mentre nel 1998, periodo soggetto a El Niño, maggiori. Correlazione inversa è stata riscontrata per il 2005 e il 2008.
Nell’area del mooring A le consistenti differenze registrate nei flussi relativi a due annate (2005 e 2008), hanno consentito di evidenziare l’alta variabilità dei fenomeni di avvezione laterale e di collegarli al forcing fisico.
4
Index
Chapter 1 General introduction ... 7
Foreword ... 7
1.1 Climate ... 9
1.1.1 Atmospheric circulation ... 9
1.2 Southern Ocean ... 11
1.2.1 Southern Ocean circulation... 11
1.2.2 Ross Sea circulation ... 12
1.2.3 Sea ice ... 14 1.3 Biogeochemical cycles ... 16 1.3.1 Primary productivity ... 16 1.3.2 Particle fluxes ... 18 1.3.3 Carbon cycle ... 18 1.3.4 Silica cycle ... 19 1.4 Moorings ... 20 1.4.1 Sediment traps ... 20 References ... 22
Chapter 2 A revised sediment trap split procedure ... 26
2.1 Abstract ... 26
2.2 Introduction ... 26
2.3 Review of procedures from the published literature ... 28
2.4 Discussion ... 31
2.5 Proposed method ... 34
2.6 Sample processing technique ... 38
2.7 Conclusions ... 40
References ... 42
Chapter 3 Seasonal variability of biogenic and mass fluxes in the Ross Sea (Antarctica): results from sediment traps collection ... 44
3.1 Abstract ... 44
3.2 Introduction ... 44
3.3 Productivity in the Ross Sea ... 46
3.4 Materials and methods ... 46
3.5 Results ... 48
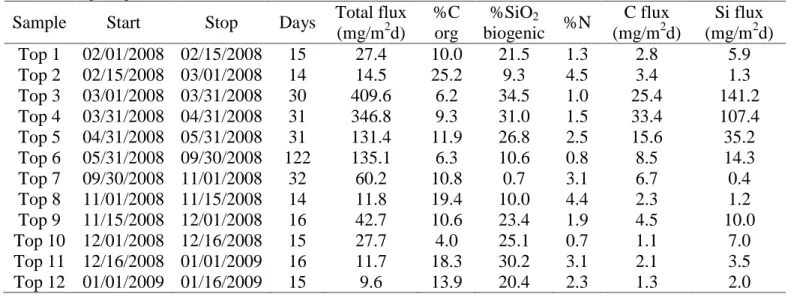
3.5.1 Particle fluxes ... 48
3.5.2 Sample composition ... 52
3.5.3 Physical parameters ... 53
3.5.4 Sea ice concentrations ... 55
5
3.7 Conclusions ... 62
References ... 64
Chapter 4 Time series data of biogenic fluxes in the Ross Sea (Antarctica): biogeochemical cycles and ENSO ... 66
4.1 Abstract ... 66
4.2 Introduction ... 66
4.3 Study area ... 67
4.4 Materials and methods ... 69
4.5 Results ... 71
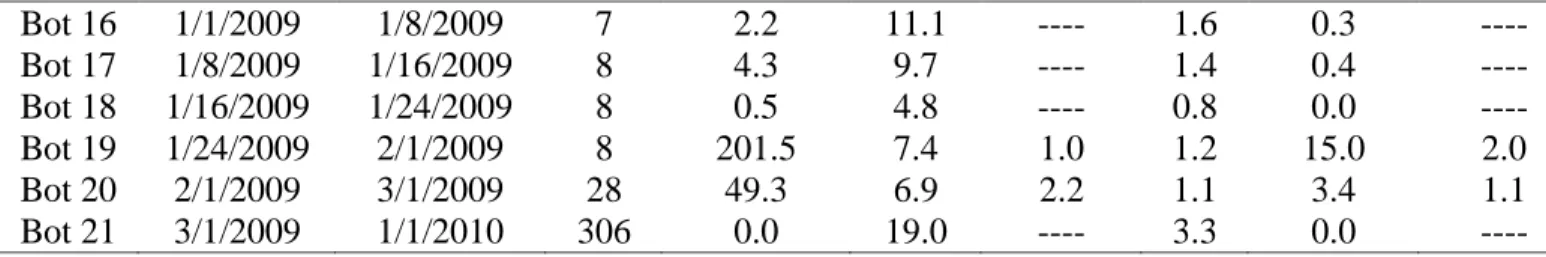
4.5.1 Particle fluxes ... 71
4.5.2 Particle composition ... 75
4.5.3 Swimmers ... 76
4.5.4 Sea ice cover ... 77
4.5.5 Chlorophyll a and diatoms ... 78
4.6 Discussion ... 79
4.6.1 Seasonal variability ... 79
4.6.2 Inter-annual variability ... 80
4.6.3 Sensitivity of Ross Sea to ENSO variability... 83
4.6.4 Phytoplankton bloom inter-annual variability... 84
4.7 Conclusions ... 86
References ... 87
Chapter 5 Sediment trap particle fluxes during two years (2005 and 2008) in the Ross Sea polynia (site A) ... 89
5.1 Abstract ... 89
5.2 Introduction ... 89
5.3 Study area ... 90
5.4 Materials and methods ... 91
5.5 Results ... 92 5.5.1 Samples composition ... 92 5.5.2 Swimmers ... 96 5.5.3 Physical parameters ... 96 5.5.4 Sea ice ... 98 5.5.5 Chlorophyll a ... 99 5.6 Discussion ... 100
5.6.1 Physical parameters and biological distribution ... 100
5.6.2 Mass balance ... 108
5.7 Conclusions ... 110
6
General conclusions ... 115
Appendix ... 117
Analytical procedure for biogenic silica analysis ... 117
Organic Carbon analysis ... 118
Sample composition ... 119
Sea ice concentration (%) ... 126
Chlorophyll a concentrations (mg/m3) ... 135
7
Chapter 1
General introduction
ForewordThe Antarctic region plays a key role in the global climate evolution. In the Southern Ocean it occurs the most important CO2 sea-atmosphere exchange with strong carbon absorption due to
biogeochemical cycles. Furthermore the differences in temperature and salinity of tropical, subtropical and antarctic waters, encountering in the Polar Front Zone, induce a high turnover of water masses and encourage exchanges between ocean and atmosphere.
In addition, in Antarctic waters it takes place 1/3 of world production of biogenic silica (Treguer and Van Bennekom, 1991). According to DeMaster (1981) about 50% of global silica due to rivers and hydrothermal emanations is deposited in the depths of the Southern Ocean.
Studies in these areas, however, are made particularly difficult by the extreme environmental conditions so it has not yet been possible to determine the role that the Southern Ocean plays in the global cycle of silica and carbon. For this reason, careful studies about primary productivity and export fluxes rates are needed.
The Ross Sea is the most productive area of Antarctica with the largest algal blooms of all the Southern Ocean (Comiso et al., 1993; Sullivan et al., 1993). It is characterized by a marked seasonal and regional variability of the primary productivity in the surface euphotic layer and in the resulting export processes along the water column. This variability is in turn linked to the processes of formation and melting of seasonal sea ice and to oceanographic processes (such as the circulation and the formation of water masses).
Mass fluxes regional variability depends both on differences in the productivity of the specific areas and on differences in currents which affect the particle sinking along the water column with lateral advection processes or particles removal. In some areas, this is considered a limiting factor for the use of sediment traps since the evaluation of vertical fluxes is much more complex (Honjo and Doherty, 1988).
The south-western area of the Ross Sea is characterized by weak currents that can carry particles of larger size not more than 20 km away. This implies that there is a good correspondence between the material produced in the area and what settles on the bottom (Jaeger et al., 1996). The north-western region is instead characterized by stronger currents that induce lateral transport even for many tens of kilometers in other environmental setting (e.g. off the shelf). The south-central part, on the other hand, shows intermediate characteristics between the previous ones (Frignani et al., 2000).
The aim of this type of studies is to understand the link between production and preservation in surface sediments in order to detect the consequences of the anthropogenic influence on carbon cycle. In fact, although the Southern Ocean is considered crucial to the global ocean processes, its role has not yet been quantitatively defined by the complexity of high seasonal variability and the cycle of sea ice formation and melting. Furthermore climate changes especially affect this area
8
since the ecosystem here is sensitive even to extremely small variations (e.g. a few degrees of temperature).
In this study we analyze samples from two moorings (A and B) positioned in the Ross Sea during the years 1996, 1998, 1999, 2005 and 2008 (mooring B) and 2005 and 2008 (mooring A).
The analysis of the particles collected and the study of vertical fluxes of biogenic silica, organic carbon and nitrogen allow to better determine the transport and accumulation rates of particulate matter falling to the bottom from the euphotic zone, their seasonal and inter-annual variability and their relationships with the forcing due to atmospheric phenomena such as El Niño Southern Oscillation (ENSO).
We have then processed data about sea ice extension and concentration and chlorophyll a and diatoms concentration averaged on two areas surrounding the sites, to correlate mass and biogenic fluxes to atmospheric and sea-ice conditions.
Chapter 1 introduces the main features of the investigated area and the kind of the study. In Chapter 2 a new method for sample treatment is proposed after a critical description of analytical methods used in literature for the determination of mass and biogenic fluxes. In Chapter 3 it is reported a comparison between particle fluxes collected during 2008 in two sites located in different Ross Sea areas with the aim of highlighting their differences. Mooring A is located in a polynia area bordering the ice shelf in one of the areas with higher primary productivity of the Ross Sea, mooring B, instead, is positioned in the Joides basin, an area characterized by a high accumulation of bio-silica sediments and by the presence of significant processesof lateral advection. In Chapter 4 mass and biogenic fluxes data obtained at site B during different years (1996, 1998, 1999, 2005 and 2008) are reported. The determination of a time series of data covering a period of ten years, allows a more detailed study on the inter-annual variability of biogeochemical fluxes typical of the Ross Sea. The relationships between particle fluxes and physical forcing is then investigated together with their link to the cyclic atmospheric response to ENSO variability. In Chapter 5 the mooring A trap samples data related to 2005 and 2008 are reported and compared with the 1994 ones (Langone et al., 2003). This data underline the well known seasonal and inter-annual variability showing differences in fluxes magnitude and particulate composition. Finally in Chapter 6 the results obtained with our research are summarized.
9 1.1 Climate
1.1.1 Atmospheric circulation
Antarctica is usually surrounded by a zone of low pressure, the Circumpolar Trough, the continent is instead dominated by a high pressure zone (Pidwirny, 2006).
The principal atmospheric cells involved in Antarctic climate are the Subpolar Low-Pressure Cells at 60°S latitude, where the cold air masses (from higher latitude) and the warmer ones (from lower latitude) converge and the Polar High-Pressure Cells, located at 90°S, with air masses very cold and dry. Along the Subpolar Low-Pressure cells frequent storms develop causing high winds and snowfall. The Polar High-Pressure Cells are responsible of winds moving away from the Pole and forming the polar easterlies.
Between 30° to 60°S latitude, the upper air winds, flowing generally towards the pole, are deflected by the Coriolis force that causes their blowing from west to east at 60°S (Polar Jet Stream). (Pidwirny, 2006).
High vertical and horizontal temperature gradients between the continent and the nearby areas make Antarctic temperature trend particularly sensitive to changes in the low level atmospheric circulation (van den Broeke, 2000).
Some pressure systems are permanent around Antarctica and their position and strength are important for the sea ice growth and melting. One of these is the Amundsen Sea Low (LAS), a
permanent low pressure zone ahead the Amundsen Sea and the Ross Sea; this low is sensible to El Niño Southern Oscillation (ENSO) so producing difference in temperature, wind strength and direction over the Ross Sea (Bertler et al., 2004).
Changes in extra tropical atmospheric circulation due to ENSO forcing allow the ENSO signal transport to high latitude; some authors have attributed this connection to the stationary Rossby Wave (Karoly, 1989; Mo & Higgins, 1998; Kiladis & Mo, 1998; Garreaud & Battisti, 1999). The Rossby Wave train is one of the main circulation pattern of the Pacific and South America (PSA) pattern (Kidson, 1999).
Figure 1: Split jet (Polar Front Jet and Subtropical Jet) (from Bertler et al., 2006)
Another important climate feature in the South Pacific is the presence during winter of a split jet stream (Fig. 1). The jet stream flows near Australia and New Zealand and it splits into the
10
Subtropical Jet (STJ) at about 30°S and the Polar Front Jet (PFJ) at 60°S (Chen et al., 1996; Turner, 2004). ENSO cycles produce changes in the STJ and PFJ strength (Chen et al., 1996, Bals-Elsholz et al., 2001); during La Niña periods, for example, the STJ is weakened with respect to the PFJ (Chen et al., 1996; Carleton, 2003) and this makes a deeper LAS which enhances katabatic winds
from the continent (Bromwich et al., 1993; Chen et al., 1996; Turner, 2004).
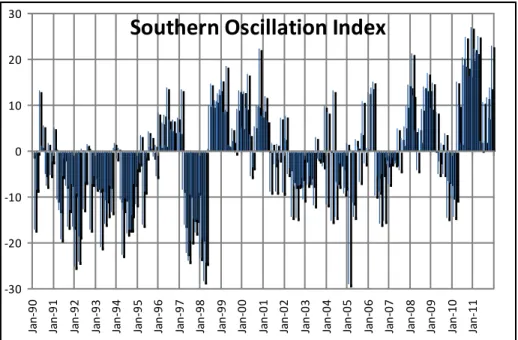
Southern Oscillation Index
-30 -20 -10 0 10 20 30 Ja n -9 0 Ja n -9 1 Ja n -9 2 Ja n -9 3 Ja n -9 4 Ja n -9 5 Ja n -9 6 Ja n -9 7 Ja n -9 8 Ja n -9 9 Ja n -0 0 Ja n -0 1 Ja n -0 2 Ja n -0 3 Ja n -0 4 Ja n -0 5 Ja n -0 6 Ja n -0 7 Ja n -0 8 Ja n -0 9 Ja n -1 0 Ja n -1 1
Figure 2: Southern Oscillation Index annual trend from January 1990 to January 2012 (data
from Bureau of Meteorology - Australian government)
In addition many other patterns have been connected to Antarctic tropospheric circulation on inter-annual or decadal scale such as Antarctic Oscillation (AAO) and Antarctic Circumpolar Wave (ACW) but the correlations between them are not well known. Strong correlations between ENSO cycles and the Ross Sea climate have been found (Kwok and Comiso, 2002; Carleton, 2003; Turner, 2004; Stammerjohn et al., 2008).
An index commonly used for ENSO is the Southern Oscillation Index (SOI), which is the normalization of differences in surface pressure between Tahiti and Darwin. Positive extremes represent La Niña periods and negative El Niño (Parker, 1983) (Fig. 2).
Figure 3: position of the Amundsen Sea Low (LAS) during La Niña
and El Niño periods. Red arrows: warm air masses; blue arrows: cold air masses. (From Bertler et al., 2004)
11
The influence of ENSO on the Antarctic atmospheric circulation around the Ross Sea is mainly linked to the strength and position of the LAS (Carleton, 2003; Bertler et al., 2004; Turner, 2004).
During El Niño events the LAS is weakened and its position changes, reaching even 1400 km
eastward, with respect to La Niña periods (Chen et al., 1996; Cullather et al., 1996) (Fig. 3).
1.2 Southern Ocean
The Southern Ocean is an extremely large area that constitutes about 20% of the total ocean surface. The Southern Ocean can be divided, based on the hydrographic characteristics and distribution of nutrients, in the Subtropical Convergence, the Antarctic Polar Front Zone, the Antarctic Divergence and the Marginal Ice Zone.
The Subtropical Convergence (STC), located at about 43°S latitude, is the area where warmer subtropical waters meet colder waters from higher latitudes. It shows a relatively high biomass concentration and it seems to be important for atmospheric CO2 uptake, as the entire subantarctic
region (JGOFS, 1992).
The Antarctic Polar Front Zone (APFZ) or Antarctic Convergence (AAC), is the wide area between the Subantartic Front (49°S) and the Antarctic Polar Front (63°S). This area is affected by complex dynamics due to a series of current convergences. It exhibits strong gradients in temperature and dissolved silica concentration and less marked gradients in phosphates and nitrates concentrations. The Antarctic Divergence (AD) at about 65°S is the zone between the Circumpolar Current and the East Wind Drift (or Polar Current).
Finally the Marginal Ice Zone (MIZ) is the transition area between the compact ice pack and the ice free sea. This zone migrates seasonally for hundreds of kilometres and it is also subjected to inter-annual variability. The MIZ affects deep ocean areas and continental shelves, including the epicontinental margins of Ross and Weddell Seas (JGOFS, 1992).
1.2.1 Southern Ocean circulation
Many currents affect the Antarctic Ocean due to the strong salinity and temperature differences between the tropical, sub tropical and antarctic ocean waters.
The presence of different water masses favours atmosphere-ocean gas exchanges and the subsequent oxygenation of deep waters.
These mixing processes mainly occur in the Antarctic Convergence (AAC) zone where the longest earth's current, flowing from west to east, develops. This current, called Antarctic Circumpolar Current (AACC), extends for about ten degrees latitude (Manzoni, 1989).
Near the Antarctic continent the Polar Current (PC) flows from East to West; its flux is influenced by the Antarctic continental winds. These two currents circulating around the continent in opposite directions are separated by the Antarctic Divergence (AAD) in which the rising of the Atlantic waters occurs (upwelling).
The Polar Front (PF) is characterized by three main water masses: the Antarctic Surface Water (AASW), the Circumpolar Deep Water (CDW) and the Antarctic Bottom Water (AABW).
12
The AASW is composed by surface waters forming in summer by the mixing of shelf waters and sea ice melting waters (Jacobs et al., 1985). Its temperature does not exceed 0°C and its depth reaches to the north 50-100 m.
The CDW flows below the AASW and it originates from the convergence between the North Atlantic deep current and the cold water coming from the Ross and the Weddell seas. It has a temperature higher than the AASW (1°C) and high salinity. It also represents the main source of nutrients for the coastal Antarctic waters and the main source of heat for the Ross Sea where it influences the cycle of ice formation and melting (Anderson et al., 1984).
The AABW is the water mass that flows close to the bottom of the Antarctic Ocean. It moves northward and it is formed generally by mixing of intermediate sea water with dense waters originating from the continental shelf. It consists of very dense waters and it has a temperature of about -0.4°C.
1.2.2 Ross Sea circulation
In this study we focus on the Ross Sea area. The Ross Sea is an epicontinental sea bounded to the West by the Victoria Land, to the East by the Marie Bird Land and to the South by the Ross Ice Shelf and it extends for 3.5 x 10⁶ km2.
It is characterized by a deep and steep continental shelf, a factor that significantly affects the sedimentation. One of its main peculiarities is to be counterslope, i.e. its depth increases from offshore to the coast (Frignani et al., 2003).
According to Vanney et al. (1981) the main causes of the shelf morphology are due to tectonics, whose action has been increased by volcanism and glacial erosion.
The Ross Sea morphology is also characterized by several large and deep basins which have an average depth of 500 m. This morphology is probably originated by ice tongues coming from the western ice sheet.
At the east end there is the Sulzberger Basin, deepest near the coast where it reaches 900 m depth, the central part is constituted by basins and banks with 500 m average depth and NNE direction. The west end is much steeper and formed by a succession of glaciers and volcanic islands (McMurdo Volcanic Complex), whose depth is generally greater. To the west of Cape Adare the average depth becomes 200 m and this is one of the shallower areas of the Antarctic shelf, probably because of an uplift occurred in the Quaternary.
The Ross Sea circulation is very complex and the currents distribution may have a seasonal, annual or pluriannual variability because of the close correlations between water masses, sea ice formation, sea ice melting and polynia areas. As a result of these interactions a number of water masses are formed with different temperature and salinity, they interact with each other producing layered water column. These movements significantly influence the sedimentation processes.
Furthermore the Ross Sea bottom topography has a relevant role in water masses circulation. It is in fact formed by basins and banks in which deeper areas, adjacent to the continent, saltier and denser waters converge.
From east to west the Ross Sea water column shows a general increase in salinity due to brine formation and a cyclonic circulation in the western portion of the shelf (Klepikov and Grigor’yev,
13
1966). According to the model of Klepikov and Grigor’yev the surface water, flow out of the Ross Sea, would be confined to a narrow strip along the coast of Victoria Land and the inflow would occupy the eastern part of the shelf (Anderson et al., 1984).
The principal water masses in the continental shelf of the Ross Sea are (Jacobs and Giulivi, 1998):
Modified Circumpolar Deep Water (MCDW); High Salinity Shelf Water (HSSW);
Low Salinity Shelf Water (LSSW); Ice Shelf Water (ISW).
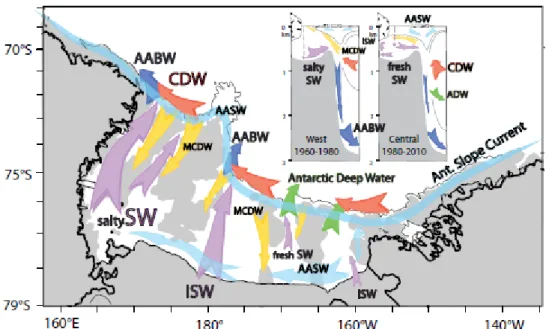
The MCDW (Fig. 4) is characterized by relatively high temperatures (between +1.0°C and -1.5°C) and has its origin from the CDW which go up along the Ross Sea continental slope and blends with the cold shelf waters. This current flows between 167°W and 177°W and to the west of 178°W. The MCDW is the main source of nutrients for the coastal waters, it allows the melting of sea ice regulating the Ross Sea circulation (Anderson et al., 1984).
The HSSW, that probably forms during winter in the Terranova Bay polynia, flows in the southwestern Ross Sea, it has a salinity of 34.8‰ and a temperature close to the freezing point (about -2°C). This is the main current of this sector during summer.
The LSSW flows in the eastern Ross Sea, where ice cover is permanent. These waters are formed by the melting process that occurs at the beginning of the austral summer and that releases waters at lower salinity. The LSSW, in fact, has a salinity of 34.5‰ and a temperature of about -1.5°C. So when the LSSW meets the HSSW the first flows above the other because of its lower density. The ISW (Fig. 4) is formed by waters having temperatures below the freezing point of the sea surface (-2°C). In fact, these waters are cooled by the interaction with the ice shelf base and they flow between 177° and 179°W at a depth of 500 m with a NNE direction starting from the ice shelf. Near the continental slope some of these waters form the AABW.
Figure 4: Ross Sea circulation during the last 50 years. Antarctic Surface Water (AASW):
light blue. Shelf Water (SW): purple. Modified Circumpolar Deep Water (MCDW): orange. Circumpolar Deep Water (CDW): red. New Antarctic Deep Water: green. New Antarctic
14 1.2.3 Sea ice
The sea ice begins to form around the coast from February to March, it reaches its maximum extent (26 million km2) on September, at the end of the Austral winter (Fig. 5). This process is very quick and begins when the top of the water column, which has a height of approximately 30-40 m, reaches a temperature of approximately -1.8°C, i.e. the freezing temperature. The ice layer covering the sea has a thickness of 2-3 meters, it extends with a speed of about 4 km per day and reaches a surface twice the continent. The sea ice around Antarctica every winter has an extension of 1,300 km and so it isolates the mainland by all the other continents.
During spring, with the ice melting, the ice-sheets move away from the ice pack with a speed that can reach up to 65 km per day.
Figure 5: sea ice extension during (a) November and (b) February (from EOS
Distributed Active Archive Center)
The ice cover is not a continuous stretch, in fact there are ice-free zones, ranging in size from 1 to 10 km, called channels. In addition to the channels there are large areas, called polynia, that may have an extension of up to 350,000 km2 and that are ice free throughout the year (Gordon and Comiso, 1988).
There are two main types of polynia: the coastal and the open ocean (Fig. 6). The coastal polynia develops when the katabatic winds, which blow from the Antarctic continent, push the new formed ice offshore creating a ice-free zone between the coast and the pack. The extension of this type of polynia can be up to 100 km. The katabatic winds form on icy highlands due to the gravity currents generated by the strong cooling that takes place on the continent, these winds reach the coast following the glacial valleys (Gordon and Comiso, 1988).
15
Figure 6: coastal and open ocean polynia formation (from www.mna.it)
The mechanisms that originate the open sea polynia, instead, are still not at all clear, although some hypotheses have been put forward. The most accredited by various authors is that the open sea polynia is being generated for the onset of convective cells, i.e. for the settling of a vertical movement mechanism. The Circumpolar Deep Water, a relatively warm water, raises to the sea surface because it is less dense, but here it cools, sinks again and it is replaced by other "warm" water, which in turn reaches the surface, thus generating convective cells. This type of convective cells may be formed in many ways, but only some of these give rise to a polynia; this occurs because of the intensity of the process. In fact, if the “warm” water that goes up melts part of the ice, it forms a layer of fresh water that, being less dense than sea water, remains stable on the surface and thus prevents the hotter water to reach again the ice layer and melt it. If the fresh water layer is not sufficient to stop the convection, more ice can flow in the area increasing the layer of fresh water and thus stopping the process.
The polynia may be able to self-renew if it reaches a surface large enough; in fact, the area where the convection occurs is proportional to the square of its radius and the amount of ice that can flow in polynia is proportional to the perimeter; if a polynia has a radius greater than a certain minimum value the ice can flow rapidly enough to stop the convection and hence the polynia does not die. The open ocean polynia could have a significant effect on the climate because a surface free of ice releases heat to the atmosphere more rapidly. It is not known, however, if the frequency of polynia formation is sufficient to cause such effects (Gordon and Comiso, 1988). In addition, free water can exchange gases with the atmosphere much more readily than the layer of ice and this could affect the chemistry of the ocean and the atmosphere, altering the normal atmosphere-ocean interaction and thereby generating consequences on climatic conditions on a global scale.
It has also been noted that when polynia areas expand there is an increase of primary productivity in both ice-free areas and in those with ice cover (Gordon and Comiso, 1988; Tremblay and Smith, 2007).
16 1.3 Biogeochemical cycles
The biogeochemical cycles are the path followed by a chemical element within the biosphere. Biogeochemical cycles play an important role in sequestering CO2 from surface waters and in its
transport to the seafloor. Diatoms, in all the oceans, constitute an important component of the biological pump. In the Southern Ocean, in particular, diatoms are the main source of organic material exported as underlined by the same temporal pattern of the carbon and silica fluxes. In these waters, however, there is a decoupling of carbon and silica cycles greater than at any other latitude, resulting in high rates of silica accumulation and sediments poor in carbon (DeMaster et al., 1992; DeMaster et al., 1996; Nelson et al., 1996).
1.3.1 Primary productivity
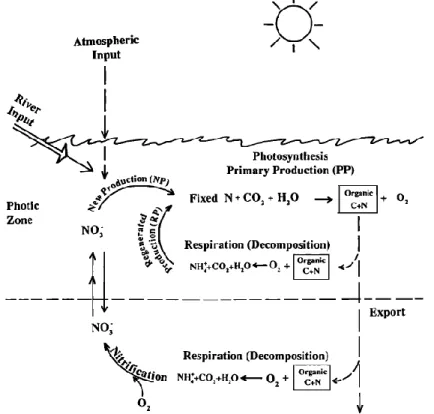
The primary productivity is defined by the conversion rate of dissolved inorganic carbon and nutrients in organic matter through the photosynthesis (Jahnke, 1990). In the surface layer most part of biogenic material is recycled by oxidation, decomposition or predation. Then only a fraction settles to the bottom.
Primary production can be divided in new production (NP) and regenerated production (RP). The first is due to nutrients supply through rivers and atmospheric inputs or upwelling. The second is due to nutrients recycled in the euphotic zone (Jahnke, 1990) (Fig. 7).
Figure 7: schematic representation of carbon and nitrogen cycles in the
17
The average primary productivity in the Southern Ocean has been estimated to be under 40 gC/(m2yr) less than 5% of the global one. It is estimated that at the Southern Ocean seabed occurs only 11% of total organic carbon accumulation but about 50% of bio-silica accumulation (DeMaster, 1981; DeMaster et al., 1992; Smith and Nelson, 1986; Nelson et al., 1996).
There are two possible causes for this fact: higher bio-silica production or higher bio-silica preservation.
The biogenic sediments accumulation is related to the primary productivity of the photic zone, and in particular, at high latitudes, to the production of bio-silica. The primary productivity is influenced by many physical and chemical parameters such as: temperature, irradiation, ice cover and the amount of nutrients available in the water.
• Temperature: it affects the primary productivity and it especially affects the dissolution of some elements sinking to the bottom. Low temperatures raise the Carbonates Compensation Depth (CCD), causing in the Southern Ocean a greater dissolution of carbonates.
• Irradiation: it is essential for photosynthesis and it controls the growth of phytoplankton at seasonal and daily scale. The ice extension strongly reduces irradiation so inhibiting the photosynthesis.
• Ice cover: during periods of maximum expansion of ice there is a reduced growth of microorganisms which can however be trapped alive in the ice and, thanks to ice porosity that allows them to interact with the sea water, proliferate. When seasonal sea ice melts the higher temperature, the water column stratification and the availability of nutrients create the conditions for the development of algal blooms.
• Nutrients: the primary productivity is also influenced by the amount and type of nutrients dissolved in water. The main ones are C, N, Si and Ba. Fe also has a key role in photosynthesis, because it acts as a catalyst, and its influence is currently under study.
The Ross Sea primary productivity shows a high temporal and regional variability: the first due primarily to the expansion and retreat of sea ice, the second to the presence of different groups of organisms.
The productivity is negligible from mid April to early September, during the period in which there is no direct light, while the maximum productivity occurs between mid-September and early November. The retreat of ice occurs in early austral summer first in the polynia areas and then northward. So algal blooms occur first in the south-west and south regions and then it extends to the northern one. This causes two main positive gradients in primary productivity: from north to south and from east to west. Algal blooms occur mainly in ice edge areas during the sea ice retreat, this is because the colder and fresher water released from the ice, adds to the nutrients brought to the surface from deep water (upwelling) and creates the favorable conditions to algal development. Primary productivity in the Ross Sea shows regional differences: diatoms dominate the northern, the south-western and the south-eastern regions while the south-central area of the basin is dominated by not siliceous algae (Phaeocystis antarctica) (Smith et al., 1996). In particular the south-western area is characterized by the highest rates of sediment accumulation and by surface sediments with the most biogenic silica content and the northern area shows the lower productivity of the Ross shelf due to the greater persistence of ice compared to other sectors.
18
In the Ross Sea primary productivity is relatively high if compared to the rest of the Southern Ocean, although it does not reach the levels of low latitudes shelves. Nelson et al. (1996) have estimated an annual primary productivity in the Ross Sea of about 91 gC/(m2yr) in the northern region and 216 gC/(m2yr) in the southern one with an average value of 142 gC/(m2yr) on the entire sea.
1.3.2 Particle fluxes
Particle fluxes in the Ross Sea depend mainly on the primary productivity that occurs in the first 100 m of the water column. The amount and the type of material that subsequently falls along the water column (passive flux) depend on the development of phytoplankton and on the different associations of organisms. Aggregates and fecal pellets produced by zooplankton, which are mainly present in the south-west area and decrease with depth, are an important part of the passive flux (Nelson et al., 1996). The predominant algae in the Ross Sea are diatoms (in the south and north-west) and Phaeocystis antarctica (in the east). Usually diatoms undergo the grazing by zooplankton and belong to the passive flux simply sinking to the bottom or like fecal pellets. The Phaeocystis
Antarctica, instead, is less easily preyed and then it contributes to the passive flux mainly like
aggregates (Smith et al., 2003).
Previous investigations (Langone et al., 1996; Langone et al., 2000) performed in mooring A and B sites documented at both sites an high seasonal variability and similar trends of carbon and silica fluxes denoting a common source (diatoms) for both elements (Nelson at al., 1996).
In site A (Langone et al., 1996) the mass and biogenic fluxes have their peak between March and April, with a delay compared to the highest levels of primary productivity of about two months and they show, along the water column, organic carbon degradation four times greater than bio-silica dissolution.
At mooring B (Langone et al., 2000) lateral advection and resuspension processes have been documented with an amount of sediment collected at the bottom an order of magnitude greater than the one collected at the top.
1.3.3 Carbon cycle
In polar environments occur the greatest exchanges between atmosphere and ocean due to the low temperatures that favour the atmospheric gases absorption processes. In particular, the Southern Ocean accounts for 20-25% of the annual oceanic uptake of CO2 (Takahashi et al., 2002). For this
reason the alterations of biogeochemical cycles in this region may change the percentage of CO2 in
the atmosphere and have a potential impact on the global climate. In addition, changes in the environment arising from the modern increase in atmospheric CO2 content are expected to produce
changes in the sea ice extent and stratification in the water upper column, changes that can profoundly affect the carbon cycle in these regions (Sarmiento et al., 1998). Although the Southern Ocean presents some areas of high productivity, its contribution to the oceanic carbon cycle has not
19
yet been well quantified also due to the high regional and temporal variability, whose causes have to be better defined.
The carbon export processes from the surface depend on the algal bloom, on the vertical fluxes of particles and on the sedimentation rates. All these processes are related not only to the intensity of the algal bloom but also to the characteristics of the dominant species of phytoplankton which in turn influence the food-web. Phytoplankton with different sizes and aggregation forms have different characteristics of vertical speed, drop and biodegradability.
In the Ross Sea, phytoplankton assemblages consist mostly of colonies of diatoms and Phaeocystis
antarctica. The bloom formed by these organisms has high rates of CO2 export fixed
autotrophically in the surface mixed layer, but they differ substantially in their contribution to the biogeochemical cycle (Arrigo et al., 1999). Diatoms are in fact subjected to grazing, resist to surface microbial degradation and fall into aggregates or like fecal pellets because of digestive processes. Colonies of P. antarctica are little subjected to grazing by mesozooplankton and microzooplankton and once aged they are subjected to different fates depending on the physical and chemical characteristics of the environment. They can be exported during periods of rapid growth or precipitate after the maximum bloom or yet they can be lysed in the surface layer and remineralizated giving rise to negligible sediments. The phytoplankton represents a habitat extremely rich in bacteria that contribute to the remineralization and enzymatic dissolution of the particulate organic material both at the surface and during the sinking. Their activities may affect the biological pump (Becquevort and Smith, 2001).
1.3.4 Silica cycle
The greater part of the siliceous sediment at the bottom is due to the primary production. In the surface water the bio-silica is fixed in the skeletons of diatoms and other organisms, and, at the death of such organisms, partly it dissolves in water, forming silicic acid according to the reaction:
SiO2+2H2O Si(OH)4
This process occurs during the sinking of dead organisms, mostly in the first 100 meters (euphotic zone), involving 50% of silica produced by diatoms.
In the deepest layers, silica is instead attacked by bacteria and partly recycled; the remaining silica settle down to the bottom, but this is a small fraction of the silica produced in the euphotic layer. The dissolution process continues in the bottom waters and in the first few centimeters of sediment. The factors that affect the preservation of biogenic silica are:
sinking speed: faster is the fall and lower is the dissolution in the first 100 m; cells thickness and size: it can make difficult for bacteria to attack the organisms; water concentration of Si(OH)4;
temperature: high temperature favor the dissolution of silica, which is why in the Antarctic areas, as the Ross Sea shelf, there is a high accumulation rate of bio-silica (Kamatani, 1982).
20
In the Antarctic region is stored about 75% of the modern accumulation of biogenic silica in marine sediments. Such high accumulation rate was initially attributed to high primary production due to increased availability of nutrients in Antarctic waters. Direct measurements have shown that this production is rather moderate, so the massive accumulation of silica is due to the environmental conditions that allow an excellent preservation of biogenic silica (Langone et al., 1998).
The accumulation of silica is due to organisms that fix this element in their skeleton, so the distribution of silica in the sediments depends on the areas of primary productivity and on the seasonal variability of this production, which in turn depends on sea ice and sea currents.
1.4 Moorings
One of the main systems for the data collection such as temperature, salinity, current speed and for the analysis of particles fluxes along the water column is constituted by moorings.
A mooring is an instrumental chain that is submerged in the sea and held vertically by a series of buoys. Usually the top part is located at about 200 m depth in order to avoid damage due to sea ice while the lower part is fixed to the bottom using an anchorage. The chain may consist of multiple levels of instruments, everyone usually consisting of a CTD, a current meter and a sediment trap in order to record the characteristics of the water column at various depths. These instruments usually record data for one or two years, as long as the mooring is left in the sea, and therefore they allow to obtain
continuous time series of data with measurements made even every half-hour. In Figure 8 it is shown the structure of mooring B positioned during an antarctic cruise. The mooring was composed of two current meters, two Sea Cat, two sediment traps and acoustic releasers.
Vertical fluxes along the water column are determined through the collection in the sediment traps of the particulate matter falling from the euphotic zone.
1.4.1 Sediment traps
Sediment traps are formed by a collection system, cone-shaped or cylindrical, whose bottom is connected to a bottle that has the function of containing the material sinking. For a long term sampling it is used an automatic system which, at fixed intervals, rotates a circular support on which the bottles for the sample collection are placed.
Figure 8: an example of mooring
21
Sediment traps capture the particles principally thanks to the water pressure reduction due to the Bernoulli law: an increasing in speed caused by throttling the flux which enters into the trap due to a lowering of pressure.
The low pressure inside the trap causes a water and then a particles backwash. The analysis of the material collected into the traps allows to determine the nature of the particles and the estimation of the vertical fluxes in the water column. Particles collected in a sediment trap are of two types: those who enter by gravitational fall, as fecal pellets or empty shells, and which have therefore to be considered as passive flux, and the organisms that enter into the trap swimming (called “swimmers”). To a correct fluxes evaluation it is necessary to distinguish passive from active fluxes. So all the organisms that enter "voluntarily" in the trap swimming have to be removed from the sample to avoid an overestimation of fluxes. These organisms may be, for example, protozoa of small dimensions, as flagellates and ciliates, or of larger sizes as foraminifera and radiolarians, pteropods and small arthropods.
The swimmers, furthermore, once inside the trap can feed the collected material and thereby cause a particle loss, for this reason it is necessary to use preservatives poisons inside the bottles.
Usually along a mooring are positioned some sediment traps, this allows to determine how the sinking material is modified during the fall, for example due to degradation processes.
Many studies have been carried out on the efficiency of sediment traps. From this point of view the cylindrical traps are better, but for long term sampling and in areas with low sediment fluxes, as the Southern Ocean, conical traps are considered more efficient because they have a large collection surface (GOFS, 1989).
Sediment traps are also useful to have information about the recent sedimentation. By comparing the sediment traps results with the ones related to older sediments at the sea floor, it is possible to better interpret the climate changes that have occurred in the past and to predict future changes
22 Acknowledgments
Sea Ice Concentration Data were provided by the EOS Distributed Active Archive Center (DAAC) at the National Snow and Ice Data Center, University of Colorado, Boulder, Colorado.
References
Anderson J.B., Brake C.F. and Myers N.C., 1984. Sedimentation on the Ross Sea continental shelf, Antarctica. Marine Geology, 57, 295-333.
Arrigo K.R., Robinson D.H., Worthen D.L., Dunbar R.B., DiTullio G.R., VanWoert M., Lizotte M.P., 1999. Phytoplankton Community Structure and the Drawdown of Nutrients and CO2 in the
Southern Ocean. Science, 283, 365-367.
Bals-Elsholz T.M., Atallah E.H., Bosart L.F., Wasula T.A., Cempa M.J., Luro A.R., 2001. The winter Southern Hemisphere split jet: structure, variability, and evolution. Journal of Climate, 14, 4191–4215
Becquevort S. and Smith W.O., 2001. Aggregation, sedimentation and biodegradability of phytoplankton-derived material during spring in the Ross Sea, Antarctica. Deep Sea Research, II, 48, 3155-4187.
Bertler N.A.N., Barrett P.J., Mayewski P.A., Fogt R.L., Kreutz K.J., Shulmeister J., 2004. El Niño suppresses Antarctic warming. Geophysical Research Letters, 31, L15207.
Bertler N.A.N., Naish T.R., Mayewski P.A., Barrett P.J., 2006. Opposing oceanic and atmospheric ENSO influences on the Ross Sea Region, Antarctica. Advances in Geosciences, 6, 83-86.
Bromwich, D.H., Robasky F.M., Keen R.A., Bolzan J.F., 1993. Modeled variations of precipitation over the Greenland Ice Sheet. Journal of Climate, 6, 1253-1268.
Carleton A.M., 2003. Atmospheric teleconnections involving the Southern Ocean. Journal of Geophysical Research, 108, 8080, 15.
Chen B., Smith S.R., Bromwich D.H., 1996. Evolution of the tropospheric split jet over the South Pacific Ocean during the 1986-89 ENSO cycle. Monthly Weather Review, 124, 1711–1731.
Comiso J.C., McClain C.R., Sullivan C.W., Ryan J.P., Leonard C.L., 1993. Coastal Zone Color Scanner pigment concentrations in the southern Ocean and relationships to geophysical surface features. Journal of Geophysical Research, 98, 2419-2451.
Cullather, R. I., Bromwich D.H., Van Woert M.L., 1996. Interannual variability in Antarctic precipitation related to El Niño-Southern Oscillation. Journal of Geophysical Research, 101, 19109-19118.
DeMaster D.J., 1981. The supply and accumulation of silica in the marine environment. Geochimica et Cosmochimica Acta, 45, 1715-1732.
23
DeMaster D.J., Dunbar R.B., Gordon L.I., Leventer A.R., Morrison J.M., Nelson D.M., Nittrouer C.A., Smith W.O.Jr., 1992. Cycling and accumulation of biogenic silica and organic matter in high-latitude environments: the Ross Sea. Oceanography, 5, 3, 146-153.
DeMaster D.J., Ragueneau O., Nittrouer C.A., 1996. Preservation efficiencies and accumulation rates for biogenic silica and organic C, N and P in high-latitude sediments: the Ross Sea. Journal of Geophysical Research, 101, 18501-18518.
Frignani M., Langone L., Labbrozzi L. and Ravaioli M., 2000. Biogeochemical Processes in the Ross Sea (Antarctica): Present Knowledge and Perspectives, Ross Sea Ecology, 39-50.
Frignani M., Giglio F., Accornero A., Langone L., Ravaioli M., 2003. Sediment characteristics at selected sites of the Ross Sea continental shelf: does the sedimentary record reflect water column fluxes?. Antarctic Science, 15(1), 133-139.
Garreaud R.D., Battisti D.S., 1999. Interannual (ENSO) and Interdecadal (ENSO-like) Variability in the Southern Hemisphere Tropospheric Circulation. Journal of Climate, 2113-2123.
GOFS, 1989. Sediment trap technology and sampling. U.S. GOFS planning Report, 10, 94. Gordon A.L., Comiso J.C., 1988. Le polynja antartiche. Le Scienze, 62-69.
Honjo, S., Doherty, K.W., 1988. Large aperture time-series sediment traps: design objectives, construction and application. Deep-Sea Research 35, 133-149.
Jacobs S.S., Fairbanks R.G., Horibe Y., 1985. Origin and evolution of water masses near the Antarctic continental margin: evidence from H218O/H216O ratios in seawater. In: Jacobs S.S. (ed),
Oceanology of the Antarctic Continental Shelf: Antarctic Research Series, AGU, 43, 59-85.
Jacobs S.S., Giulivi C.F., 1998. Interannual ocean and sea-ice variability in the Ross Sea. Antarctic Reasearch Series, 75, 135-150.
Jaeger J.M., Nittrouer C.A., DeMaster D.J., Kelchner C., Dunbar R.B., 1996. Lateral transport of settiling particles in the Ross Sea and implications for the fate of biogenic material. Journal of Geophysical Research, 101, 18478-18488.
Jahnke R.A., 1990. Ocean flux studies: a status report. Reviews of Geophysics, 28, 381-398. JGOFS, 1992. Southern Ocean process study. U.S. GOFS Planning Report 16, 114.
Kamatani A., 1982. Dissolution rates of silica from diatoms decomposing at various temperatures. Marine Biology, Berlin, 68, 91-96.
Karoly D.J., 1989. Southern Hemisphere circulation features associated with El Niño-Southern Oscillation events. Journal of Climate, 2, 1239–1252.
Kidson J.W., 1999. Principal modes of Southern Hemisphere low frequency variability obtained from NCEP–NCAR reanalyses. Journal of Climate, 12, 2808–2830.
24
Kiladis G.N., Mo K.C., 1998. Interannual and interseasonal variability in the Southern Hemisphere. Meteorology of the Southern Hemisphere, D. J. Karoly and D. G. Vincent, Eds., Amer. Meteor. Soc., 307-336.
Klepikov V.V., Grigor’yev Y.A., 1966. Water circulation in the Ross Sea. Soviet Antarctic Expedition Report, 6, 52-54.
Kwok R., Comiso J.C., 2002. Southern Ocean climate and sea-ice anomalies associated with the Southern Oscillation. Journal of Climate, 15, 487–501.
Langone L., Dunbar R.B., Labbrozzi L., Ravaioli M, Frignani M., 1996. Preliminary results from the ROSSMIZE cruise on biosiliceous sediment accumulation. Int Workshop Ross Sea Ecology, Taormina, May 14-16, 98-100 (Abstr).
Langone L., Frignani M, Labbrozzi L. and Ravaioli M., 1998. Present-day biosiliceous sedimentation in the northwestern Ross Sea, Antarctica. Journal of Marine Systems, 17, 459-470. Langone L., Frignani M, Ravaioli M. and Bianchi C., 2000. “Particle fluxes and biogeochemical processes in an area influenced by seasonal retreat of the ice margin (northwestern Ross Sea, Antarctica). Journal of Marine Systems, 27, 221-234.
Langone L., Dunbar R.B., Mucciarone D.A., Ravaioli M., Meloni R., Nittrouer C.A., 2003. Rapid sinking of biogenic material during the late austral summer in the Ross Sea, Antarctica. Biogeochemistry of the Ross Sea, Antarctic Research Series, 78, 221-234.
Manzoni M., 1989. Prospettiva Antartide – una lettura di geografia antropica – studi e ricerche sul territorio. Edizioni UNICOPLI, Milano.
Mo K.C., Higgins R.W., 1998. The Pacific–South American Modes and Tropical Convection during the Southern Hemisphere Winter. Monthly Weather review, 126, 1581-1596.
Nelson D.M., DeMaster D.J., Dunbar R.B., Smith W.O. Jr., 1996. Cycling of organic carbon and biogenic silica in the Southern Ocean: Estimates of water column and sedimentary fluxes on the Ross Sea continental shelf. Journal of Geophysical Research, 101, 18519-18532.
Parker D.E., 1983. Documentation of a Southern Oscillation Index. Meteo Magazine, 112, 184-188. Pidwirny, M., 2006. Global Scale Circulation of the Atmosphere. Fundamentals of Physical Geography, 2nd Edition. Date Viewed.
Sarmiento J.L., Hughes T.M.C., 1998. Anthropogenic CO2 uptake in a warming ocean. Tellus
(1999), 51B, 560–561.
Smith W.O. Jr., Nelson D.M., 1986. Importance of ice edge phytoplankton blooms in the Southern Ocean. Bioscience, 36, 25 l-257.
Smith W.O. Jr., Nelson D.M., DiTullio G.R., Leventer A.R., 1996. Temporal and spatial patterns in the Ross Sea: phytoplankton biomass, elemental composition, productivity and growth rates. Journal of Geophysical Research, 101, 18455-18465.
25
Smith W.O. Jr., Dennet M.R., Mathot S., Caron D.A., 2003. The temporal dynamics of the flagellated and colonial stages of Phaeocystis antarctica in the Ross Sea. Deep-Sea Research, II, 50, 605-617.
Smith W.O. Jr., Sedwick P.N., Arrigo K.R., Ainley D.G., Orsi A.H., 2012. The Ross Sea in a sea of change. Oceanography, 25(3), 90-103.
Stammerjohn S.E., Martinson D.G., Smith R.C., Yuan, X., Rind D., 2008. Trends in Antarctic annual sea ice retreat and advance and their relation to El Nin˜o–Southern Oscillation and Southern Annular Mode variability. Journal of Geophysical Research, 113, C03S90.
Sullivan C.W., Arrigo K.R., McClain C.R., Comiso J.C., Firestone J., 1993. Distributions of phytoplankton blooms in the Southern Ocean. Science, 262, 1832-1837.
Takahashi T., Sutherland S.C., Sweeney C., Poisson A., Metzl N., Tilbrook B., Bates N., Wanninkhof R., Feely R.A., Sabine C., Olafsson J., Nojiri Y., 2002. Global sea-air CO2 flux based
on climatological surface ocean pCO2, and seasonal biological and temperature effects. Deep-Sea
Research II, 49, 1601-1622.
Treguer P. and Van Bennekom A.J., 1991. The annual production of biogenic silica in the Antarctic Ocean. Marine Chemistry, 35, 477-487.
Tremblay J.E. and Smith W.O. Jr., 2007. Primary production and nutrient dynamics in polynyas. IN: Polynyas: Windows into the World., EDS: D.G. Barber & W.O. Smith. Elsevier, 239-270. Turner J., 2004. The El Niño-Southern Oscillation and Antarctica. Int. Journal of Climatology, 24, 1-31.
van den Broeke M.R., 2000. On the interpretation of Antarctic temperature trends. Journal of Climate, 13, 3885-3891.
Vanney J.R., Falconer R.K.H. and Johnson G.L., 1981. Geomorphology of the Ross Sea and adjacent oceanic provinces. Marine Geology, 41, 73-102.
26
Chapter 2
A revised sediment trap split procedure
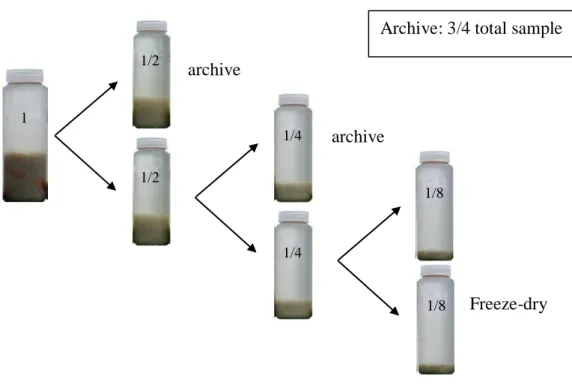
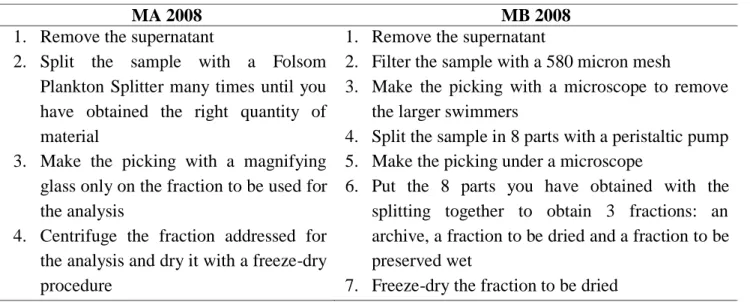
2.1 AbstractWe propose a method for the treatment of sediment trap samples, with the aim of combining precision and practicality. First we review the different methods for sample processing described in the literature. The most important differences are related to the mesh size used for removing “large” particles or aggregates (from 150 micron to 1 mm), the use (or not) of filters, and of a microscope for picking out “swimmers”. The procedure presented here combines methods used at ISMAR – CNR Bologna and at Stanford University. We recommend the removal of all the organisms entering the trap alive (swimmers) using a 650 micron mesh, analysis using a stereomicroscope, and quantitative subdividing using a Peristaltic Pump.
2.2 Introduction
Particle fluxes represent an important measure for evaluating the transfer of organic carbon and biogenic silica through the water column. The conversion of dissolved CO2 to biological materials
followed by particle export lies at the heart of the biological pump. Understanding the role of particle fluxes is therefore crucial for evaluating C exchange between atmosphere and ocean. Biogenic material accumulating on the sea floor is controlled by the balance between export of particulate matter from surface waters and losses that occurs during as material sinks through the water column.
Due to photosynthetic processes carbon dioxide is fixed by phytoplankton and then transferred to deep waters below the mixed layer mainly through gravitative particulate settling, physical mixing or zooplankton vertical migration.
Particulate export dynamics depend on the relationship between particle supply, production, consumption and aggregation and so they are controlled by biological and physical factors. Particulate export is subjected to seasonal and inter-annual variability as well as to short-term climatic events (Buesseler et al., 2007).
Nutrient availability controls phytoplankton growth processes which are the main source of particulate organic carbon in the water column.
Marine biogeochemical cycles play a key role in controlling atmospheric CO2. About 20 to 25% of
the annual CO2 oceanic uptake occurs in the Southern Ocean (Takahashi et al., 2002), so the
biogeochemical changes that affect this region may influence atmospheric pCO2 levels and have an
important impact on global climate.
This chapter consists of a paper submitted to “Methods in Oceanography” by Chiarini F., Capotondi L., Dunbar R.B., Giglio F., Langone, L, Mammì I., Mucciarone D.A., Ravaioli, M., Tesi T., “A revised sediment trap split procedure”.
27
To predict future changes in the level of atmospheric CO2 and to interpret changes that happened in
the past it is necessary to determine ocean carbon export rates on a global scale as well as the factors that can alter the carbon cycle.
Sediment traps are one of the more important tools used to collect quantitative information about particulate matter falling from the euphotic zone toward the seabed. Sediment trap data sets are used to determine temporal variability in particle fluxes and to investigate the mechanisms that regulate biogeochemical fluxes in the oceans.
The analysis of materials collected by sediment traps determines the composition of the particles allowing an estimation of a variety of vertical fluxes (e.g. organic C, radiolarians, biogenic silica, calcium carbonate) through the water column as well as their seasonal variability. The export of POC, produced by phytoplankton in the euphotic layer, gives an estimation of the efficiency of the biological pump (Ducklow et al., 2001).
In order to study samples from sediment traps a series of procedures are generally followed.
The particles collected by sediment traps are generally composed of a mixture of biogenic materials and lithogenic components (Deuser et al., 1981; Jickells et al., 1984) as well as occasional and typically minor pollutant phases (Jickells et al., 1984; Knap et al., 1986).
Regarding the biogenic components, it is first necessary to discriminate between passive and active flux in the water column. The material collected in a sediment trap can be divided in two groups: dead organisms that entered the trap via gravitative settling (sinkers), fecal pellets, empty shells or algae (passive flux), and live organisms that actively enter the trap (swimmers). The aim of particles flux studies is to assess the export rate of the biogenic component from the surface layers, so only the passive flux must be considered and swimmers have to be identified and then carefully removed.
Additional problems include sample preservation, the instruments used for the splitting, the mesh size of any sieves used and the methods of dispersion of material during the operations.
The aim of this paper is to propose a methodology to process samples collected by sediment trap in order to optimize the accuracy and time-efficiency of the procedures used at ISMAR-CNR-Bologna (Heussner et al., 1990) to process Antarctic sediment trap samples. The accuracy in the procedure for the treatment of sediment trap samples is crucial for two reasons: these areas are difficult to reach and, at the same time, their investigation allows to understand the biogeochemical processes at global scale. Thanks to various research projects (ROSS-MIZE, BIOSESO I and II, ABIOCLEAR, ROAVERRS and VECTOR- Fisr-MInister of University and Research), coordinated by Institute of Marine Sciences - National Research Council - Bologna, two moorings (A and B) were deployed in two different areas of the Ross Sea (Fig. 1) since 1991 and the material has been collected during several oceanographic cruises from 1991 to 2010.
28
2.3 Review of procedures from the published literature
There is no single, standardized sample processing methodology in use today.
Depending on the composition and origin of the collected samples different protocols are adopted. For example, in samples with large swimmers a larger sieve may be used for removal relative to samples where the organisms are smaller.
The various methods differ principally in whether swimmer removal is accomplished by picking or sieving, as well as the specific methods of splitting and drying (Table 1).
The use of a different splitter modifies the precision of the measurement of the sample mass, whereas a different method of swimmer removal may affect the biogenic fluxes values.
Some authors (Conte et al., 2001; Honjo and Manganini, 1993; Miquel et al., 1994 and Karl et al., 1996) use one or more sieves with different meshes (125, 500, 600, 1000, 1500 micron and 1 mm) before splitting to remove the larger swimmers or flocculent materials. This procedure is followed, sometimes, by swimmer picking under a microscope with different magnifications (Miquel et al., 1994 and Conte et al., 2001). In some cases swimmer removal is done only with sieving (Honjo e Manganini, 1993 and Karl et al., 1996).
Others (Steinberg et al., 2001 and Antia et al., 1999) remove swimmers only by picking under microscope.
Splitting and drying methods vary widely with respect to the different analyses to be performed. In Table 1 we report these methods and in some cases the devices used.
Some authors (Steinberg et al., 2001; Antia et al., 1999 and Karl et al., 1996) split the entire sample into 4 fractions (Karl et al., 1996) or in a range between 1/8-1/128 splits (Antia et al. 1999); others use different splitting schemes depending on the particle size (Conte et al., 2001; Honjo and Manganini, 1993 and Miquel et al., 1994).
Ross Ice Shelf
Victoria Land
29 Table 1
Different splitting methods (from Buesseler et al. 2007 modified). *See geographical details in reference.
Investigated area*
Trap depth Time for picking Mesh size (if used) Type of picking
Splitting method Reference
Bermuda Atlantic Time-series Study (BATS) 150 200 300 1-2 hours none with 250X and 500X magnific ation
VERTEX method Steinberg et al. 2001 Hawaii Ocean Time-series (HOT) 800 1500 2800 4000 0 hour 1000 micron
None Sample splitted in 4 fractions with a rotating splitter device Karl et al. 1996 Mediterranea n Sea 80 200 1000 0.5-1 hour 1500 micron and 600 micron In solution and with 50X magnific ation
After sieving through 1500 micron sieve, 1/4 or 1/8 of the liquid sample is put apart. The remain sample, after sieving and picking, is desalted and freeze-dried Miquel et al. 1994 European continental margin 600 and1050 at a site 600, 1440 and 3220 at the other site About 3-5 hours 9 if there is a high flux
none 120X Samples splitted in a range between 1/8 and 1/128 Antia et al. 1999 North Atlantic Bloom Experiment (NABE) 1000 2000 4500 or 3500 0 hour 1000 micron
None >1000 micron fraction splitted in 4 subsamples; <1000 micron splitted in 4 and then in 10 to obtain 40 subsamples.
Device: rotating wet sediment splitter Honjo e Manganin i 1993 BATS (Ocean Flux Program, OFP) 500 1500 3200 0-2 hours 1000 micron, 500 micron and 125 micron Only for >500 micron fraction with 50X magnific ation >1000 micron: oven dried at 50°C <1000 micron: splitted into 10 subsamples. Device: McLane rotary splitter
Conte et al. 2001
Conte et al. (2001), in order to use the sample for organic geochemical analyses and reduce the potential trace metal contamination, split the sample with 1000 and 500 micron meshes and subsequently remove swimmers by picking. Then they oven dry the >1000 micron fraction at 50°C, recombine the <1000 micron fractions and split it into 10 subsamples. Three or four of these subsamples are set aside for analyses, the remaining subsamples are recombined and sieved with