26
Results
27
3. RESULTS
3.1 Hp release by mouse WAT
According to Fain et al. (Fain JN et al., 2004), explants of human WAT release Hp into the
medium. We wanted to verify whether mouse WAT displayed this same capacity. The release of
Hp by EPI WAT explants was fairly linear over the incubation time (Fig.6A). We then wanted to
compare the release of Hp from WAT with that from liver, considered the main source for this
glycoprotein (Bensi G et al., 1985), and from kidney, which conversely exhibits very low Hp
expression (Chiellini C et al., 2002). Over 24 h, liver was the greatest producer of Hp, and Hp
production in WAT was significantly higher than in kidney (Fig.6B). These results rule out the
possibility that what was detected in the medium was due to the spill-over of Hp contained in
excised vessels, because a comparable amount of released Hp would be expected from all
examined tissues. On the basis of these data, we calculated that the average daily release of Hp
from visceral WAT and liver is 256 ± 92 and 660 ± 88 ng / g tissue per day, respectively. By
taking into account that visceral WAT represents ∼13% of the body weight (BW) of an animal
(the average BW of these animals is 26.5 g) and that the average liver weight is 1.5 g, the total
Hp daily production can be estimated to attain 0.88 µg for visceral WAT and 0.99 µg for liver.
Such an estimate for WAT contribution to circulating Hp is in the lower range, not including the
28 Figure 6.Hp release into the medium by mouse tissue explants. A: Hp release from mouse EPI WAT is shown at 3, 12, 24 and 48 h. One-way ANOVA: P < 0.01. B: Hp release from mouse liver (circle), EPI WAT (square), and kidney (triangle) is shown at 3, 12, and 24 h. Two-way ANOVA: time effect P < 0.0001, tissue effect P < 0.0001, interaction P < 0.0001. Bonferroni post hoc tests at 24 h: EPI WAT vs. liver ***P < 0.001; EPI WAT vs. kidney $$P < 0.01, liver vs. kidney °°°P < 0.001. Data are expressed as means ± SEM of five experiments.
To rule out the possibility that the Hp release measured in mouse WAT explants was due to other
cell types or to continuous and progressive spill-over from vessels trapped in the tissue, Hp
concentration was assessed in the medium where primary mouse adipocytes had been cultured
for 6 h. Hp was present in this medium at a concentration of 22.2 ± 1.9 ng / mL / 106 cells.
Although this value cannot be easily transformed into Hp release per gram of tissue, because a
variable number of cells are lost during cell isolation and preparation, this result definitely
establishes that adipocytes themselves are able to release Hp.
3.2 HFD results in increased Hp production in mice
It has been previously demonstrated that serum Hp is directly related to adiposity in humans
(Chiellini C et al., 2004). To investigate this aspect in mice, a group of WT mice was exposed
3 12 24 0 200 400 600 800 EPI W AT liver kidney Time (hours) H p r e le a s e (n g /g t is s u e ) 3 12 24 48 0 200 400 600 800 Time (hours) H p r e le a s e (n g /g t is s u e )
°°°
***
$$
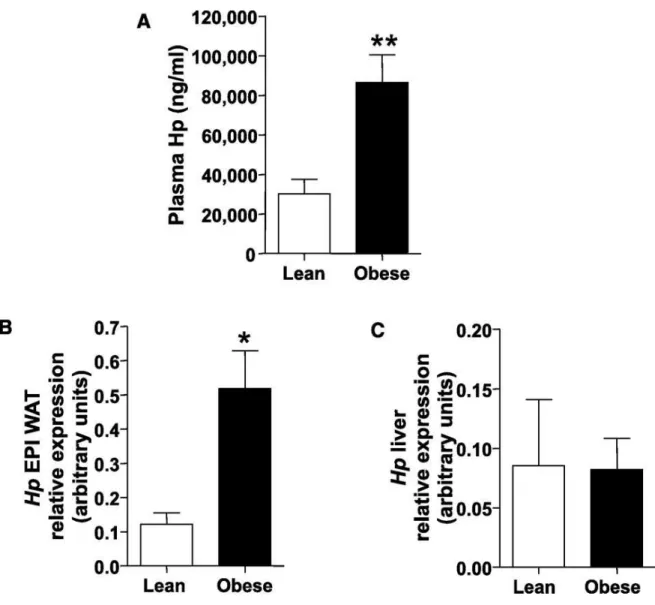
A B29 for 12 weeks to a high fat diet (HFD) on which animals gained ∼88% of their initial BW. Serum
Hp was then assessed before and after HFD treatment, and a significant increase of serum Hp of
approximately threefold was observed (Fig.7A). Hp gene expression, as assessed by real-time
PCR, was significantly higher in the EPI WAT but not in the liver of obese mice compared with
lean mice (Figs.7B and C). Taken together, these results suggest that in murine obesity Hp gene
expression is specifically induced in WAT.
Figure 7. HFD treatment results in increased Hp production. A: Hp plasma levels in lean (n = 7) and obese (n = 7) WT mice. B: Hp WAT mRNA abundance in lean and obese WT mice. C: Hp liver mRNA abundance in lean and obese WT mice. Student’s t test: *P < 0.05, **P < 0.01. Data are expressed as means ± SEM.
30
3.3 Physical parameters and plasma biochemistry of Hp
−/−mice
To investigate the role of Hp in metabolism, an in vivo loss of function approach was
undertaken. Adult Hp−/− mice and WT controls were analyzed under two different diet regimens,
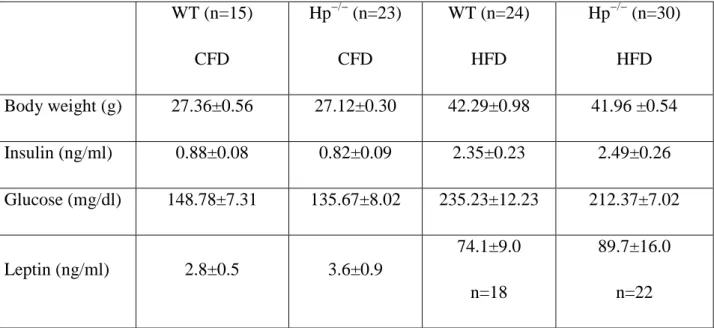
namely chow food diet (CFD) and HFD. HFD treatment resulted in a significant increase in BW
in both Hp−/− and WT animals compared with CFD-treated mice. No genotype effect was
observed: WT and Hp−/− mice showed similar BW on a regular diet and did not differ in their
susceptibility to gain weight when fed with an HFD (Table 1). When concentrations of fasting
glucose, insulin and leptin were assessed, a diet effect but not a genotype effect was observed
(Table 1). WT (n=15) CFD Hp−/− (n=23) CFD WT (n=24) HFD Hp−/− (n=30) HFD Body weight (g) 27.36±0.56 27.12±0.30 42.29±0.98 41.96 ±0.54 Insulin (ng/ml) 0.88±0.08 0.82±0.09 2.35±0.23 2.49±0.26 Glucose (mg/dl) 148.78±7.31 135.67±8.02 235.23±12.23 212.37±7.02 Leptin (ng/ml) 2.8±0.5 3.6±0.9 74.1±9.0 n=18 89.7±16.0 n=22
Table 1. Physical and metabolic parameters in WT and Hp−/− mice under CFD and HFD treatment. Body Weight: 2-way ANOVA diet effect P<0.0001; Insulin: 2-way ANOVA diet effect P<0.0001; Glucose: 2-way ANOVA diet effect P<0.0001; Leptin: 2-way ANOVA diet effect P<0.0001. Data are expressed as means ± SEM.
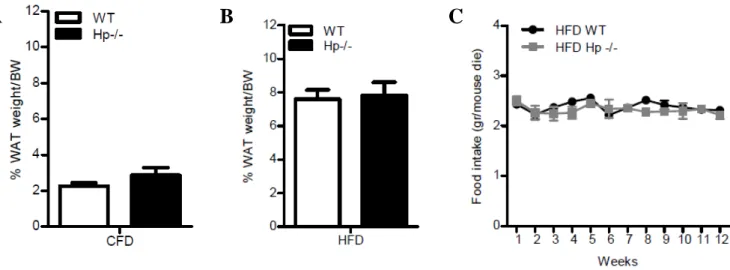
31 Percentage of fat was similar in lean WT and Hp−/− mice (Fig.8A). No genotype related
differences were also evidenced in WAT weight / body weight (% of fat) or food intake (Figs.8
B and C) of HFD WT and Hp−/− mice.
Figure 8. Physical parameters in WT and Hp−/− mice under CFD and HFD treatment. A: Fat % (PERI
WAT weight + EPI WAT weight + SC WAT weight)/body weight) in CFD WT and Hp−/− mice. B: Fat %
(PERI WAT weight + EPI WAT weight + SC WAT weight)/body weight) at the end of HFD. C: Food
intake of Hp−/− (grey squares) and WT (black circles) during HFD.
Weights of EPI and PERI fat pads consistently were affected by diet but not by genotype
(Figs.9A and B). Likewise, BAT size was increased (independently of genotype) in HFD-treated
mice (Fig.9C). Histological examination revealed that interscapular BAT of HFD-treated mice
was composed mainly of hypertrophic unilocular cells as opposed to lean mice, in which typical
multilocular cells predominate (Fig.9D), that is in line with work by others (Cinti S et al., 1997;
Harada K et al., 2003).
C
B
32 Figure 9. HFD effects on adipose depots. Bar graphs showing weight of EPI WAT (A), PERI fat pads
(B) and BAT (C) in CFD- and HFD WT and Hp−/− mice. Two-way ANOVA for A, B, C: diet effect P <
0.0001. Bonferroni post hoc test: CFD vs. HFD ***P < 0.001. Data are expressed as means ± SEM. D:
Hematoxylin and eosin staining of 5-µm BAT sections of WT and Hp−/− mice under CFD or HFD
33
3.4 Hp deficiency results in ameliorated glucose homeostasis in obesity
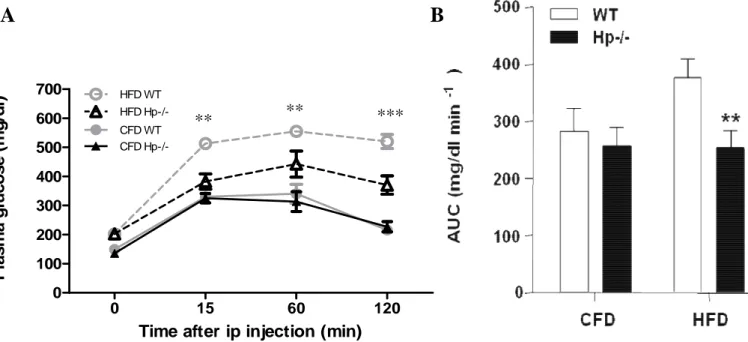
Animals were challenged with an intraperitoneal (i.p.) glucose tolerance test. No genotype effect
was observed in CFD-treated animals (Fig.10A). Upon HFD, WT mice exhibited an important
glucose intolerance with no sign of glycemia decreasing at 120 min after glucose stimulus. This
effect was attenuated in Hp−/− mice, for which a decrease, albeit moderate, was observed at 120
min. This is mirrored in the significantly lower value of the area under the curve (AUC)
exhibited by HFD Hp−/− mice compared with WT mice (Fig.10B).
Figure 10. Glucose homeostasis and insulin signaling of WT and Hp−/− mice. A: Intraperitoneal glucose tolerance test in CFD- and HFD-treated mice (n = 12). Two-way ANOVA: time effect, genotype
effect, interaction P < 0.0001. Bonferroni post hoc tests: HFD WT vs. HFD Hp−/− **P < 0.01, ***P <
0.001. B: Area under the curve shown in A, calculated using the trapezoidal method. Student’s t test:
HFD WT vs. HFD Hp−/− **P < 0.01. Data are expressed as means ± SEM.
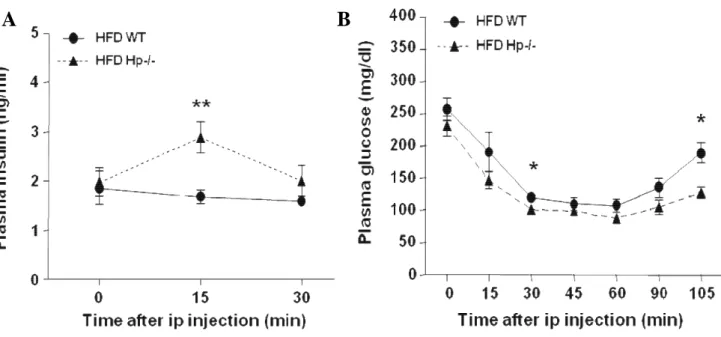
Of importance, HFD Hp−/− mice displayed a clear glucose-stimulated insulin secretion, as
opposed to WT mice, which showed no response (Fig.11A).
0 15 60 120 0 100 200 300 400 500 600 700 CFD WT HFD WT CFD HFD
Hp-/-Time after ip injection (min)
P la s m a g lu c o s e ( m g /d l) ** ** ***
A
B
34 During an intraperitoneal insulin tolerance test, HFD Hp−/− mice were slightly more
insulin-sensitive than HFD WT mice (Fig.11B). Of interest, an insulin-induced glucose decrease
persisted for a longer period in the former (Lisi S, Gamucci O et al., 2011).
Figure 11. Glucose homeostasis and insulin signaling of WT and Hp−/− mice. A: Glucose-stimulated insulin secretion in HFD-treated mice (n = 8). Two-way ANOVA: genotype effect P < 0.01. Bonferroni
post hoc test at 15 min: HFD WT vs. HFD Hp−/− **P < 0.01. Data are expressed as means ± SEM. B:
Intraperitoneal insulin tolerance test in HFD-treated mice (n = 8). Two-way ANOVA: time effect,
genotype effect, P < 0.0001. Bonferroni post hoc test at 30 and 105 min: HFD WT vs. HFD Hp−/− *P <
0.05. Data are expressed as means ± SEM.
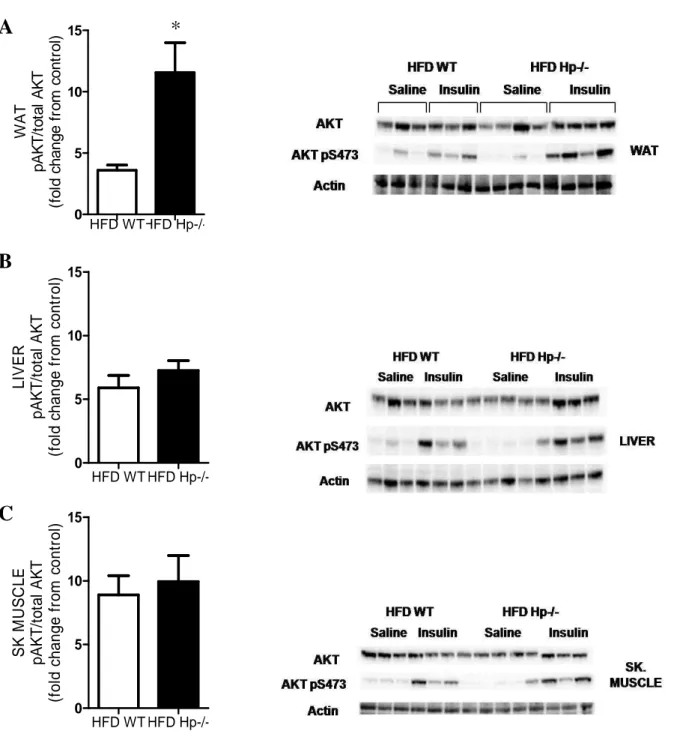
3.5 Insulin action in liver, WAT and skeletal muscle of HFD Hp
−/−mice
To better understand how global Hp deficiency contributes to define glucose homeostasis and
insulin sensitivity in HFD-treated mice, we evaluated insulin-stimulated phosphorylation of AKT
35 Ser-473 in WAT, liver and skeletal muscle (gastrocnemius). This was significantly enhanced in
WAT and showed a trend toward increase in liver and skeletal muscle of HFD Hp−/− mice
compared with HFD WT mice (Figs.12 A-C) (Lisi S, Gamucci O et al., 2011).
Figure 12. Glucose homeostasis and insulin signaling of WT and Hp−/− mice. A-C: Insulin signaling in
vivo in WAT (A), liver (B), and skeletal muscle (C) of HFD WT and HFD Hp−/− mice. Mice (n = 3–4 per
group) were fasted for 6 h, injected intraperitoneally with saline or insulin at 10 units/kg BW, and killed HFD WT HFD Hp-/-0 5 10 15 L IV E R p A K T /t o ta l A K T (f o ld c h a n g e f ro m c o n tr o l) HFD WT HFD Hp-/-0 5 10 15 S K M U S C L E p A K T /t o ta l A K T (f o ld c h a n g e f ro m c o n tr o l)
*
HFD WTHFD Hp-/-0 5 10 15 W A T p A K T /t o ta l A K T (f o ld c h a n g e f ro m c o n tr o l)A
B
C
36 10 min thereafter. Insulin-stimulated Ser473 phosphorylation of AKT was assessed by immunoblotting (right). Actin served as loading control. Quantification of phosphoproteins is shown in the corresponding bar graphs (left). Phosphoproteins were normalized to the corresponding total proteins and are
expressed as fold changes from relative saline-treated control . Student’s t test: HFD WT vs. HFD Hp−/−
*P < 0.05. Data are expressed as means ± SEM. AUC, area under the curve; SK, skeletal.
Taken together, these data suggest that Hp deficiency constitutes a partial protection against the
onset of obesity-associated glucose intolerance, dampened glucose-stimulated insulin
production, and insulin resistance. The latter is at least partially explained by a better preserved
insulin response in the WAT.
3.6 Liver in lean and obese Hp
−/−mice
Hp is abundantly expressed in the liver (Bensi G et al., 1985), and hepatosteatosis /
hepatomegaly often characterizes obesity (Van Steenbergen W et al., 1995). Indeed, HFD WT
mice showed an important (35%) increase of their liver weight compared with CFD WT mice.
HFD treatment resulted in a less pronounced (15%, not significant) liver weight increase in Hp−/−
mice (Fig.13A). Histological analysis revealed a lower lipid accumulation in the liver of Hp−/−
mice (Fig.13B). In line with this, triglyceride content was significantly lower in HFD Hp−/− mice
37 Figure 13. Weight and triglyceride content in the liver of Hp−/− mice. A: Liver weight of WT and Hp−/− mice after CFD or HFD (n = 15). Two-way ANOVA: diet effect P < 0.001, genotype effect P < 0.05. B:
Oil Red O staining of liver sections (8 µm) from HFD WT and HFD Hp−/− mice. C: Total liver
triglyceride content in WT and Hp−/− mice. Two-way ANOVA: diet effect P < 0.0001, genotype effect P <
0.01, interaction P < 0.05. Bonferroni post hoc tests referred to A and C: HFD WT vs. HFD-Hp−/− **P <
0.01, ***P < 0.001. Bonferroni post hoc test CFD-WT vs. HFD WT §§P < 0.01, §§§P < 0.001. Data are expressed as means ± SEM.
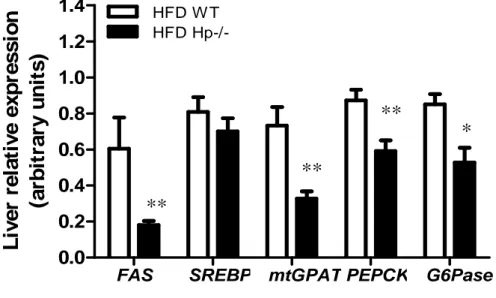
To investigate the mechanisms underlying the reduced triglyceride accumulation observed in the
liver of obese Hp−/− mice, we measured the abundance of transcripts for 1) genes involved in
lipid biosynthesis and metabolism, including the enzyme fatty acid synthase (FAS), the
transcription factor sterol regulatory element-binding protein (SREBP), and the mitochondrial
negative regulator of fatty acids oxidation glycerol 3-phosphate acyltransferase (mtGPAT); and
2) two gluconeogenesis rate-limiting enzymes, namely, phosphoenolpyruvate carboxykinase PEPCK and glucose-6 phosphatase (G6Pase). FAS, SREBP, mtGPAT, PEPCK, and G6Pase
38 were downregulated by 66, 13, 53, 32, and 38%, respectively, in the liver of HFD Hp−/− mice
(Fig.14) compared with HFD WT mice, which is consistent with decreased lipid synthesis,
increased fatty acids β oxidation (Lindén D et al., 2004), and diminished gluconeogenesis
(Samuel VT et al., 2004).
Figure 14. Gene expression in the liver of Hp−/− mice. Relative expression of genes involved in liver
metabolism (FAS, SREBP, mtGPAT, PEPCK and G6Pase) in HFD WT and Hp−/− mice (n = 8). Student’s
t test: HFD WT vs. HFD Hp−/− *P < 0.05, **P < 0.01. Data are expressed as means ± SEM.
Microarray analysis was employed to better define the expression profile of HFD Hp−/− versus
HFD WT. Hierarchical clustering identified WT and Hp−/− as two distinct groups. 611 genes
were differentially expressed, of which 573 were up- and 38 down-regulated in the HFD Hp−/−
(Fig.15). Among them we chose to present those (Fig.15, right panel) more specifically related to
liver functions / pathology and displaying a fold change > 2. Real time PCR performed on 2
representative genes (Cell Death-Inducing DNA Fragmentation Factor alpha, CIDEα, and
Acetyl-Coenzyme A Carboxylase beta, ACACß) confirmed microarray results (Fig.15, bottom
panel) (Lisi S, Gamucci O et al., 2011).
FAS SREBP mtGPAT PEPCK G6Pase
0.0 0.2 0.4 0.6 0.8 1.0 1.2 1.4 HFD W T HFD
Hp-/-L
iv
e
r
re
la
ti
v
e
e
x
p
re
s
s
io
n
(a
rb
it
ra
ry
u
n
it
s
)
*
**
**
**
A
39 If we exclude renin, Glutathione S-transferases and Cytochrome P450 family CYP 41 (CYP41B)
the other 9 genes could be placed in 3 major functional groups including: i) genes related to
apoptosis that include members of the Serpin family (upregulated) and members of the CIDE
family (downregulated), the former being inhibitors and the latter inducers of apoptosis; ii) genes
implied in lipid metabolism (downregulated in HFD Hp−/−); iii) transcription factors Forkhead
box A2 (FOXA2) and Hepatocyte Nuclear Factor (HNF) 6, both associated to improved insulin
sensitivity (Wolfrum C et al., 2004; Wang M et al., 2008) when over-expressed (and both
40 Figure 15. Gene expression in the liver of Hp−/− mice. Microarray analysis of hepatic mRNA expression
in HFD WT and Hp−/− mice (n=4). Left: Hierarchic clustering of 611 genes differentially expressed in the
two genotypes. Right: Magnification showing 13 selected genes. Nine of them were grouped in functional categories according to their biological function: apoptosis (in blue), transcription factors (in red), and
lipid metabolism (in green).Bottom panel: Bar graph showing relative expression of ACACß and CIDEα
in the liver of HFD WT (open bars) and HFD Hp−/− (black bars) mice. N = 4. Student’s t-test *P<0.05.
Data are expressed as means ± SEM.
3.7 Adiponectin is increased in HFD Hp
−/−mice
Absence of Hp results in a more benign prognosis on the onset of obesity, because hepatomegaly
/ steatosis and insulin resistance are attenuated. For further insights into this matter, we searched
for systemic or local factors that might explain such phenotype.
Adiponectin is a key factor in determining insulin sensitivity (Berg AH et al., 2001), because its
plasma levels are inversely associated with glucose intolerance (Ryan AS et al., 2003; Winzer C
et al., 2004). Further, recent studies reported that hypoadiponectinemia enhances and adiponectin administration prevents steatohepatitis progression in mice (Fukushima J et al., 2009). We
investigated this parameter in our models. Although plasma adiponectin was similar in CFD WT
and CFD Hp−/− mice, HFD Hp−/− exhibited significantly higher levels of adiponectin compared
with HFD WT mice (Fig.16A). We also observed a significant increase of EPI WAT adiponectin
41 Figure 16.Hp affects adiponectin expression in vivo and in vitro. A: Plasma adiponectin levels in HFD
WT and Hp−/− mice (n = 15). Student’s t test: *P < 0.05. B: Relative expression of adiponectin in EPI
WAT of HFD WT and Hp−/− mice. Student’s t test: *P < 0.05. Data are expressed as means ± SEM.
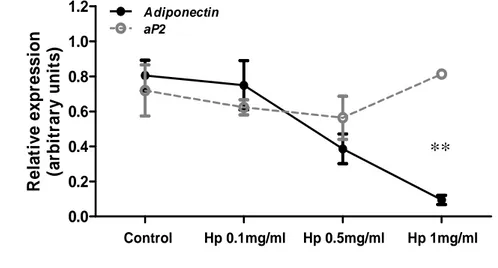
3.8 Effect of Hp on adiponectin expression in vitro
To investigate whether Hp plays a direct role on adiponectin expression, we performed in vitro
experiments using 3T3-L1 adipocytes and purified Hp. Treatment of terminally differentiated
adipocytes with Hp at different concentrations (0.1, 0.5, and 1 mg / mL) for 24 h resulted in a
dose-dependent decrease of adiponectin mRNA compared with control cells treated with BSA
(Fig.17A). To rule out the possibility that Hp was exerting an aspecific effect on the adipocyte
expression profile, we assessed the abundance of adipose fatty acid-binding protein-4 (aP2)
mRNA in the same samples. No relevant change was determined.
HFD WT HFD Hp-/-0 5 10 15 P la s m a a d ip o n e c ti n ( n g /m l)
*
HFD WT HFD Hp-/-0.0 0.2 0.4 0.6 0.8 A d ip o n e c ti n E P I W A T re la ti v e e x p re s s io n (a rb it ra ry u n it s )*
A
B
42 Figure 17.Hp affects adiponectin expression in vivo and in vitro. A: Adiponectin and aP2 relative gene expression in terminally differentiated 3T3-L1 adipocytes treated for 24 h with Hp as indicated. One-way ANOVA for adiponectin: P < 0.01. Bonferroni post hoc test: Hp 1 mg/mL vs. control **P < 0.01.
Hp effects on adiponectin mRNA abundance were paralleled by effects on adiponectin protein
concentration in the medium. After 24 h of treatment, Hp induced a significant dose-dependent
decrease of adiponectin (Fig.17B).
Figure 17. Hp affects adiponectin expression in vivo and in vitro. B: Adiponectin release after Hp treatment for 24 h (doses as indicated) in terminally differentiated 3T3-L1 adipocytes. One-way ANOVA:
Control Hp 0.1mg/ml Hp 0.5mg/ml Hp 1mg/ml 0.0 0.2 0.4 0.6 0.8 1.0 1.2 Adiponectin aP2 R e la ti v e e x p re s s io n (a rb it ra ry u n it s )
**
A
0 (control) 0.1 0.5 1.0 0 1000 2000 3000 4000 Hp concentration (mg/ml) A d ip o n e c ti n r e le a s e (n g /m l)*
B
43 P < 0.05. Bonferroni post hoc test: Hp 1 mg/mL vs. control *P < 0.05. Data are expressed as means ± SEM.
Of note, a downregulation of adiponectin mRNA abundance was observed also in primary
human adipocytes treated with Hp (Fig.17C). Taken together, these data indicate that Hp inhibits
adiponectin expression in vitro (Lisi S, Gamucci O et al., 2011).
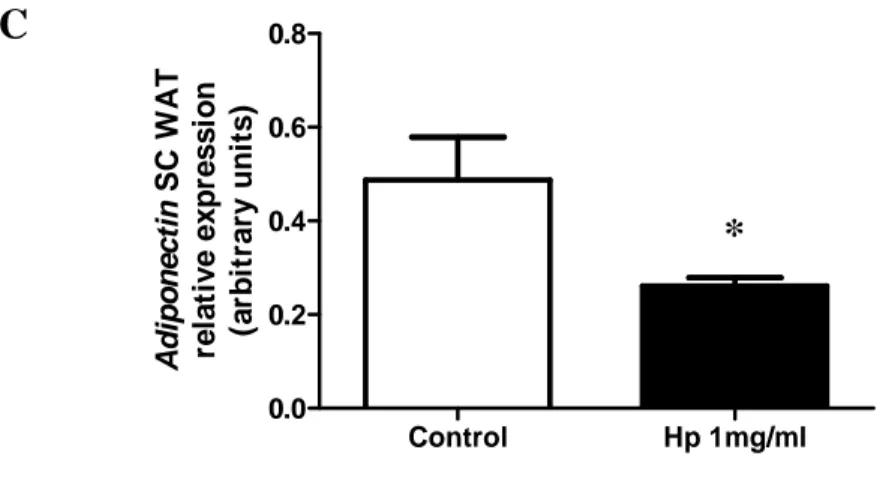
Figure 17.Hp affects adiponectin expression in vivo and in vitro. C: Relative expression of adiponectin in SC human adipocytes, treated or not (control) with Hp for 24 h. Student’s t test: *P < 0.05. Data are expressed as means ± SEM.
3.9 WAT macrophage content in Hp
−/−mice
Another important determinant of the risk to develop obesity-associated complications resides in
the WAT inflammatory status. Having previously proved that Hp acts as a chemoattractant in
vitro (Maffei M et al., 2009) and that it is released by murine WAT, we wanted to establish whether a deficiency of this glycoprotein could affect WAT macrophage infiltration in vivo.
Control Hp 1mg/ml 0.0 0.2 0.4 0.6 0.8 A d ip o n e c ti n S C W A T re la ti v e e x p re s s io n (a rb it ra ry u n it s )
*
C
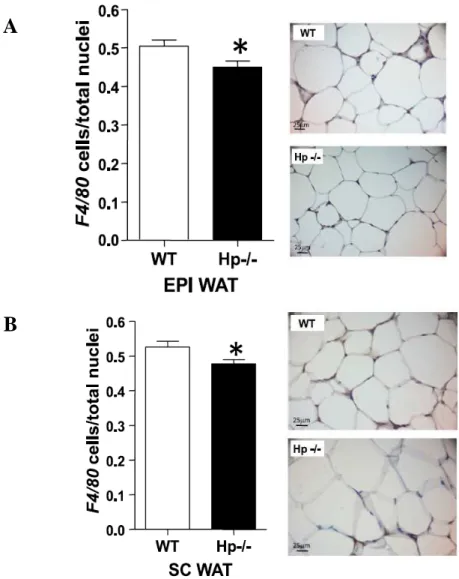
44 When HFD-treated mice were considered, a significantly lower macrophage infiltration was
found in both EPI and SC WAT of Hp−/− compared with WT, as assessed by
macrophage-specific surface protein F4/80 immunoreactivity (Figs.18A and B).
Figure 18. ATM content in HFD Hp−/− mice. Immunohistochemical detection of F4/80 in EPI WAT (A)
and SC WAT (B) of HFD WT and Hp−/− mice. Bar graphs indicating F4/80 stained cells/total nuclei in
EPI WAT (A) (n = 7, 15 fields per animal) and SC WAT (B) (n = 8, 15 fields per animal). F4/80 positive macrophages from each individual depot were counted using a 40× objective. The ratio of F4/80-positive cells was calculated as the number of F4/80 positive nuclei divided by the total number of nuclei in the same field. Student’s t test: * P< 0.05. Data are expressed as means± SEM.
A
45 The abundance of macrophage-specific mRNAs (F4/80 and CD68) consistently was lower in
EPI WAT of obese Hp−/− mice compared with weight-matched WT mice (Fig.18C). No
genotype-related difference was observed in the ATM content of CFD-treated mice (data not
shown) (Lisi S, Gamucci O et al., 2011).
Figure 18. ATM content in HFD Hp−/− mice. C: EPI WAT gene expression of CD68 and F4/80 in HFD
WT and Hp−/− mice. Student’s t test: *P < 0.05. Data are expressed as means ± SEM.
These results are consistent with a role of Hp in contributing to WAT macrophage infiltration
and consequent onset of altered inflammatory status at this site.
3.10 Adipocyte size in the obese Hp
−/−mouse
A positive relationship between adipocytes size and insulin resistance has been reported (Roberts
R et al., 2009). Given the better preserved glucose and insulin homeostasis presented by the
CD68 F4/80 0.0 0.2 0.4 0.6 0.8 1.0 W T
Hp-/-E
P
I
W
A
T
re
la
ti
v
e
e
x
p
re
s
s
io
n
(a
rb
it
ra
ry
u
n
it
s
)
*
C
46 Hp−/− model upon obesity, we wanted to further investigate this issue. As shown in figure 19A,
the average adipocyte size of SC WAT of Hp−/− HFD treated animals was significantly smaller
than that found in HFD WT mice. The Hp−/− EPI WAT exhibited similar features, albeit with
less pronounced differences. Consistently DNA content, an indirect assessment of adipocyte
number, was higher (albeit not significantly) in both SC and EPI WAT from Hp−/− mice as
compared to WT (Fig.19B).
Figure 19. WAT histomorphology in the obese Hp−/− mouse. A: Left panel, bar graph showing the mean
adipocyte area (µm2) in the SC and EPI WAT of HFD WT and HFD Hp−/− mice (n=4 for both genotypes
and tissues). Right panel, representative histological sections of SC and EPI WAT of HFD WT and HFD
Hp−/− mice. Mean weight of fat depots was 1.48±0.31 and 1.59±0.17 g for WT and Hp−/− respectively for
SC WAT and 1.67±0.99 and 1.65±0.69 for WT and Hp−/− respectively for EPI WAT. B: Bar graph
showing DNA content in the SC and EPI WAT of HFD WT and HFD Hp−/− mice (n=5 for both genotypes
and tissues). Data are expressed as means±SEM. For pair comparisons in A, Student’s t test, ** P <0.01,
*** P<0.001.
Analysis of distribution of adipocyte size in SC WAT of obese animals indicated that Hp
deficiency was associated with a higher number of small-sized adipocytes and a lower number of
47 large-sized adipocytes as compared to WT (Fig.19C) (Gamucci O et al., 2012).
Figure 19. WAT histomorphology in the obese Hp−/− mouse. C: Morphometric analysis of adipocyte cell
size distribution (based on a total of about 2000 cells/genotype) of SC WAT in HFD WT and HFD Hp−/−
mice (n=4 for each genotype). Adipocyte areas are binned according to the genotype (each bin = 300
µm2) and data are expressed as % of cells per bin. Black rectangles indicate bins in which the
comparison between genotypes is significant (chi-square test, P<0.05).
Taken together these data indicate that, despite no difference in body weight and percentage of
fat, obese Hp deficient mice show a reduced adipocyte size.
3.11 Adipocyte size in the lean Hp
−/−mouse: comparison with the obese
Differently from what found upon HFD, neither systemic metabolism, nor local inflammatory
profile of WAT diverged in the lean Hp−/− mouse with respect to the WT, suggesting that Hp role
48 in metabolism and adipose tissue is evidenced in the presence of a metabolic challenge. In the
effort to understand if signs of the adipocyte related changes encountered in the HFD Hp−/− mice
were somewhat anticipated under normal conditions we analyzed WAT of lean animals.
Histological examination of WAT surprisingly revealed a larger adipocyte size of Hp−/− mice in
both SC and EPI WAT (Fig.20A), as opposed to what found in obese mice. In this case DNA
content was lower (albeit not significantly) in both SC and EPI WAT from Hp−/− mice as
compared to WT (Fig.20B).
Figure 20. WAT histomorphology in the lean Hp−/− mouse: comparison with the obese. A: Left
panel, bar graph showing the mean adipocyte area (µm2) in the SC and EPI WAT of CFD WT and CFD Hp−/− mice (n=4 for both genotypes and tissues). Right panel, representative histological sections of SC and EPI WAT of CFD WT and CFD Hp−/− mice. Mean weight of these fat depots was 0.14
±
0.03 and 0.16±
0.04 g for WT and Hp−/− respectively for SC WAT and 1.67±
0.99 and 1.65±
0.69 for WT and Hp−/− respectively for EPI WAT. B: Bar graph showing DNA content in the SC and EPI WAT of CFD WT and HFD Hp−/− mice (n=5 for both genotypes and tissues). Data are expressed as means±SEM. For pair comparisons in A, Student’s t test, ** P<0.01, *** P<0.001.B
A
49 Consistently, adipocyte size distribution (represented in figure 20C for SC WAT) of CFD Hp−/−
revealed a decreased number of relatively small / medium-sized adipocytes and an increased
number of larger adipocytes (Gamucci O et al., 2012).
Figure 20. WAT histomorphology in the lean Hp−/− mouse: comparison with the obese. C: Morphometric analysis of adipocyte cell size distribution (based on a total of about 2000 cells/genotype)
of SC WAT in CFD WT and CFD Hp−/− mice (n=4 for each genotype). Adipocyte areas are binned
according to the genotype (each bin = 300 µm2) and data are expressed as % of cells per bin. Black
rectangles indicate bins in which the comparison between genotypes) is significant (chi-square test, P<0.05).
The opposite trend in adipocyte size shown by obese and lean Hp−/− mice was unexpected and is
suggestive of a diet effect acting differently in the WT and Hp−/− model. Indeed, when the diet
effect (CFD-HFD) is plotted intra-genotype (Fig.20D) a less pronounced enlargement of the bell
shaped curve (black bars) describing the adipocyte size distribution can be noticed for HFD
Hp−/− as compared to HFD WT mice, indicating a reduced fluctuation of size in the former.
While a good extent of overlapping is in fact present in the distribution of adipocyte size
50 between lean and obese Hp−/− mice, diet change determines an almost complete separation of the
distributions in the WT mouse.
Figure 20. WAT intra-diet comparison between WT and Hp−/− mice. D. Intra-diet morphometric analysis of adipocyte cell size distribution (based on a total of about 2000 cells/genotype) of SC WAT in
WT (D, upper panel) and Hp−/− (D, bottom panel) CFD and HFD mice (n=4 for each genotype).
Adipocyte areas are binned according to the diet (each bin = 300 µm2) and data are expressed as % of
cells per bin for both diet regimens. Black rectangles indicate bins in which the comparison between diet regimens is significant (chi-square test, P<0.05).
51
3.12 Hp deficiency and WAT gene expression
To investigate the molecular mechanisms underlying the herein observed phenotypic differences
and to get further insights into the role of Hp in WAT, the expression of genes relevant for
adipocyte size and terminal differentiation was investigated.
The size of individual adipocytes is mainly defined by triglyceride (TG) content and by the size
of the lipid droplet (LD) that is hydrolyzed during lipolysis to glycerol and fatty acids (Arner P
et al., 2005). To investigate the molecular mechanisms underlying size-related phenotypic difference, we monitored the expression of Perilipin and Hormone sensitive lipase (HSL), two
key regulators of TG hydrolysis (Mottagui-Tabar S et al., 2003; Ray H et al., 2009). A modest
downregulation of perilipin and HSL was observed in the SC WAT of CFD Hp−/− mice as
compared to controls (Fig.21A). In the EPI, but not in the SC, WAT of HFD Hp−/− smaller size
of adipocytes was accompanied by a significantly increased expression of HSL and a trend
toward increase of Perilipin (Fig.21B).
52 Genes defining mature adipocytes like Fatty Acid Synthase (FAS), Lipoprotein Lipase (LPL),
Adipose Fatty Acid Binding Protein-4 (FABP-4/aP2) and Peroxisome proliferator-activated
receptor gamma (PPARγ) were also analyzed. A significantly lower expression of LPL, aP2,
PPARγ was found in the SC WAT of CFD Hp−/− mice (Fig.21C) as compared to CFD WT. No genotype related differences were found in HFD mice (Fig.21D).
B
53 Differences in adipocyte size may be accompanied by differences in proliferation rate of
progenitor cells (pre-adipocytes). To address this issue we monitored the expression of
proliferation (c-Myc, c-Fos, c-Jun) and antiproliferative (Jun B) markers. In CFD mice we found
only a modest difference for c-Myc and Jun B (not significant), respectively down- and
up-regulated in the Hp−/− SC WAT (Fig.21E). No genotype related significant differences were
found in the obese mice with the exception of c-Fos, that was upregulated in the SC WAT of
HFD Hp−/− mice as compared to HFD WT (Fig. 21F) (Gamucci O et al., 2012).
D
54 Figure 21. WAT gene expression upon Hp deficiency. Relative expression of Perilipin and HSL in WAT of CFD (A) and HFD (B) mice. Relative expression of FAS, LPL, aP2 and PPARγ in WAT of CFD (C) and HFD (D) mice. Relative expression of c-Myc, c-Fos, c-Jun and Jun B in WAT of CFD (E) and HFD (F) mice. In left and right panels data relative to SC and EPI WAT are shown respectively. Data are
expressed as means±SEM, n=4 for each group (i.e. SC CFD WT, SC CFD Hp−/− etc). Pair comparisons,
Student’s t test, *P<0.05, *** P<0.001.
Taken together these data suggest that Hp deficiency affects WAT gene expression in a different
manner in lean and obese mice. In the former the most evident effect is a decreased abundance of
terminal differentiation markers, while in the latter an increased activation of the lipolysis
machinery and an upregulation of adipogenesis related genes appear as the most relevant effects.
3.13 Hp and adipogenesis
Given the widely accepted concept that adipogenesis may contribute to the enlargement of
adipose mass during obesity, we asked whether a different capacity to undergo de novo adipose
conversion may contribute to account for the different WAT histological phenotype seen in HFD
55 WT and HFD Hp−/− mice. As previously reported by others, Hp mRNA increases during adipose
conversion (Kratchmarova I et al., 2002). To further investigate if this adipogenesis dependent
regulation has functional implications, we isolated mouse embryonic fibroblasts (MEFs) from
Hp−/− and WT mice. No genotype dependent difference in proliferation rate, as assessed by BrdU
incorporation assay, was evidenced (data not shown). When cells were treated with an
adipogenic differentiation cocktail, Hp−/− MEFs showed a diminished capability to undergo
adipogenesis as compared to MEFs from controls. This was revealed by less intense Oil Red O
staining (Fig.22A) and by significantly lower triglyceride content in Hp−/− MEFs as compared to
WT MEFs (Fig.22B) (Gamucci O et al., 2012).
Figure 22. MEFs from Hp−/− mice show a diminished capability to undergo adipogenesis. A: Oil Red O staining (upper panels) and representative images of cells (40X magnification, lower panels) in WT and
Hp−/− MEFs at terminal differentiation (day 10). B: Triglyceride content measurement in WT and Hp−/−
MEFs at terminal differentiation (day 10). Data are expressed as means ±SEM. For pair comparisons in
B, Student’s t test *** P<0.001.
56 These results were confirmed by the significantly lower expression of terminal differentiation
markers in Hp−/− as compared to WT MEFs (Fig.22C). The expression of Leptin, FAS, LPL, aP2
in Hp−/− MEFs at day 10 Post Cocktail Induction (PCI) was respectively 47, 41, 68 and 38% that
of WT MEFs. Interestingly, a significant difference in the expression of genes that orchestrate
adipogenesis, including PPARγ and CCAAT/enhancer binding protein alpha (C/EBPα), was
already evident at earlier time points of the differentiation process. As evidenced in figure 22D
(left panel), Hp−/− MEFs showed a lower PPARγ expression at various time points PCI. C/EBPα
showed a similar trend (Fig.22D, right panel), even if it was statistically significant only at day 4.
C
57 Figure 22. MEFs from Hp−/− mice show a diminished capability to undergo adipogenesis. C: Leptin,
FAS, LPL and aP2 relative expression at terminal differentiation (day 10) in WT and Hp−/− MEFs.
PPARγ (D, left panel) and CEBPα (D, right panel) relative expression during adipose conversion in WT
and Hp−/− MEFs. PPARγ: 2-way ANOVA, genotype effect P<0.0001, time effect P<0.0001, interaction
P<0.05. Bonferroni post-hoc tests: WT vs Hp−/− * P<0.05, ** P<0.01. CEBPα: 2-way ANOVA, genotype
effect P<0.001, time effect P<0.0001. Bonferroni post-hoc test: WT vs Hp−/− * P<0.05. Data are
expressed as means ±SEM. For pair comparisons in C Student’s t test, * P<0.05, ** P<0.01.
These results indicate that MEFs from Hp−/− mice are less prone to undergo adipose conversion