57 CHAPTER 5
The gold(III)-PADA system in DTAC
In this chapter are described the spectroscopic and kinetic behaviours of the gold(III)-PADA system in the presence of DTAC micelles.
5.1 Dependence of the reaction rate on the surfactant concentration
As outlined in Chapter 1, DTAC in aqueous solution is able to form spherical, positively charged, micelles, provided that its concentration exceeds the value of 1.0×10⁻² M corresponding to the CMC of the surfactant (Ghezzi, 2008). Since
the gold(III) chlorocomplexes present in the range of acidity and chloride concentrations employed, are negatively charged, it occurs that the Au(III) chloro-complexes will be electrostatically attracted by the DTAC micelles, while the PADA molecules that diffuse towards the micelle surface will be retained on it by hydrophobic forces. In such circumstances, each micelle will constitute a nano-reactor where the binding of PADA to Au(III) will proceed at an enhanced rate, owing to the increased concentrations of the reactants on the micelle surface. The catalytic effect exerted by the DTAC micelles on the gold(III)-PADA system is clearly shown in Figure 5.8, which shows that the specific rate of reaction experiences a sudden increase on changing from a pure water solution to a solution containing 0.01 M DTAC. The rate then decreases asymptotically as the micelle concentration rises because of the dilution of the reaction sites and because the surface potential decreases with the ionic strength that unavoidably augments as the surfactant concentration increases.
5.2 Spectral observations
The presence of the DTAC micelles in solution containing PADA induces significant spectral changes, as shows the comparison between the spectra of
58 300 400 500 600 700 0 .0 0 .2 0 .4 0 .6 0 .8 1 .0 1 .2 1 .4 A b s W avelen gth (nm ) A
Figure 5.1A and 5.1B. The reason of the spectral change can be found in the fact that, owing to repulsion of protons by the positive micelle, the pH in the DTAC surface is higher compared to the pH in water; so, at the measured pH of 5.0 and [DTAC] = 0.02 M, PADA present on the micelle surface is deprotonated (Chapter 3, Table 3.3), whereas in water is monoprotonated (Chapter 3, Table 3.2).
Figure 5.1 Spectra recorded on adding increasing amounts of PADA to water (A) and to an aqueous solution containing 0.04 M DTAC (B); pH = 5.0, T = 25 °C.
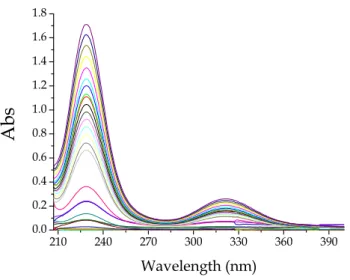
Figure 5.2 shows the spectra of different amounts of AuCl4− recorded in the
presence of DTAC. 210 240 270 300 330 360 390 0.0 0.2 0.4 0.6 0.8 1.0 1.2 1.4 1.6 1.8
A
b
s
Wavelength (nm)Figure 5.2 The spectra of gold(III) up to 6.6×10⁻⁵ M in 0.04 M DTAC, pH = 5.00,
T = 25 °C. 200 300 400 500 600 0.0 0.2 0.4 0.6 0.8 1.0 1.2 1.4 A b s W avelength(nm ) B
59
The interaction of Au with PADA in DTAC was studied at pH 4.2 recording the spectral change of PADA occurring by additions of gold(III) directly in the spectrophotometric cell (Figure 5.3). The occurrence of a binding reaction is revealed by the increase of absorbance as gold(III) is added, at wavelengths higher than 400 nm, where gold(III) chlorocomplexes do not absorb, and by the concomitant red-shift.
An attempt has been made to investigate the complex formation equilibria by spectrophotometric titrations under conditions of metal excess (CAu >> CPADA)
at the wavelength of the maximum absorbance (497 nm). The resulting titration curve (Figure 5.4) shows clearly that the extent of complex formation is very high, making it impossible to obtain a reliable value of the equilibrium constant. The only information provided by the titrations is the reaction stoichiometry which, from the intersection of straight lines results to be 1:1.
200 300 400 500 600 700 0.0 0.2 0.4 0.6 0.8 A b s Wavelength (nm)
Figure 5.3 Spectral change of PADA during titration with gold(III) in the presence of DTAC. CPADA = 4×10⁻⁶M, [DTAC] = 0.01 M, pH = 4.2, T = 25 °C.
60 0 1 2 3 4 5 6 7 8 9 10 0 5000 10000 15000 20000 25000 30000 35000 ∆ A / C L 105 x [Au] (M)
Figure 5.4 Binding curve obtained for the gold(III)-PADA system in 0.03M DTAC.
CPADA = 3×10⁻⁶ M, [DTAC] = 0.03 M, pH = 4.2,
λ = 497 nm, T = 25 °C. The
intersection of the straight lines occurs for CAu = 3×10⁻⁶ M, indicating that the
stoichiometry of the complex is 1:1.
5.3 Kinetic studies in DTAC
The kinetics of the complexation mechanism of the gold(III)-PADA system in DTAC have been investigated with the same procedure used for measurements in water. The experiments were performed under pseudo first-order conditions, using a metal excess. Preliminary experiments have shown that the kinetic behaviour is biphasic, hence the slow phase has been investigated by the spectrophotometric method and the fast phase by the stopped-flow technique.
5.3.1 Kinetics of the slow effect
Figure 5.5 shows a typical kinetic trace recorded by the spectrophotometric technique at 633 nm. The curve is fitted nicely by a single exponent function. The time constants of the gold(III)-PADA system depend linearly on the total gold concentration as shown in Figure 5.6. Moreover, the same graph shows how 1/τs depends on the chloride concentration.
61 0 200 400 600 800 1000 0.00 0.04 0.08 0.12 0.16 0.20 A b s Time (sec)
Figure 5.5 Time course of the binding reaction between gold(III) and PADA in 0.02 M DTAC at pH = 6.0; CAu = 5×10⁻⁴ M, CPADA = 5×10⁻⁶ M,[NaCl ] = 0.10 M, λ = 633
nm, T = 25°C. 0 1 2 3 4 5 0.004 0.008 0.012 0.016 0.10 M N aC l 0.15 M N aC l 0.20 M N aC l 0.25 M N aC l 1/ τ s
(
s -1)
104 CA u (M )Figure 5.6 Dependence of the spectrophotometric slow time constant, 1/τs, vs Au(III)
concentration for the gold(III)-PADA system in 0.02 M DTAC. The plots differ for Cl− concentration. CPADA = 5×10⁻⁶ M, pH = 6.0, λ = 633 nm, T = 25°C.
The slope of the plot includes the rate parameters of the forward step, kf, of the
binding reaction. On the other hand the intercepts, which should include the rate parameters of the reverse step, kd, are definitely higher than zero. This
62
will be demonstrated below. Figure 5.6 also shows that kd exhibits an increase
on raising the Cl− concentration. This fact demonstrates that the binding of PADA to Au(III) involves expulsion of chloride ions from the chlorocomplexes.
Catalysis by DTAC Table 5.1 shows the values of slope and intercepts (kf and kd)
obtained from plots as that of Figure 5.6 for different concentrations of DTAC.
Table 5.1. Rate constants values for the gold(III)-PADA complex formation and dissociation reaction obtained at different DTAC concentrations; CAu = 5×10⁻⁵ ÷
5×10⁻⁴ M, C PADA = 5×10⁻⁶ M, pH = 4.2, [NaCl] = 0 M, T = 25°C. [DTAC] (M) kf (M−1 s−1) 104 kd (s−1) 0 72 0.20 0.005 605 0.33 0.01 1121 0.26 0.02 186 160 0.03 44 25 0.05 110 140 0.06 86 80
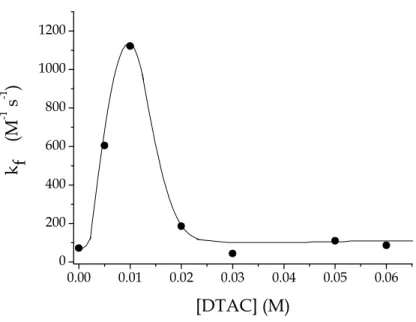
The Table shows that addition of an amount of DTAC corresponding to the surfactant CMC (0.01 M) exerts a catalytic effect on the binding reaction corresponding to a rate enhancement by a factor of 15.6 with respect to the rate in water. The catalytic effect refers to the forward reaction. In order to provide a pictorial representation of this effect the values of kf are used to make the plot
showing the catalytic effect induced by DTAC (Figure 5.7). The shape of the curve corresponds to that of curve (a) of the plot shown Figure 1.5 of Chapter 1.
63 0.00 0.01 0.02 0.03 0.04 0.05 0.06 0 200 400 600 800 1000 1200 k f (M -1 s -1 ) [DTAC] (M)
Figure 5.7 Dependence of the values of the rate of complex formation, kf, for the
gold(III)-PADA system on the DTAC concentration. CPADA = 5×10⁻⁶ M, CAu =
5×10⁻⁵÷ 5×10⁻⁴M, pH = 4.2, [NaCl] = 0 M, T = 25°C.
An effect of DTAC on the reverse step can be observed on kd value starting
from [DTAC] ≥ 0.02 M. For lower surfactant concentrations the micelles are not yet formed and the reverse reaction occurs at the same rate as in water. The increase of kd at relatively high DTAC levels is also due to the catalysis of the
bimolecular reverse step which involves the encounter of the Au-PADA complex with Cl−. The reduction of kd between 0.03 and 0.06 M DTAC is to be
ascribed to the site dilution effect.
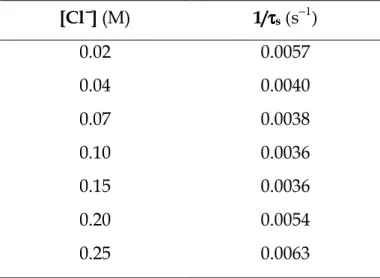
Rate dependence on the chloride ion concentration Sets of experiments as those represented in Figure 5.6 have been performed at different concentration of sodium chloride. For each concentration of Cl− ion the corresponding values of 1/τs have been evaluated. The data obtained are reported in Table 5.2.
64
Table 5.2 Reciprocal time constants, 1/τs, evaluated at different chloride ion
concentration for the slow effect observed for the gold(III)-PADA system in 0.02 M DTAC. CAu = 8×10⁻⁵ M, CPADA = 5×10⁻⁶ M, pH = 6.0, T = 25°C. [Cl−−−−] (M) 1/ττττs (s−1) 0.02 0.0057 0.04 0.0040 0.07 0.0038 0.10 0.0036 0.15 0.0036 0.20 0.0054 0.25 0.0063
The graphical representation of all sets of experiments (Figure 5.8) indicates that the binding mode is not a simple one. Actually, the plot shows that reaction paths inversely proportional and reaction paths directly proportional to [Cl−] are simultaneously operative.
Figure 5.8 Dependence of the reciprocal time constant, 1/τs, on [Cl−-] for the slow effect
displayed by the gold(III)-PADA system in 0.02M DTAC. The plots differ for the Au(III) concentration. CPADA = 5×10⁻⁶ M, pH = 6.0, T = 25°C.
0.00 0.05 0.10 0.15 0.20 0.25 0.004 0.008 0.012 0.016 0.020 5x10⁻⁵ M Au 8x10⁻⁵ M Au 1x10⁻⁴ M Au 2x10⁻⁴ M Au 3x10⁻⁴ M Au 4x10⁻⁴ M Au 5x10⁻⁴ M Au 1/ τ s (s -1 ) [Cl-] (M)
65
The reaction path inversely proportional to [Cl−] belongs for sure to the forward step, as observed for the reaction in water (Chapter 4). On the other hand, the portion of the plot increasing with [Cl−] can include paths belonging to both the direct and the reverse steps.
In order to rationalize the dependence of the reaction on chloride concentration, the dependence of kf and kd on [Cl−] was investigated. The results are reported
in Table 5.3
Table 5.3 Dependence of kf and kd on [Cl−] for the gold(III)-PADA system in 0.02 M
DTAC; pH = 6.0, T = 25°C. . [Cl−−−−] (M) kf (M−1 s−1) 104kd (s−1) 0.02 30 ± 1 18 ± 3 0.04 37 ± 1 11 ± 2 0.10 23 ± 1 19 ± 2 0.15 16 ± 1 33 ± 2 0.20 14 ± 1 55 ± 1 0.25 16 ± 1 77 ± 1
Table 5.3 shows that, in the presence of DTAC micelles, the values of kd are
much larger than in aqueous solution and, more important, they display a well defined monotonic increase as the chloride level is raised. This observation strongly suggests that in DTAC the contribution of the reverse step could not be disregarded. For instance, for CAu = 2×10⁻⁴ M and [Cl−] = 0.02 M is obtained
kf CAu = 6.0×10⁻³ s−1, which has to be compared with kd = 1.8×10⁻³ s−1. On the
basis of equation 4.2 it results that the reverse step gives a contribution of 23% to the value of 1/τs.
The same calculation applied to [Cl−] = 0.2 M yields a contribution of the reverse reaction to 1/τs of 66%. The trends displayed by kf and kd are shown in
66 0.00 0.05 0.10 0.15 0.20 0.25 10 15 20 25 30 35 40 kf ( M -1 s -1) [Cl-] (M)
Figure 5.9 Dependence of the values of the rate of complex formation constant, kf, for
the gold(III)-PADA system on the Cl−concentration. CAu = 5×10⁻⁵÷ 5×10⁻⁴ M, CPADA
= 5×10⁻⁶ M, [DTAC] = 0.02 M, pH = 6.0, T = 25 °C. 0.00 0.05 0.10 0.15 0.20 0.25 0.002 0.004 0.006 0.008 kd ( s -1) [Cl-] (M)
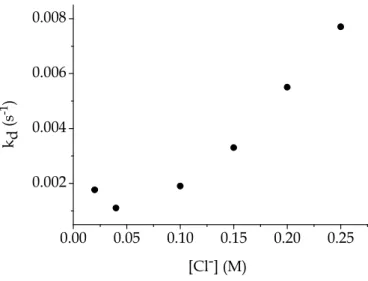
Figure 5.10 Dependence of the values of the rate of complex dissociation constant, kd,
for the gold(III)-PADA system on the Cl− concentration. CAu = 5×10−-5÷ 5×10⁻⁴ M,
CPADA = 5×10⁻⁶ M, [DTAC] = 0.02 M, pH = 6.0, T = 25 °C.
Rate dependence on the hydrogen ion concentration Since gold(III) chlorocomplexes are known to undergo hydrolysis processes, the dependence of the binding reaction on the hydrogen ion concentration has been investigated by executing several series of experiments that are summarized in the plot of Figure 5.11,
67
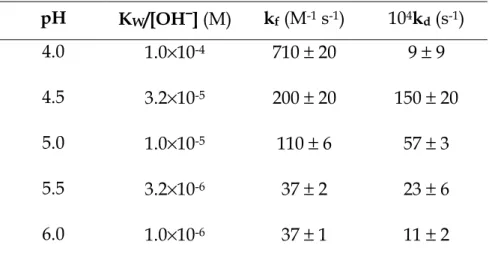
each series being characterized by a distinct pH value. The values of kf and kd
obtained for each pH value are reported in Table 5.4.
Table 5.4 Forward and reverse rate constants for the slow effect observed in the gold(III)-PADA system at different hydrogen ion concentrations in 0.02 M DTAC. [NaCl] = 0.04 M, T = 25°C. pH KW/[OH−−−−] (M) kf (M-1 s-1) 104kd (s-1) 4.0 1.0×10⁻⁴ 710 ± 20 9 ± 9 4.5 3.2×10⁻⁵ 200 ± 20 150 ± 20 5.0 1.0×10⁻⁵ 110 ± 6 57 ± 3 5.5 3.2×10⁻⁶ 37 ± 2 23 ± 6 6.0 1.0×10⁻⁶ 37 ± 1 11 ± 2
Figure 5.11 Dependence of the time constant, 1/τs,vs Au(III) concentration for the slow
effect of the gold(III)-PADA system in 0.02 M DTAC. The plots differ for the H+
concentration. CPADA = 1.5×10⁻⁶ ÷ 5×10⁻⁶ M, [NaCl] = 0.04 M, λ = 633 nm, T = 25°C.
0 1 2 3 4 5 0.00 0.04 0.08 0.12 pH 6.0 pH 5.5 pH 5.0 pH 4.5 pH 4.0 1/ τ s ( s -1 ) 104 CAu (M)
68
The reaction scheme The positive surface of DTAC in the presence of [Cl−] ions will favour the presence of gold(III) species rich of chloride as Au(OH)Cl3− or
even AuCl4− in the pH range between 4 and 7, whereas within this pH range in
the absence of DTAC the aqueous solution is populated mainly by Au(OH)2Cl2−
and Au(OH)3Cl− (Baes and Mesemer, 1976).
However, the decrease of the kd on increasing the solution pH (which
corresponds to increasing [OH−]) shown in Table 5.4 is significant (if one considers the small errors effecting such a parameter) and can be explained only considering that the species reacting with PADA are Au(OH)Cl3− and
Au(OH)2Cl2− The reaction scheme (5.1)-(5.4) that accounts for the rate
dependence on CAu, [Cl−] and [OH−] (or [H+]) is given below
(5.1)
(5.2)
(5.3)
(5.4)
where reactions (5.3) and (5.4) are fast equilibria. The relationship showing the dependence of 1/τs on the reactant concentrations has been derived in the
Appendix III and is given by equation 5.5
] Cl [ ı K ] OH [ ] OH [ 2 ] Cl [ 2 k ] OH [ ] Cl [ ' K 1 k Au C ] Cl [ K ] OH [ ] OH [ 2 k ] Cl [ K ] OH [ ] Cl [ 1 s 1 k K − + − − − − + − − − + − + − − + − + − − = τ (5.5)
Equation (5.5) explains the linear dependence of 1/τs on CAu at constant values
of [Cl−] and [OH−]. Moreover, equation (5.5) provides a rational explanation of
Au(OH)Cl3−+ L L AuOHCl+ L L k1 k-1 + 2Cl − Au(OH)2Cl2−+L L Au(OH)2+ L L k2 k-2 + 2Cl− Au(OH)2Cl2− + Cl− K Au(OH)Cl3− + OH− Au(OH)2+ L L K' + OH− Au(OH)Cl+ L L + Cl−
69
the complex dependence of 1/τson the chloride concentration. Looking at the
first term within brackets of equation (5.5) one observes that, at low [Cl−] values (when K[Cl−]<[OH−]), the term k1K[Cl−]/[OH−] is prevailing, so 1/τs increases
with [Cl−]. For intermediate values of [Cl−] the opposite is true, i.e. K[Cl−]>[OH−]. Under these circumstances, the term k2/K[Cl−] will prevail and
1/τs will decrease on raising the chloride level. Finally, at the highest Cl−
concentrations, the contribution of the reverse reaction will prevail. Assuming that K’[Cl−] < [OH−], the term representing the reverse step (which corresponds to the second term in brackets) will take the form kd = ((k-1 K′/[OH−])+k−2)[Cl−]2.
According to the expression of kd, the value of 1/τs will increase parabolically
with [Cl−] as shown by Figure 5.10.
Equation 5.5 also explains the pH dependence of the values of kf, which
corresponds to the first term in parenthesis. For K[Cl−] < [OH−], kf assumes the
form kf =((k1K[Cl−])/[OH−])+k2. This equation explains the descending trend
displayed by kf with pH (Table 5.4). Concerning the reverse step, under the
conditions K[Cl−]<<[OH−], the expression for kd will read
kd =((k-1K′/[OH−])+k2)[Cl−]2, which yields an explanation to the observed
decrease of kd with increasing pH (Table 5.4). Note that, among the various
reaction schemes tested, only the scheme 5.1-5.4 yields the observed dependence of kd on [OH−].
5.3.2 Kinetics of the fast effect
The reaction of PADA binding to gold(III) can be observed also in acid solution (0.001 M ≤ [H+] ≤ 0.20 M). Under these conditions the kinetics are fast and one
has to resort to the stopped-flow technique. Figure 5.12 shows a kinetic curve of the fast effect observed for the binding of PADA to gold(III) in 0.02 M DTAC. Note that the noise is rather large owing to the fact that the stopped-flow apparatus should monitor a fast process which requires a very short rise time, so that the signal can be only partially smoothed.
70 0.00 0.01 0.02 0.03 0.04 0.05 0.05 0.10 0.15 0.20 S ig n al ( V ) Time (sec)
Figure 5.12 Time course of the fast binding reaction of PADA to gold(III) in 0.02 M DTAC monitored by the stopped-flow method. CAu = 5×10⁻⁴ M, CPADA = 5×10⁻⁶ M
[H+] = 0.001 M, [NaCl] = 0.04 M, λ = 633 nm, T = 25°C.
The reaction is first-order with respect to gold(III), as revealed by the linear dependence of the reciprocal time constant on the total Au(III) concentration shown in Figure 5.13. An equilibrium situation is reached, as revealed by the positive intercept of the plot.
Figure 5.13 Plot of the reciprocal time constant, 1/τf, vs gold(III) concentration for the
fast effect of the gold(III)-PADA system in 0.02 M DTAC. CAu = 5×10⁻⁵÷5×10⁻⁴ M,
CPADA = 5× 10⁻⁶ M, [NaCl] = 0.04 M, pH = 3.0, T = 25 °C. 0 1 2 3 4 5 100 120 140 160 180 200 1/ τ f (s -1 ) 104 CAu (M)
71 Rate dependence on the chloride ion concentration Table 5.5 reports the values of the reciprocal time constant of the fast effect for different concentrations of chloride ions.
Table 5.5 Reciprocal fast time constants, 1/τf, measured at different chloride ion
concentrations for the gold(III)-PADA system in 0.02 M DTAC at pH = 2.0, CAu =
7×10⁻⁵ M, C PADA = 5×10⁻⁶ M T = 25°C. [Cl−−−−] (M) 1/ττττf ((((s−1) 0.02 187 0.04 182 0.07 178 0.1 177 0.15 176 0.20 165 0.25 169
The reaction rate decreases on raising the chloride content and the trend is better observable looking at the plot of Figure 5.14.
Figure 5.14 Dependence of the fast rate constant, 1/τf, on chloride ion concentration for
the gold(III)-PADA system in DTAC 0.02 M. CAu = 7×10⁻⁵ M, CPADA = 5×10⁻⁶ M, pH
= 2.0, T = 25°C. 0.00 0.05 0.10 0.15 0.20 0.25 0.30 160 165 170 175 180 185 190 1/ τ f ( s -1 ) [Cl-] (M)
72
The behaviour shown in Figure 5.14 indicates the presence of a fast equilibrium between two Au(III) complexes, most probably AuCl4− and Au(H2O)Cl3, the
latter being the more reactive towards PADA. This view will be confirmed by the dependence of the rate on the hydrogen ion concentration which will be analyzed below.
Rate dependence on the hydrogen ion concentration The dependence of the reaction rate of the fast effect on the hydrogen ion concentration is shown in Table 5.6. The time constant 1/τf displays a maximum value at [H+]= 0.1 M.
Table 5.6 Average time constant values for the fast effect of gold(III)-PADA system in 0.02 M DTAC at different hydrogen ion concentration. CAu = 7×10⁻⁵ M, CPADA =
5×10⁻⁶ M, [NaCl] = 0.04 M, T = 25°C.
Figure 5.15 provides a more direct representation of the behaviour exibited by the reacting system on changing the pH of the medium.
KW/[OH−−−−] (M) 1/ττττf (s-1) 0.001 130 0.005 125 0.007 160 0.01 182 0.05 191 0.1 196 0.15 168 0.15 143
73 0.00 0.05 0.10 0.15 0.20 80 100 120 140 160 180 200 220 1 / τf (s -1 ) KW/[OH−] (M)
Figure 5.15 Time constant values, 1/τf, at different hydrogen ion concentrations for the
fast effect observed in the gold(III)-PADA system in 0.02 M DTAC. CAu = 7×10⁻⁵ M,
CPADA = 5×10⁻⁶ M, [NaCl] = 0.04 M, T = 25°C.
The kind of dependence of the reaction rate on the hydrogen ion concentration is of paramount importance for the assignment of the reaction scheme. Actually, if the main species AuCl4−(unreactive or scarcely reactive) would had
been in equilibrium with the reactive hydroxilated species Au(OH)Cl3−, as it
occurs in the pH range between 4 and 6, a monotonically decreasing trend (similar to that displayed by the rate dependence on [Cl−]) would be observed. The fact that the rate does not decrease, indicates that no protons (or OH−) are directly involved in the reaction. This fact confirms that the reactive species is AuCl3(H2O) and not Au(OH)Cl3−. This conclusion is logical because, in the pH
region where the fast effect manifests itself (pH ≤ 2), the species AuCl3(H2O) is
likely to prevail over Au(OH)Cl3−, even on the positively charged surface of
DTAC.
The curve maximum represented in Figure 5.15 can be explained assuming that the reactive species of the ligand is HL+. Actually, at low pH, the totally
deprotonated species L is present at negligible concentration, while the fully protonated species H2L2+, although present in remarkable amounts, is repelled
74
despite the positive charge, has much more chances of reaching the micelle surface and reacting with the gold(III) complex. Moreover, that the reactive ligand form should actually be HL+ is demonstrated by the fact that among the
molar fractions, α, of the three forms of PADA, only that of HL+, i.e. αHL ,
displays a maximum which reflects in the observed dependence of the reaction rate on [H+].
The reaction scheme Hence, on the basis of the experimental findings, the reaction scheme which rationalizes the features of the PADA binding to gold(III) at low pH is the following:
(5.6)
(5.7)
Since the dependence of 1/τf on [Cl−] does not show any increase at the highest
values of [Cl−] and since at low pH values only one site of PADA is available for binding, a reasonable conclusion is that the complex formed under these circumstance is the monodentate species AuCl3L-LH+.
As shown in Appendix III, the time constant expression derived by the above reaction scheme is


![Figure 5.5 Time course of the binding reaction between gold(III) and PADA in 0.02 M DTAC at pH = 6.0; C Au = 5 × 10 − 4 M, C PADA = 5 × 10 − 6 M,[NaCl ] = 0.10 M, λ = 633 nm, T = 25 ° C](https://thumb-eu.123doks.com/thumbv2/123dokorg/7554697.109757/5.892.277.644.125.402/figure-time-course-binding-reaction-pada-dtac-nacl.webp)
![Table 5.1. Rate constants values for the gold(III)-PADA complex formation and dissociation reaction obtained at different DTAC concentrations; C Au = 5 × 10 − 5 ÷ 5 × 10 − 4 M, C PADA = 5 × 10 − 6 M, pH = 4.2, [NaCl] = 0 M, T = 25](https://thumb-eu.123doks.com/thumbv2/123dokorg/7554697.109757/6.892.246.627.479.752/constants-complex-formation-dissociation-reaction-obtained-different-concentrations.webp)
![Table 5.3 Dependence of k f and k d on [Cl − ] for the gold(III)-PADA system in 0.02 M DTAC; pH = 6.0, T = 25 ° C](https://thumb-eu.123doks.com/thumbv2/123dokorg/7554697.109757/9.892.239.679.477.725/table-dependence-cl-gold-iii-pada-m-dtac.webp)