Results
9. RESULTS
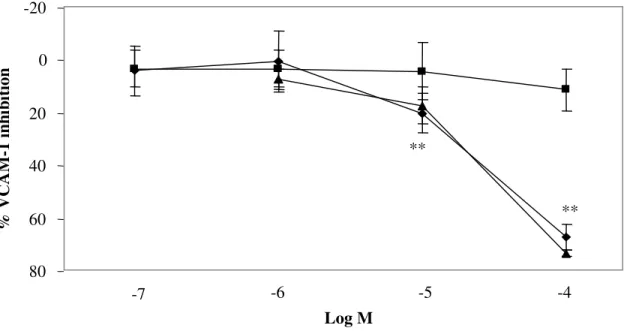
9.1 TNF-α induced CAM expressionTNF-α raised VCAM-1 expression (baseline: 0.07±0.03, 4h: 0.24±0.10; 24h: 0.57± 0.13; 48h: 0.63±0.11) in a time-dependent fashion reaching a plateau between 24 and 48h (Fig. 11). TEL (10-7-10-4M) decreased TNF-α-stimulated VCAM-1 expression concentration-dependently by 68% at its peak, a pattern similar to that elicited by PDTC, an antioxidant compound (Fig. 12) and reached a maximum at 48 hrs (Fig. 13). LOS was ineffective across that similar concentration range (Fig. 2). EXP-3174 and EXP-3179 behaved as LOS (Fig. 14); DEX reduced VCAM-1 expression by 14% (p < 0.05) as a maximum (Fig. 15).
TNF-α raised ICAM-1 expression (baseline: 0.27±0.08, 4h: 0.67±0.11, 24h: 0.89±0.09, 48h: 0.86±0.07) in a time-dependent fashion reaching a plateau between 24 and 48h (Fig.16). TEL and LOS (10−4M for both) were ineffective on that parameter (Fig. 17).
No influence on basal adhesion molecule expression was observed by any of the drugs employed (data not shown).
0,0 0,2 0,4 0,6 0,8 TNF-α 4 h 24 48 V C A M -1 (A U ) ** ** ** * Time (h) + -
Fig. 12 Differential inhibition by TEL (♦) and PDTC (▲) vs LOS (■) of TNF-α-induced VCAM-1 surface
expression, n = 5, **p < 0.001 vs vehicle. Means±S.D.
Fig. 13 Time dependent inhibition by TEL (10-4M) of TNF-α-induced VCAM-1 surface expression. TEL
maximum inhibition was reached at 48h, n=5, **p<0.001. Means±S.D.
-20 0 20 40 60 80 -7 -6 -5 -4 Log M % V C A M -1 i n h ib it ion ** ** -20 0 20 40 60 80 4 24 48 Time (h) % V C A M -1 i n h ib it ion ** ** **
Fig. 14 LOS active metabolites inefficacy in comparison with TEL (10-4M for both). Both 3174 and
EXP-3179 didn’t inhibit TNF-α-induced VCAM-1 surface expression behaving as LOS itself, n=4, *p<0.05. Means±S.D.
Fig. 15 DEX inhibitory effect in comparison with TEL (10-4M for all). DEX inhibited, n=7. DEX decreased
TNF-α-induced VCAM-1 surface expression by 14%, n=5, *p<0.05, **p<0.001. Means±S.D.
0,0 0,2 0,4 0,6 0,8 - TNF-α
TEL LOS DEX
- V C A M -1 (A U ) + + + + ** * ** Drug - 0,0 0,2 0,4 0,6 0,8 - TNF-α
TEL EXP-3174 EXP-3179
V C A M -1 (A U ) + + + + - * Drug - **
Fig. 16 Time dependent stimulation of ICAM-1 surface expression by α 200 U/ml for 4, 24 and 48h.
TNF-α induced surface expression of ICAM-1 in a time-dependent manner, n=5, *p<0.05, **p<0.001 vs vehicle. Means±S.D.
Fig. 17 Lack of effect of TEL and LOS (10−4 M for both) on TNF-α-inducible ICAM-1 surface expression in
0,0 0,2 0,4 0,6 0,8 1,0 1,2 + IC A M -1 (A U ) TNF-α Time (h) 4 24 48 - * ** * 0,0 0,2 0,4 0,6 0,8 1,0 IC A M -1 (A U ) - TNF-α TEL LOS + + + - ARB -
9.2 Pharmacological PPAR-γ manipulation
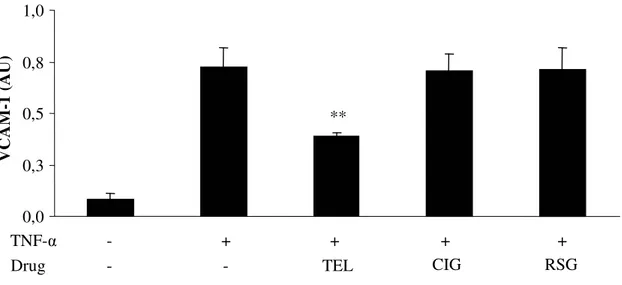
CIG and RSG, two PPAR- γ agonists, did not affect TNF- α-stimulated VCAM-1 expression (Fig. 18) and the inhibitory effect of TEL (10-4M) was not reversed by GW9662 or T0070907, two PPAR-γ antagonists (Fig. 19).
Fig. 18 TEL, CIG and RSG (10−4 M for all), on TNF-α--induced VCAM-1 surface expression, **p < 0.001 vs.
vehicle, n=6, Means±S.D. 0,0 0,3 0,5 0,8 1,0 V C A M -1 (A U ) - TNF-α TEL CIG RSG + + + + - ** - Drug - TNF-α + GW9662 T0070907 + + + + - ** 0,0 0,2 0,4 0,6 0,8 1,0 V C A M -1 (A U ) TEL - + + - - - ** ** PPAR-γ antagonist
9.3 AII-mediated cell damage and effect of AT1R blockade
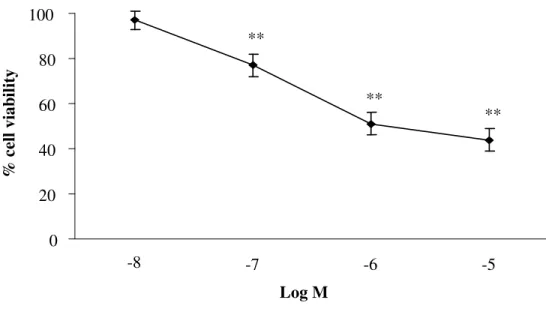
AII (10-8-10-5 M) reduced cell viability in a concentration dependent manner (Fig. 20). AII (10-6 M) decreased cell viability by 50% a trend partially and concentration-dependently reversed by both TEL and LOS (10-7-10-5 M) (Fig. 21). The effect of the two drugs did not differ significantly.
Fig. 20 Effect of AII on cell viability (MTT assay), n=4. **p < 0.001 vs. vehicle, Means±S.D.
Fig. 21 Antagonism by TEL (black histograms) and LOS (grey histograms) of AII-induced cell damage (10−6 0 20 40 60 80 100 -8 -7 -6 -5 Log M % c el l vi ab il it y ** ** ** ** ** ** ** 0 20 40 60 80 100 -7 -6 -5 Log M R es tor ed c el l v iab il it y (%) ** **
9.4 H2O2-induced cell damage and effect of AT1R blockade
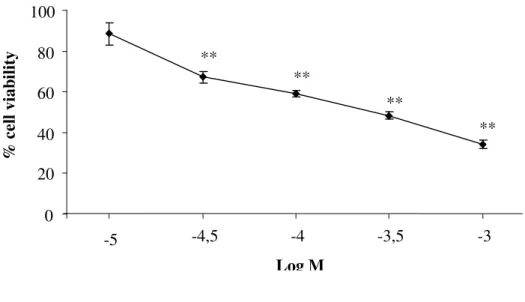
H2O2 reduced cell viability in a concentration dependent manner (Fig. 22). H2O2 (3×10⁻⁴ M) decreased cell viability by 50.7±6.7% and increased TDNA% (from 6.9±0.9% to 74.8±7.4%,
p < 0.001, n = 4). Decreased cell viability by MTT and increased TDNA% by COMET were
highly and inversely related parameters (rho: −0.85, p < 0.01). TEL (10−4 M) partially restored both MTT (from 50.7±6.7% to 69.7±6.3%, p < 0.01, n = 4) and TDNA%. LOS and DEX were ineffective (Fig. 23a and 23b).
Fig. 22 Effect of H2O2 on cell viability (MTT assay), n=4. **p < 0.001 vs. vehicle, Means±S.D.
Control H2O2 TEL+H2O2 0 20 40 60 80 100 -5 -4,5 -4 -3,5 -3 Log M % c el l vi ab il it y ** ** ** **
Fig. 23b H2O2 (3×10 −4
M×90 min) on TDNA% (Comet assay) per se and in presence of TEL, LOS and DEX (10−4 M for all), n=4, **p < 0.001 vs. vehicle, Means±S.D.
9.5 The effect of TEL on in vitro TOSC
TEL scavenged hydroxyl radicals concentration-dependently and exerted a negligible activity towards peroxyl radicals and peroxynitrite (Fig. 24). At the maximum tested concentration, the scavenging capacity towards hydroxyl radicals averaged 26.2% versus 2.7% and 3.3% towards peroxyl radicals and peroxynitrite respectively (n=3, p < 0.001).
0 25 50 75 100 - - T D N A % H2O2 + + + + **
- TEL LOS DEX