Silvia Caligaris
Dipartimento di Sociologia, Università di Milano-Bicocca, Milano, Italia Fulvia Mecatti
Dipartimento di Sociologia, Università di Milano-Bicocca, Milano, Italia Franca Crippa
Dipartimento di Psicologia, Università di Milano-Bicocca, Milano, Italia
1.
T
HE GLOBAL GENDER GAP INDEX AND ITS MEASUREMENT:
CRITICAL POINTSThe Global Gender Gap Index (GGGI) was introduced in 2006 by the World Economic Forum, an independent international organisation. Its annual Report ranks 135 countries by means of a composite indicator which takes into account four critical areas of inequality between men and women: economics, politics, education and health, each measured on a set of variables/indicators (Table 1).
It is important to point out that GGGI measures gaps and not levels in the sense that it << […] assesses countries on how well they are dividing their resources and opportunities among their male and female populations, regardless of the overall levels of these resources and opportunities >> (Global Gender Gap Report, 2011, pag.3); this implies that a country where women and men possibly live in bad but perfectly equal conditions would rank at the top of the graduation possibly outperforming a richer country with a biased distribution of resources between the two genders.
An evident merit of the GGGI is its ease of interpretation that has allowed and promoted the diffusion, mainly in the entrepreneurship fields, of the principle that gender equity is a pre-condition of the economic development. However, some ambiguities and criticalities should be highlighted. Regarding the final ranking produced on the basis of the GGGI, it should be noted that the significance of each position is strictly related to both the (absolute) value and the variability in the distances between each country score. In fact, if the gap is minimal, being either at first or at 40th place can depend on a ten thousandth of a score. For instance, in the 2011 scoring (Global Gender Gap Report, 2011, table 5, p.16) this is exactly what happens to United States that reaches the 39th place (with respect to health and survival dimensions), just above Romania and Columbia (at 41th place) and below 38 other countries awarded the same highest score as
minimal score difference might produce unintentional substantial change in the ordering. Beside the arbitrariness in the many choiches involved in the process of computing the index and producing the countries ranking (see Table 1) other technical and conceptual weaknesses potentially leading to instability of the final ranking are detectable. Emblematic examples are: i) established that we all live in a two speed-world, is a single indicator able to grasp different gender related problems concerning both developed and in transition countries (Barnes and Bouchama 2011)? ii) The truncation methodology would hide any reversed gender disparity as in the case of education, where the female advantage is becoming a trait of developed countries; iii) the omission of social components and cultural aspects mixes the richest and the poorest countries together in the ranking, raising doubts about the effectiveness of the index; for instance in the 2011 Report, Italy stays in between Ghana-70th- and Vietnam-79th- and iv) the weighting/aggregative system allowing
for compensation potentially undermines the score/country comparability. TABLE 1
Features and methodology of GGGI construction 4 Dimensions and
observed indicators 1. Economic Participation Ratio F/M for:
labour force participation wages equality
earned income
managers, legislators, seniors quota professional workers
2. Educational Attainment Ratio F/M for:
literacy rate
primary, secondary, tertiary education 3.Health&Survival
Ratio F/M for: sex at birth
life expectancy (at birth?) 4. Political Partecipation
Ratio F/M for:
women in Parliament
women in ministerial positions
years with female head of state (last 50 years) Transformation
For each variable within each dimension
1. Each variable is measured as female/men ratio
2.Each ratio F/M is truncated at the equity benchmark 1, with the exception of sex ratio at birth (truncated at 0.944) and of life expectancy (truncated at 1.06).
Aggregation Sub-Index: within each dimension
Weighted average among the simple indicators; weights are proportional to the inverse of the dispersion within countries in a specific dimension in order to guarantee that each variable has the same relative impact on its dimensional subindex
Index: among the 4 dimensions
Simple arithmetic average of all sub-indexes (from which the final score of GGGI results)
Range and
interpretation (0,1) 1=perfect equity 0= max inequity
2.
A
PROPOSAL FOR METHODOLOGICAL IMPROVEMENTSOn account of the shortcomings listed above, the purpose of our research is to explore and ponder possible changes in the final GGGI ranking due to our following suggested “remedies”:
1. select a small group of developed countries (OECD), comparable with respect to cultural and social aspects;
2. eliminate the truncation to the equality benchmark 1 so as to highlight and take into account those sectors in which women have overcome men (e.g. tertiary education);
3. add a fifth dimension related to the use of time for both women and men; 4. explore an alternative weighting method through structural equation modelling
(SEM).
A more detailed discussion about each point is given in the following subsections.
2.1. Developed countries
Gender inequality exists in most parts of the world, from Japan to Marocco, from Uzbekistan to the United States. Yet, inequality between women and men is not the same everywhere, it can take many different forms. Gender inequality is not a homogeneous phenomenon, but a collection of disparate and inter-linked issues such as natality and mortality inequality, special-opportunities inequality, professional inequalities, ownership inequality, household inequality and the like.
Many advanced countries have developed strategies to improve the dissemination of statistics reflecting the realities of women and men, but there is considerable variation in timing and choices among the member countries, with some countries that have pioneered developments in the field of gender statistics, far ahead of those that have established their gender statistics only in the last 10 years.
Gender Equality is one of the 8 Millenium Development Goals promoted by United Nations; it is strategic for national economic growth and poverty reduction as well as for the reduction of malnutrition, fertility and child mortality. It is also a fundamental tool for accelerating the achievement of the other 7 goals1.
1
GGGI explores and try to explain the possible causes in the persistence of gender gaps; in the poorest countries of the world the women’s access to land, to credit, to a decent job, to vote and to education is a daily fight, but what about developed countries? In OECD countries education, health, survival ect. are human right enshrined and guaranteed by national Constitutions, so where does the gender gap still linger2?
To answer this question, it is necessary to develop researches and studies ad hoc, to go beyond appearances, whose hidden factors are apt to explain the existing differences among countries as for economic, legal and cultural aspects.
2.2. Elimination of truncation
“Gender equality entails the concept that all human beings, both men and women, are free to develop their personal abilities and make choices without the limitations set by stereotypes, rigid gender roles and prejudices. It does not mean that women and men have to become the same, but that their rights, responsibilities and opportunities will not depend on whether they are born male or female” (ABC Of Women Worker's Rights And Gender Equality, ILO, Geneva, 2000, p. 48).
The purpose of gender studies is to measure, highlight and understand imbalances and gender related problems, the latter being either possible advantages or disadvantages for both male and female. Thus truncation could hide existing differential situations either for women or men, potentially fundamental to understand the role of some specific factors and their consequences.
The first step of our exercise will consist in exploring changes in the original ranking of 15 selected countries as a consequence of eliminating the truncation in the construction of the GGGI.
Previously we calculated the ranking anew with the original methodology (i.e. with truncation) proposed by the World Economic Forum; in particular, we reweighted the 4 dimensions so as to consider the variability among only the 15 considered countries (and not the whole world variability as for the global ranking produced by the World Economic Forum).
In Table 2 we compare the ranking provided by the GGGI with and without truncation. The main changes in the ranking concern:
- UK moves 2 positions up thanks to the high Female-to-Male ratio (F/M) in tertiary education (1.39);
- Estonia moves 3 positions up; in fact women working in professional jobs are more than twice of men (F/M=2.15). Furthermore Estonian women boast a higher rate in tertiary education (F/M=1.69) and enjoy a higher life expectancy.
- France, Spain and Portugal, on the other side, loose some positions due to a lower tertiary female education rate, in comparison to the other countries. Anyway, in all countries women overcome men in the education level (all F/M ratios exceed the equality benchmark 1) with the only exception of Japan (0.84).
- Another female overcoming occurs, for some countries, in the F/M ratio of professional workers; in addition to the extraordinary case of Estonia (2.15), it
2 A. MIKKOLA (2007), Development and Gender Equality: Consequences, Causes, Challenges and Cures. Discussion Paper No. 159, ISSN 1795-0562,
happens also in Canada (1.3), Slovenia (1.25), Finland (1.24), USA (1.2), Portugal (1.07), Norway (1.06) and Sweden (1.02).
TABLE 2
Comparison bewteen GGGI with truncation and GGGI without truncation
RANK GGGI TRUNCATED score GGGI NOT TRUNCATED score
∆
1 Finland 0.694 Finland 0.670 0 2 Norway 0.767 Norway 0.735 0 3 Sweden 0.721 Sweden 0.695 0 4 Germany 0.723 Uk 0.698 2 5 Spain 0.773 Germany 0.750 -1 6 Uk 0.839 Usa 0.824 1 7 Usa 0.800 Spain 0.779 -2 7 Canada 0.845 Canada 0.852 0 9 France 0.760 Estonia 0.750 3 10 Portugal 0.719 Slovenia 0.723 1 10 Slovenia 0.721 France 0.703 -2 12 Estonia 0.707 Portugal 0.674 -2 13 Greece 0.749 Greece 0.736 0 14 Italy 0.671 Italy 0.646 0 15 Japan 0.749 Japan 0.735 0- In few countries we have also overcoming in the ratio about women/men in ministerial positions: Finland even 1.71 followed by Spain (1.13) and Norway (1.11).
The medal for the poorest female political representation goes to Japan, where there is a woman minister every 7.7 men (in Italy 1 woman every 3.6 male ministers).
2.3. Adding a fifth dimension: Time Use
Women are “half the world's economic population but put in two thirds of the working hours, grow half the food, but receive one tenth of the wages and own only one percent of the world's property. Women's invisibility in national accounts belittles our role in the economy and society, chips away at our self-esteem, leads policy makers to overlook the impact of decisions on women's lives, and makes it difficult for women to achieve equality in our society" - UN analysis on women, quoted by Mary Collins, Minister Responsible for the Status of Women in Canada at International Conference on the Measurement and Valuation of Unpaid Work in Ottawa in 1993 (Fleming and Spellerberg, 1999).
Household maintenance and care work (children and elderly people) are prime examples of labor performed without a wage. Their performers are carrying out tasks that are necessary for the wellbeing and continuity of both the society and the economy. Without them, society as we know would cease to function; but such kinds of works are
ignored, not acknowledged in a country's Gross Domestic Product (GDP), or in traditional employment statistics gathered by government bodies3.
Conversely the value of unpaid work, particularly care, is an important issue in a range of policy debates, such as provision and funding of childcare, individualisation of taxation and the employment requirements attached to benefits for lone parents.
Technological advances in household production (ex dishwashers, washing machines etc), joined with the expansion of the markets for services that allow modern families to outsource a number of household and child related activities, have drastically diminished the amount of time spent on housework.
Anyway the gender division of labour at home appears to be one of the most enduring patterns in modern social life in fact despite these changes the studies unanimously report that women continue to spend more time on household work (housework and caring) than men and that this gender gap in men and women’s unpaid labour persists even for those in employment and regardless of women’s paid work time.
In developed countries men and women live in an increasing sense of time pressure so they need to manage a greater amount of work, both paid and unpaid. Time is a resource as well as money, job, education and health, therefore as such men and women should have an equal access and opportunity to it.
Countries like Canada, Norway and Sweden for first have developed systematic gender statistics that help demonstrate inequality between the sexes in areas such as household responsibility and childcare. Through the analysis of such statistics, the aim is to change social policies and to narrow the gender gap in domestic responsibilities and work-life balance.
“Time-use surveys record information on how members of a household allocate their time across different day-to-day activities. The surveys involve respondents keeping a diary of their activities over one or several representative days for a given period” (OECD, Family Database).
These surveys provides the measure of how paid and unpaid labor duties are divided up among family members, how care work is provided for, how much time individuals devote to leisure and personal needs.
Currently, many countries are conducting a series of time use surveys over an extended period of time in order to chart changes in behavior and to identify trends. Time use diaries have been harmonized with the purpose of bringing together time use data from a variety of countries in a manner that enables comparisons across countries.
Our proposed fifth dimension aims to catch the gender gap in the time spent by women and men in different household activities, as defined by OECD4 in the following
categories:
• Unpaid work: includes domestic activities except time spent exclusively caring for a child or another person which is separately identified.
• Care work covers the time spent to care for a child or for another adult (regardless of whether that person lives in the household).
3
J.S. LANDEFELD, S.H. MCCULLA (2000), Accounting for nonmarket household production within a national account framework, Review of Income and Wealth, 46, pp. 289– 307
4
Leisure5 includes a wide range of indoor and outdoor activities. TABLE 3
Time Use Survey activities definition and classification UNPAID
WORK CARE WORK LEISURE chores child supervision walking cleaning child education sports washing transporting child enterteinment cooking leisure act with child cultural act. repair works caring elderly socializing
shopping caring disables taking a nap volunteer playing games caring pets watching tv
gardening using pc
We have collected the OECD Time Use Data concerning the 3 categories of activities above (percentage of time spent in each activity over 24 hours) for both men and women for each of 14 countries.
Greece had to be excluded in this phase of analysis because its first Time Use Survey is currently being performed (it started in September 2011 and the data should be available by December 2014).
We computed the F/M ratio for leisure, while the ratio has been reversed in M/F for both unpaid work and care work. This choice was dictated by the following consideration:
a) F/M or M/F ratio=1 means perfect equality between men and women in that particular group of activities;
b) F/M ratio>1 represents an advantage for women in many areas (as in Education or Life Expectancy); but the same result F/M ratio>1 in activities as unpaid work or care work, conversely has a negative connotation, as it represents a disadvantage.
Since in the analysis so far conducted a F/M ratio greater than 1 implied an overcoming in favour of women, correspondingly the ratio for unpaid and care work need to be reversed to mantain the same for reading and interpretative keys for all the ratios.
Table 4 shows, in its upper part, the percentages of daily time spent by women and men in the different groups of activities, in its lower part it shows the ratios for each activity with respect to the 14 countries.
5 The boundary between unpaid work and leisure is set by the so-called “third-person” criterion. If a third person could hypothetically be paid to do the activity, it is considered to be work. Cooking, cleaning, child care, laundry, walking the dog and gardening are therefore all examples of unpaid work. On the other hand, someone else cannot be paid to watch a movie, play tennis, or peacefully read a book on another’s behalf as the benefits of the activity would accrue to the doer (the third person), and not to the hirer (Ironmonger, 1996). These activities are therefore considered as leisure (M. VEERLE, Cooking, Caring and Volunteering: Unpaid work around the world, www.oecd.org/els/workingpapers).
TABLE 4
Leisure and M/F for Unpaid and Care work of daily time spent in that activity (% for women and men and F/M ratio)
% time per
day FINLAND FRANCE GERMANY ITALY NORWAY SPAIN SWEDEN
men wom men wom men wom men wom Men wom men wom men wom
LEISURE 26.1 24.2 19.6 17.3 25.8 24.3 23.8 18.3 26.7 26.4 23.1 19.5 24.4 23.0 UNPAID WORK 9.4 14.4 8.7 16.3 9.8 16.3 6.0 21.2 9.3 13.2 9.9 18.6 10.0 14.0 CARE WORK 1.6 3.0 1.5 2.9 1.4 2.6 1.4 3.20 1.8 3.2 2.3 3.8 1.8 3.0 % time per
day UK USA CANADA ESTONIA SLOVENIA PORTUGAL JAPAN
men wom men wom men wom men wom Men wom men wom men wom
LEISURE 24.7 22.3 23.0 20.4 24.0 22.3 21.3 18.3 24.2 19.7 22.2 18.8 18.7 17.3
UNPAID
WORK 9.5 16.6 9.1 17.6 9.0 13.8 11.5 19.2 11.4 19.7 5.8 21.28 5.7 17.6
CARE
WORK 1.6 3.6 2.1 4.1 2.4 4.1 1.8 3.5 1.6 2.6 1.3 3.2 0.5 2.1
ACTIVITY FIN FRA GER ITA NOR SPA SWE UK USA CAN EST SLO POR JAP
LEISURE 0.93 0.88 0.94 0.77 0.99 0.84 0.94 0.90 0.89 0.93 0.86 0.81 0.85 0.93
UNPAID
WORK 0.65 0.53 0.60 0.28 0.70 0.53 0.71 0.57 0.52 0.65 0.60 0.58 0.27 0.32
CARE
WORK 0.53 0.52 0.54 0.44 0.56 0.61 0.60 0.44 0.51 0.59 0.51 0.62 0.41 0.24
A significant gender gap emerges in all countries and in all groups of activities, with perhaps the exception of leisure. The greatest difference between women and men is registered in care activities, in fact in most of countries women devote almost twice as much the time then men in caring children or elderly people. The widest gap occurs in Japan, where women spend 4 times more then their male partner in caring activities.
As far as unpaid activities are concerned, men seem to give a greater help to women, in particular in Sweden and Norway. The only two cases against the trend are Italy and Portugal, where the gap between women and men is even larger for household activities than for the caring ones.
Leisure activities show a greater gender balance, with the excellence of Norway showing almost a perfect equality. Also Japan, where women normally are used to dedicating more time to household activities, seems to find a better equilibrium between women and men in spending their sparetime. This instead does not occur in Italy, where the gender gap persists; Italian males spend their time 1.3 times more in leisure than what the countrywomen do.
Taking into account all the previous country differences, we inspect if some changes in the GGGI ranking occur among the 14 states. In Table 5 we compared the not truncated 4-dimensions ranking (second column) to the here computed not truncated 5-dimensions, gained adding the Time Use component to the previous ones (second column). The first righ-hand side column shows the differences between the two rankings. The most interesting case appears to be Canada, that even moves 3 positions up, overcoming USA and UK. In fact, in comparison with these two countries (similar in other dimensions), Canada shows a better gender balance in all 3 groups of activities, recording ratios similar to Northern European countries. As a conclusion we notice that including the Time Use among the explaining dimensions for the gender gap persistence
allows for identifying relevant differences among developed countries which otherwise would be masked as very closed to each other in health- and educational related aspects due to very wide span in differences induced by poorer countries.
TABLE 5
Comparison between GGGI 4 dimensions and GGGI 5 dimensions adding TUS component RANK GGGI 4-DIM GGGI 5-DIM
∆
1 Finland Finland 0 2 Norway Norway 0 3 Sweden Sweden 0 4 Uk Germany 1 5 Germany Canada 3 6 Usa Uk -2 7 Spain Spain 0 7 Canada Usa -2 9 Estonia Estonia 0 10 Slovenia Slovenia 0 10 France France 0 12 Portugal Portugal 0 13 Greece Italy 0 14 Italy Japan 0 15 Japan
Figure 1 – Representation of GGGI as computed by 4-dimensions methodology and by 5-components.
2.4. A proposal for an alternative weighting system through Structural Equation Models
Structural Equation Modeling (SEM henceforth) combines observed data and qualitative causal assumptions for testing and estimating quantitative cause-effect relationships among variables of interest.
It has been introduced for applications in Genetics (Wright, 1921) and Economics (Haavelmo, 1943) with a reinvigurated interest in recent years in a wider application field
under the causal inference and latent variable paradigm (Bollen, 1989; Chiandotto, 1992), SEM is able to deal with two kinds of variables simultaneously: observed variables, i.e. manifest and measurable characteristics, and latent variables, i.e. unobservable yet active factors. Latent variables then represent hypothetical constructs only indirectly measurable through multiple observable indicators. Observable indicators are devised in order to capture different aspects of the latent construct. As a consequence SEM appears particulary relevant for the purposes here fostered.
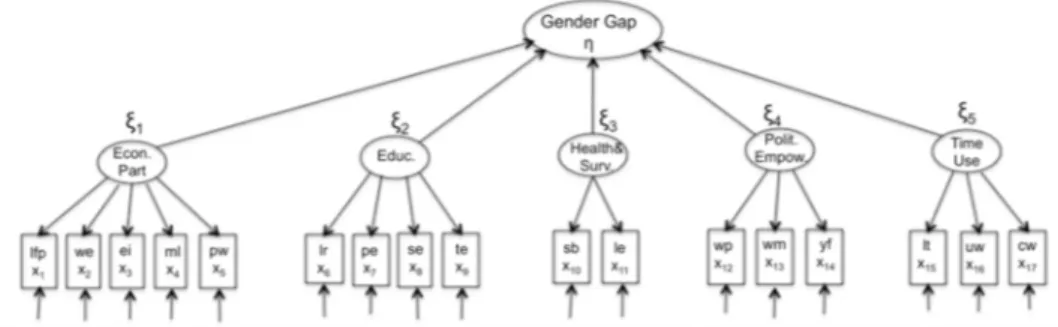
A path diagram picturing both variables and relationships is usually the first step of SEM. Considering the traditional four GGGI dimensions (economic participation, education, health&survival, political empowerment), plus the added time use dimension as five latent variables contributing to the gender gap in a country, the latter in its turn assumed as the response latent variable, we can adopt a structural equation model as graphically represented in Figure 3. According to SEM standard notation, latent variables are depicted by either ellipses or circles and denoted by a greek letter (
ξ
in Figure 3).Figure 2 – Path diagram adopted for GGGI with the added Time Use component. Legend
lfp=labour force participation; we=wage equality; ei=earned income; ml=managers, legislators, seniors quota; pw=professional workers; lr=litearcay rate; pe=primary education; se=secondary education; te=tertiary education; sb=sex ratio at birth; le=life expectancy; wp=women in parliament positions; wm=women in ministerial positions; yf=yaers with female head of state; lt=leasure time; uw=unpaid work; cw=care work.
Observable indicators are denoted by a latin letter (x in Figure 3) and displayed in either
rectangles or squares. Relationships between variables, either causal or co-associative, are depicted by an arrows’ pathway. Thus Figure 3 depicts by means of ellipses both the latent gender gap variable and its five latent components. Every latent component is measured indirectly through a set of observable indicators as shown in rectangles at the bottom of Figure 3. Straight single-headed arrows represent a causal relation in that the variable at the head of the arrow is intended to cause the variables at the base of the arrow. SEM also includes error terms i.e. disturbances affecting the variables involved into the model. In Figure 3, measurement errors are represented by the arrows pointing to every single indicator. Error terms interpret residual variance within variables not accounted for by pathways hypothesized in the model.
The model with both its measurement and structural parts is compactedly given in equation (1).
In the measurement part of the model,
=
(x , , x )
1 17T
x
…
is the vector of indicators intended to measure the latent components;Λ
x is the(
17 5
×
)
matrix of factor loadings, i.e. regression coefficients between every indicator and its factor;ξ
=
( , ,
ξ
1ξ
5)
T
…
denotes the vector of the 5 latent components of gender gap;δ
=
(
δ
1,
,
δ
17)
T
…
indicates the vector of measurement errors associated to each indicators.In the structural part of the model, the gender gap η, i.e. the response latent variable, is expressed as a linear function of the 5 latent components
ξ
of the gender gap with latent regression coefficientsΓ =
(
γ
1,
,
γ
5)
T
…
andζ
=
(
ζ
1,
,
ζ
5)
T
…
is the vector of errors associated to each latent component.ξ δ
η
ξ ζ
= Λ
+
= Γ +
Measurement Model :
Structural Model :
xx
(1)Hence its non-null values indicate latent components with a significant impact on the gender gap latent variable. As a starting point, we considered the simplest choice of all latent components equally affecting the gender gap, i.e.
γ
1= = =
…
γ
50.20
, which is equivalent to the traditional GGGI methodology (see Table 1). We run the analysis by using the free open source R package LAVAAN (LAtent, VAriable Analysis, Rosseel 2012) which, for fitting model (1), requires to set a unitary factor loading to a chosen benchmark indicator for each latent component, i.e. in each column of the factor loadings matrixΛ
x a chosen element has to be set equal to 1. Our exercise can be summarized in the following key steps.i) A main issue was related to the Health & Survival dimension which in GGGI metodology is measured by means of two indicators. This does not satisfy a basic identification condition for the measurement model in equation (1) which requires at least three indicators loadings on each factor. Moreover, both life expectancy and sex ratio at birth indicators appeared inadequate among OECD countries for being almost constant and hence scarcely informative. In addition, the latter essentially depends on biological and genetic factors hardly associable with the concept of gender disequity. In order to address both these issues, alternative measurable variables have been explored. First life expectancy has been replaced by healthy life expectancy at birth (HALE) in order to account for whether longer life expectancy is accompanied by good health among ageing populations, since increased life expectancy at age 65 does not necessarily mean that the extra years are lived in good health. Then we considered differences between women’ and men’ behaviours with respect to health risk factors, focal in the set of countries under study. In fact, although advances in longevity, much of the burden of diseases in OECD countries is known to be linked to lifestyle factors, tobacco smoking, alcohol consumption, unhealthy diet and lack of physical activity being largely responsible. Among lifestyle habits, we then considered tobacco smoking, alcohol consumption and obesity as further observable
indicators of the latent component Health & Survival. 2008-2009 data from WHO have been used as showed in Table 6 and 7. According to a basic feature of GGGI metodology (see Table 1), male-to-female ratios have been computed for each indicator so that a ratio greater than 1 highlights a male advantage, a female advantage when less than 1 and gender equity when equal to 1. Male/female ratios are displayed in the right side columns of each table. Notice that for OECD countries, by considering the healthy life expectancy, gender differences appear mitigated with respect to the life expectancy indicator used in the traditional GGGI metodology (see the two columns at the very right in Table 6). In other words, even if women live longer than men in the richest part of the word, they live – or perceive to live - the last years in precarious or deteriorated health conditions. Ratios in the three rightest columns of Table 7 confirm as expected that women tend to have healthier lifestyle behaviour than men, particularly with regard to alcohol consumption.
TABLE 6
Life expectancy and Healthy life expectancy data and ratios (WHO 2009)
Country LEB HLEB DIF RF DLE DHLE
M F M F M F Japan 80 86 71.4 75.8 8.6 10.2 0.84 6 4.4 France 78 85 69 73.5 9 11.5 0.78 7 4.5 Spain 78 85 68.7 73 9.3 12 0.78 7 4.3 Italy 79 84 69.2 72.9 9.8 11.1 0.88 5 3.7 Finland 77 83 67.7 72.5 9.3 10.5 0.89 6 4.8 Canada 79 83 68.2 71.6 10.8 11.4 0.95 4 3.4 Norway 79 83 69.3 72.2 9.7 10.8 0.90 4 2.9 Sweden 79 83 70.5 73.2 8.5 9.8 0.87 4 2.7 UK 78 82 68.4 70.9 9.6 11.1 0.86 4 2.5 Germany 78 83 68.3 72.2 9.7 10.8 0.90 5 3.9 Portugal 76 82 64.3 69.4 11.7 12.6 0.93 6 5.1 Greece 78 83 69 71.9 9 11.1 0.81 5 2.9 Slovenia 76 82 65.1 70.3 10.9 11.7 0.93 6 5.2 USA 76 81 66.4 68.8 9.6 12.2 0.79 5 2.4 Estonia 70 80 58 66.1 12 13.9 0.86 10 8.1 Legend
LEB: Life Expectancy at birth for all 15 countries, disaggregated by sex (F,M).
HLEB: Healthy Life Expectancy at birth for all 15 countries, disaggregated by sex (F,M). DIF: difference between LEB and HLEB by sex
RF: ratio M/F for difference DIF
DLE: difference between female and male in Life Expectancy at birth (LEB).
DHLE: difference bewteen female and male in Healthy Life Expectancy at birth (HLEB). Japanese women appear the healthiest in the set of 15 countries under study, followed by Estonian and Mediterranean women (Italy, France and Spain). On the other hand, Portuguese women seem to represent an exception: although they smoke half than men, they show one of the highest risk of obesity, equal only to American women. Besides, Portuguese women score the sad primacy in alcohol use, with the smallest gap compared to men in alcohol consumption.
ii) Starting from the basic model described in Figure 2, a number of different models interpreting diversified scenarios of the relationship system between variables, components and indicators, have been explored. Every model has been evaluated by means of two habitual goodness of fit indexes: the Root Mean Square Error of Approximation (RMSEA) and the Comparative Fit Index (CFI) (Bentler and Bonett, 1980). Hence we selected the best parsimonious fitting model (showing RMSEA=1.000 and CFI=0.000) as described in Figure 3. Notice that round double-headed arrows in Figure 3 indicates co-variation between two measurable indicators.
TABLE 7
Health Risk Factors, (WHO 2008-2009)
Legend
BMI>30: Percentage of defined population (age +20) with a body mass index (BMI) of 30 kg/m2 or higher, disaggregated by sex.
alcohol: ratio total APC /1-total rate of abstainers in %. Total APC among drinkers is defined as the total (recorded and unrecorded) amount of alcohol consumed per adult drinker (15+ years) over a calendar year, in litres of pure alcohol.
tobacco: % adult (+16) tobacco current smoking (includes cigarettes, cigars, pipes or any other smoked tobacco products both daily and non-daily or occasional smoking).
RO: obesity ratio M/F (BMI>30). RA: alcohol consumption ratio M/F . RT: tobacco use ratio M/F
Country BMI>30 alcohol tobacco RO RA RT
M F M F M F Japan 5.5 3.5 9.85 5.75 42 12 1.57 1.71 3.50 France 16.8 14.6 14.85 8.79 36 27 1.15 1.69 1.33 Spain 24.9 23 21.13 15.58 36 27 1.08 1.36 1.33 Italy 19.3 14.9 13.02 8.15 33 19 1.30 1.60 1.74 Finland 21 17.6 14.2 8.7 28 22 1.19 1.63 1.27 Canada 24.6 23.9 12.59 7.04 24 17 1.03 1.79 1.41 Norway 21.6 17.9 8.68 5.31 31 28 1.21 1.63 1.11 Sweden 18.2 15 12.48 7.84 30 28 1.21 1.59 1.07 UK 24.4 25.2 15.62 9.46 25 23 0.97 1.65 1.09 Germany 23.1 19.2 13.39 7.78 33 25 1.20 1.72 1.32 Portugal 20.4 22.3 27.45 19.86 32 16 0.91 1.38 2.00 Greece 18.8 16.1 14.99 10.82 63 41 1.17 1.39 1.54 Slovenia 28.1 25.9 17.93 11.38 30 22 1.08 1.58 1.36 USA 30.2 33.2 14.43 8.45 33 25 0.91 1.71 1.32 Estonia 20.2 17.6 21.96 12.15 46 23 1.15 1.81 2.00
Figure 3 – Path diagram adopted for GGGI with the added Time Use component. Legend
lfp=labour force participation; we=wage equality; ei=earned income; ml=managers, legislators, seniors quota; pw=professional workers; lr=litearcay rate; pe=primary education; se=secondary education; te=tertiary education; sb=sex ratio at birth; le=life expectancy; wp=women in parliament positions; wm=women in ministerial positions; yf=yaers with female head of state; lt=leasure time; uw=unpaid work; cw=care work.
iii) Results for the selected structural equation model are illustrated in Table 8. Loading coefficients, fitted for each indicator in every latent component (Table 8, first column), have been rescaled to the maximum observed value within each component for ease of interpretation of the relative importance of each indicators (Table 8, second column). Moreover, standardized loadings are expected to benefit from an improved robustness with respect to the choice of the fixed variable with unitary loading coefficient by default.
TABLE 8
Estimates parameters of the gender gap factors model
ECONOMIC
PARTICIPATION Loading
Scaled
loading Variances Covariances
Labour force particip. 1 0.894 0.329 -0.328 we~~ml
Wage equality 0.826 0.739 0.52 -0.324 ei~~pw
Earned income 1.118 1.000 0.178 Managers, legislators… 0.608 0.544 0.71 Professional workers 0.599 0.536 0.717 EDUCATIONAL ATTEINMENT Loading Scaled loading Variances Literacy rate 1 0.099 0.914 Primary education -1.482 -0.147 0.89 Secondary education 2.452 0.244 0.815 Tertiary education 10.062 1.000 0.0002 HEALTH SURVIVAL Loading Scaled loading Variances Tobaco 1 0.434 0.691 Obesity 2.304 1.000 0.00000035 Alchool 0.334 0.145 0.906
POLITICAL EMPOWERMENT Loading Scaled loading Variances Women in ministries 1 1 0.019 Women in parliament 0.861 0.861 0.256
Years female head of state 0.52 0.52 0.686
TIME USE Loading Scaled
loading Variances
Leisure 1 0.035 0.91
Unpaid work 28.798 1.000 1.4E-10
Care work 1.272 0.044 0.898
The higher values of the economic and political loadings give evidence that the economic participation and political empowerment are crucial in the gender gap persistence (Table 8, first and fourth panels).
On the other hand, the negative weight scored by primary education indicator (Table 8, second panel) exposes that gender gap is negatively affected by this variable. This also holds for the healthy life expectancy indicator (Table 8, third panel) as previously noted at point i). However, the most significant direct role upon the educational latent component is played by tertiary education. Regarding our proposed methodology for measuring the Health&sSurvival component of gender gap (Table 8, third panel), the obesity risk factor proves to act the greatest direct impact upon gender differences. As a general remark it should be noted the significant differences in women’ and men’ lifestyles habits in the set of OECD countries here considered. However, as it appears from the third column on the right-hand side of Table 7, gender ratios of unhealthy diet habits present great variability between countries, being on behalf of women (e.g. Japan) as well as of men (e.g. Portugal). Tobacco smoking records the second highest weight in explaining gender differences for the Health&Survival component of gender gap (Table 8, third panel) with ratios male-to-female showing a noticeable variability among countries (Table 7, first rightest column).
Finally, with regard to our fifth added time use component (Table 8, fifth panel), it should be noticed how unpaid work emerges as the critical variable for explaining gender disequity, while both leisure and care work appear to play a secondary role.
iv) The final step in our exercise consisted in checking whether the proposed SEM methodology for computing GGGI would cause significant changes in the ultimate ranking of the 15 OECD countries considered. Table 9 reports both the ranking based on GGGI with 5 components traditionally aggregated (dabbed WEF as in Table 1) and the ranking provided by GGGI with 5 component aggregated by SEM loadings, the rightest column listing the differences ∆ as computed as number of positions either gained (+) or missed (-).
Some noticeable swaps happened. Estonia records the most interesting jump toward the top of the ranking. This seems essentially due to the great importance attributed by SEM to the economic latent component. Estonia in fact reports the greatest score in this dimension, performing even better than the Northern Europe countries. On the other hand in the political empowerment component Estonia registers the second worst score after Japan, while the very same variable firmly secures Scandinavian countries at the top. Japan, despite a severe gender inequality in political participation, rises two positions mainly thanks to the Health&Survival component. The position gained by Spain might
be due to the recent increase in female participation, both political and economic, supported and organized by the Zapatero administration. On the opposite versus Germany, United Kingdom and Portugal see a fall in the ranking.
TABLE 9
Comparison between GGGI with 5 components and traditional WEF weights and proposed GGGI 5 components based on SEM loadings
RANK GGGI WEF 5 COMP. GGGI SEM 5 COMP
∆
1 Finland Finland 0 2 Norway Norway 0 3 Sweden Sweden 0 4 Germany Estonia 5 5 Canada Canada 0 6 Uk Spain 1 7 Spain Germany -3 7 Usa Usa 0 9 Estonia Slovenia 1 10 Slovenia Uk -3 10 France France 0 12 Portugal Japan 2 13 Italy Italy 0 14 Japan Portugal -2Germany loses positions, in particular in education for being characterized by a basic gender balance at all levels unlike all the other countries where tertiary education regularly shows a female advantage over male students.
UK records one of the worst gender ratio in the Health&Survival component, followed only by USA, as evident for instance for the obesity risk factor (Table 7, third column at the very right). It is also noticeable the combination of the fifth Time Use component, particulary the unpaid work indicator, and the SEM as loadings clearly penalize UK with respect to all the other countries involved in the exercise.
Portugal wins the black medal, dropping to the very bottom for showing the highest women risk of obesity compared to men combined with the worst performance in the Time Use component.
As a general conclusion, Table 9 clearly shows how the use of a Structural Equation Model allowed some hidden aspects to emerge, with substantial differences in the country ranking as a direct consequence. In fact, SEM seems to have greatly contributed to distinguish among those indicators that play greater role in either causing or affecting the gender gap as a latent trait of a country. This is particularly evident from results in all of the economic and political indicators as well as both tertiary education and unpaid work. Similarly, SEM provides a powerful tool for selecting variable and indicators, acting less or not at all upon explaining the gender gap and its persistence, for instance in the collection of OECD countries studied here these are literacy rate and healthy life expectancy. In other words, SEM qualifies itself as a recommendable methodology to
point out for a country good practices as well as for bad practices in determining the gender gap.
3.
C
ONCLUSIONSIn this work we explored and showed the effects of some alternative methodology aiming at improving the Global Gender Gap Index (GGGI) as annualy provided by the World Economic Forum.
Our proposal consists of four main points: two of them are linked to the focus on developed countries and the remaining two concern the methodological construction of the index.
The starting point of this research is that an unique global gender gap index as GGGI would not be adequate to explain the persisting differences among countries. It seems necessary for the index to include socio-cultural factors, to deepen the everyday life of both women and men in order to fully understand how they relate to each others and how they make their choices. But to be able to accomplish this goal, the gender gap analysis must be set into a specific social framework, selecting a smaller homogeneous group of countries.
Focusing on OECD countries has allowed to insert a new latent component, Time Use, considering time as a scarce resource in modern countries and that women and men must everyday allocate this resource among different kinds of activities. It has been also possible to improve the indicators of the Health dimension, eliminating those aspects that prove less informative for developed countries (as sex ratio) and concentrating the analysis on specific issues of OECD countries: it is well known that women live longer but it is less known that their last years of life are lived in worse health conditions. This has obviously an impact on the society and on the welfare system.
The methodological proposals consisted first of all in the elimination of truncation; the latter could hide important overcomings for both men and women that could help us to understand which latent factors mostly contribute to the gender gap persistency. In fact many countries benefitted by eliminating truncation, as Estonia, where female professional workers are twice as much then men; is there any need to hide these figures? This has less to do with women empowerment but it conveys an important fact that can help us in understanding the economical context where we live. Or still, as in the case of Japan, where men tend to smoke 3 times compared to women; what is the reason to hide it? Again it is not a question of women empowerment but an issue that can produce important impacts on prevention campains as well as on health politicies.
The other aspect pertains the weighting attribution. We explored an alternative way based on a statistical technique, Structural Equation Modeling, that allowed us to investigate latent variables in an objective perspective determining which factors have a greater influence on the gender gap and which less.
All the aforementioned four steps showed an impact on the initial GGGI and the com-parison of World Economic Forum’s ranking with the ranking obtained according to our proposals shows that many changes occur. These changes can be summarized in the fol-lowing three tables (Tabb. 10, 11, 12) while Table 13 summarizes the complexive effects of all the proposal on the initial GGGI.
The very good practices as the ones in use in Northern Europe are easy to catch and they prove robust, in the sense that they tend to remain on the top of the ranking whatever the weighting methodology adopted. But off the podium things change, even a lot.
TABLE 10
From the original GGGI with truncation to GGGI without truncation
RANK GGGI WEF original
GGGI
TRUNCATION
∆
GGGI NO
TRUNCATION
∆
1 Norway Finland 1 Finland 1
2 Finland Norway -1 Norway -1
3 Sweden Sweden 0 Sweden 0
4 Germany Germany 0 Uk 2
5 Spain Spain 0 Germany -1
6 Uk Uk 0 Usa 1
7 Usa Usa 0 Spain -2
7 Canada Canada 0 Canada 0
9 Portugal France 2 Estonia 3
10 Slovenia Portugal -1 Slovenia 0
10 France Slovenia -1 France 0
12 Estonia Estonia 0 Portugal -3
13 Greece Greece 0 Greece 0
14 Italy Italy 0 Italy 0
15 Japan Japan 0 Japan 0
TABLE 11
From GGGI- 4 components to GGGI- 5 components adding Time Use
RANK GGGI - no trunc -4 COMP. GGGI – no trunc - 5 COMP.
∆
1 Finland Finland 0 2 Norway Norway 0 3 Sweden Sweden 0 4 Uk Germany 1 5 Germany Canada 3 6 Usa Uk -2 7 Spain Spain 0 7 Canada Usa -2 9 Estonia Estonia 0 10 Slovenia Slovenia 0 10 France France 0 12 Portugal Portugal 0 13 Greece Italy 0 14 Italy Japan 0 15 Japan TABLE 12From GGGI with WEF weights to GGGI with SEM loadings RANK GGGI WEF 5 COMPON GGGI SEM 5 COMP
∆
1 Finland Finland 0 2 Norway Norway 0 3 Sweden Sweden 0 4 Germany Estonia 5 5 Canada Canada 0 6 Uk Spain 1 7 Spain Germany -3 7 Usa Usa 0 9 Estonia Slovenia 1 10 Slovenia Uk -3 10 France France 0 12 Portugal Japan 2 13 Italy Italy 0 14 Japan Portugal -2The most evident and interesting case is Estonia, which jumps complexively of 8 positions up, directly behind the top three. As showed in tables 10 and 12, it benefits both by elimining truncation and by introducing SEM weights. Canada instead, earns positions introducing the fifth Time Use related dimention. Finally Germany, UK and Portugal fall in the ranking for the reasons already explained above.
TABLE 13
From the original GGGI (truncated, 4 components, WEF weights) to the final GGGI (not truncated, 5 components, SEM weights)
RANK GGGI WEF original
GGGI SEM 5 COMP.NO -TRUNC
∆
1 Norway Finland 1 2 Finland Norway -1 3 Sweden Sweden 0 4 Germany Estonia 8 5 Spain Canada 3 6 Uk Spain -1 7 Usa Germany -3 7 Canada Usa -1 9 Portugal Slovenia 1 10 Slovenia Uk -4 10 France France 0 12 Estonia Japan 2 13 Greece Italy 0 14 Italy Portugal -5 15 JapanAs conclusive remarks, we do not believe that a unique perfect index to measure gender gap exists.
Anyway, some progress can be done, first of all restricting the focus of the analysis to smaller homogeneous groups of countries, deepening their cultural-social framework and selecting critical factors apt to explain the gender gap persistence.
Furthermore, we consider the truncation as an important loss of information. Women and men overtakings or advantages in specific context must be explored and understood rather then hidden.
Finally, the introduction of SEM clearly gives some nourishmnent for thought, showing how different weights are liable to upset the ranking.
In future, we intend to explore also the relative impact of each latent dimension on the gender gap, through Structural Equation Models or other techniques for latent variables, such as Causal Models and Graphical Models.
ACKNOWLEDGEMENTS
The authors are greateful to Lucia Pasquini for the invitation to participate into this special issue, thus providing the right impetus to finish this work. Thanks are also due to Patrizia Farina for stimulating discussions and precious advice.
REFERENCES
K.BARNES, N. BOUCHAMA (2011). Shifting wealth, shifting gender relations? Gender
inequality and social cohesion in a converging world.
http://www.oecd.org/dev/perspectivesonglobaldevelopment/48619715.pdf
K.A.BOLLEN, (1989). Structural Equations with Latent Variables. Wiley, New York.
S.CALIGARIS,F.MECATTI (2011). Quel certo genere di statistica. Sis-Magazine.
www.sis-statistica.it/magazine/spip.php?article209
P.M.BENTLER, D.G.BONETT, (1980). Significance tests and goodness-of-fit in the analysis of
covariance structures. Psychological Bulletin, no. 88, pp. 588-600.
B. CHIANDOTTO, (1992). Errori nelle variabili e variabili latenti in modelli strutturali
stocastici. Statistica, no. 52 (3).
D.A. KENNY, (2003). Effects of the number of variables on measures of fit in structural
equation modelling. Structural Equation Modeling, n. 10, pp. 333-3511.
F. MECATTI , F. CRIPPA, P. FARINA, (2012). A Special Gen(d)re of Statistics: Roots,
Development and Methodological Prospects of a Gender Statistics. International Statistical Review, no. 80, pp. 452-467.
Y.ROSSEEL, (2012). lavaan: An R Package for Structural Equation Modeling. Journal of
Statistical Software, no. 48(2), pp. 1-36.
H.-R.TYSON,L.D.ZAHIDI, (2011). The Global Gender Gap Report 2011. World Economic
Forum, www.weforum.org
OECD,(2008). Handbook on Constructing Composite Indicators: methodology and user guide. www.oecd.org/publishing/corrigenda
http://lavaan.ugent.be/
www.oecd.org/social/family/database http://apps.who.int/gho/data/
SUMMARY
A Narrower Perspective? From a Global to a Developed-Countries Gender Gap Index: a Gender Statistics Excercise
In this paper, we focus our attention on a particular composite index of gender equality, the Global Gender Gap Index (GGGI), highlighting problematics and weaknesses and proposing a different approach structured in four steps. The starting point of our analysis is to narrow the research to a small group of OECD countries: in this way it is possible to lower the gender analysis in a homogeneous socio-cultural framework and introduce a fifth dimension related to the time use. Next, to explore which variables have a greater impact on the gender gap persistence among these countries, we propose a different weighting method, based on the structural equation modeling (SEM). Through the study of official data, the effects of these steps on the final ranking of countries were then analyzed, allowing reflections from both the methodological and socio-cultural point of view.