Article
Statistical Analysis of Mineral Concentration for the
Geographic Identification of Garlic Samples from
Sicily (Italy), Tunisia and Spain
Rossella Vadalà1, Antonio F. Mottese1, Giuseppe D. Bua1, Andrea Salvo1,*,
Domenico Mallamace1, Carmelo Corsaro2,3, Sebastiano Vasi3, Salvatore V. Giofrè4, Maria Alfa1, Nicola Cicero1,5,* and Giacomo Dugo1,5,*
1 Department of Biomedical and Dental Sciences and Morphofunctional Imaging, University of Messina, V.le F. Stagno d’Alcontres 31, Messina 98166, Italy; [email protected] (R.V.); [email protected] (A.F.M.); [email protected] (G.D.B.); [email protected] (D.M.); [email protected] (M.A.)
2 IPCF- CNR of Messina, Viale F. Stagno d’Alcontres 37, Messina 98158, Italy; [email protected]
3 MIFT Department Physics Section, University of Messina, Viale F. S. d’Alcontres 31, Messina 98166, Italy; [email protected]
4 Department of Chemical Sciences, Biological, Pharmaceutical and Environmental, University of Messina, Via SS. Annunziata, Messina 98168, Italy; [email protected]
5 Science4life srl, Academic Spin-off, Università di Messina, Viale F. Stagno d’Alcontres 31, Messina 98166, Italy
* Correspondence: [email protected] (A.S.); [email protected] (N.C.); [email protected] (G.D); Tel.: +39-090-6765-180
Academic Editor: Emilie Combet
Received: 18 January 2016; Accepted: 4 March 2016; Published: 15 March 2016
Abstract:We performed a statistical analysis of the concentration of mineral elements, by means of inductively coupled plasma mass spectrometry (ICP-MS), in different varieties of garlic from Spain, Tunisia, and Italy. Nubia Red Garlic (Sicily) is one of the most known Italian varieties that belongs to traditional Italian food products (P.A.T.) of the Ministry of Agriculture, Food, and Forestry. The obtained results suggest that the concentrations of the considered elements may serve as geographical indicators for the discrimination of the origin of the different samples. In particular, we found a relatively high content of Selenium in the garlic variety known as Nubia red garlic, and, indeed, it could be used as an anticarcinogenic agent.
Keywords:Nubia Red Garlic; ICP-MS; PCA; multi-element profile; geographic origin; anticarcinogenesis
1. Introduction
Garlic (Allium sativum L.) and garlic supplements are consumed in many cultures for their healthy effects on different alimentary disorders and infections, and have been since the ancient times [1]. The beneficial effects on human health are mainly provided by the organosulfur compounds [2]. Nubia red garlic (NRG), belongs to the Liliaceae family, and, in particular, to the Allium Sativum species. NRG is a Sicilian garlic variety and its name derives from the intense red color of the robes of its bulbils and from the denomination of the geographic area: the small district of Nubia (Paceco, Trapani) in western Sicily (Italy). In fact, the production area of NRG falls within the region of Paceco and is in a protected area: the natural reserve named “Saline di Trapani e Paceco” (SIC, ITA01007) in Northwestern Sicily, but also extends to the neighboring area of Trapani, Marsala, Buseto Palizzolo, Valderice, and Erice.
Paceco is a small rural Centre (58 km2) and it is considered a “clean area”, because there are not industrial centres and vehicular traffic is extremely low; the local economy is based on agriculture. The soils evolve from clay rocks with a clay content of 40% to 45% (regosols) to soils of considerable
Foods 2016, 5, 20 2 of 11
thickness and uniformity characterized by deep cracks in summer (vertisols) [3]. The climate can be defined as semi-arid with average annual rainfall of about 500 mm.
Note that the NRG has been officially added to the list of traditional Italian food products (PAT) of the Ministry of Agriculture, Food, and Forestry (M.D. 5/06/2014). NRG usually possesses a variable number (8 to 14) of tunics that are distinguished in externals (sterile tunics) with ivory-pink color that serves as protection for the cloves and internally (fertile tunics) with winey-red color from which the bulbils are formed. The bulbils are close together showing a convex dorsal surface [4].
In this paper we traced, by means of inductively coupled plasma mass spectrometry (ICP-MS), the multi-element profiles of several garlic samples of different geographical area. In the literature, there are many scientific reports of ICP-MS analysis for the determination of mineral concentration in food matrices including garlic [5–11]. Furthermore, nowadays there is great attention paid to the discrimination of protected foodstuffs [12–14]. We evaluated the statistically significant differences among the garlic samples using chemometric analyses. Furthermore, we employed Principal Component Analysis (PCA) to correlate each garlic sample to its corresponding geographic area. This approach is able to discriminate among different garlic samples depending on their mineral profiles. Finally, the concentration of some specific elements can be used to assess the quality of a specific cultivar. For example, the high level of selenium found in NRG samples suggests the ability of the corresponding garlic cultivar to block (or prevent) carcinogenesis [15,16]. Note that the presence of this element is strongly related to the compositional nature of the cultivation soil. Indeed, several Se-compounds can be found within garlic samples displaying many different beneficial health effects [17].
2. Materials and Methods 2.1. Sampling
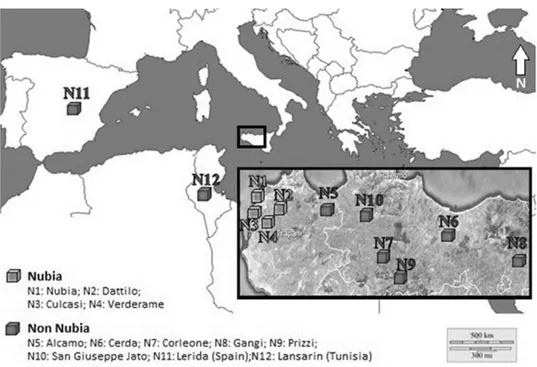
We analyzed a total of 120 garlic samples: 40 were labeled as NRG samples and 80 as “Non Nubia” samples, following the indication reported in the introduction. Figure1shows their different areas of origin and Table1reports some general related information.
Paceco is a small rural Centre (58 km2) and it is considered a “clean area”, because there are not
industrial centres and vehicular traffic is extremely low; the local economy is based on agriculture. The soils evolve from clay rocks with a clay content of 40% to 45% (regosols) to soils of considerable thickness and uniformity characterized by deep cracks in summer (vertisols) [3]. The climate can be defined as semi-arid with average annual rainfall of about 500 mm.
Note that the NRG has been officially added to the list of traditional Italian food products (PAT) of the Ministry of Agriculture, Food, and Forestry (M.D. 5/06/2014). NRG usually possesses a variable number (8 to 14) of tunics that are distinguished in externals (sterile tunics) with ivory-pink color that serves as protection for the cloves and internally (fertile tunics) with winey-red color from which the bulbils are formed. The bulbils are close together showing a convex dorsal surface [4].
In this paper we traced, by means of inductively coupled plasma mass spectrometry
(ICP-MS), the multi-element profiles of several garlic samples of different geographical area. In the literature, there are many scientific reports of ICP-MS analysis for the determination of mineral concentration in food matrices including garlic [5–11]. Furthermore, nowadays there is great attention paid to the discrimination of protected foodstuffs [12–14]. We evaluated the statistically significant differences among the garlic samples using chemometric analyses. Furthermore, we employed Principal Component Analysis (PCA) to correlate each garlic sample to its corresponding geographic area. This approach is able to discriminate among different garlic samples depending on their mineral profiles. Finally, the concentration of some specific elements can be used to assess the quality of a specific cultivar. For example, the high level of selenium found in NRG samples suggests the ability of the corresponding garlic cultivar to block (or prevent) carcinogenesis [15,16]. Note that the presence of this element is strongly related to the compositional nature of the cultivation soil. Indeed, several Se-compounds can be found within garlic samples displaying many different beneficial health effects [17].
2. Materials and Methods
2.1. Sampling
We analyzed a total of 120 garlic samples: 40 were labeled as NRG samples and 80 as “Non Nubia” samples, following the indication reported in the introduction. Figure 1 shows their different areas of origin and Table 1 reports some general related information.
Figure 1. Geographic localization of Nubia and Non Nubia garlic samples.
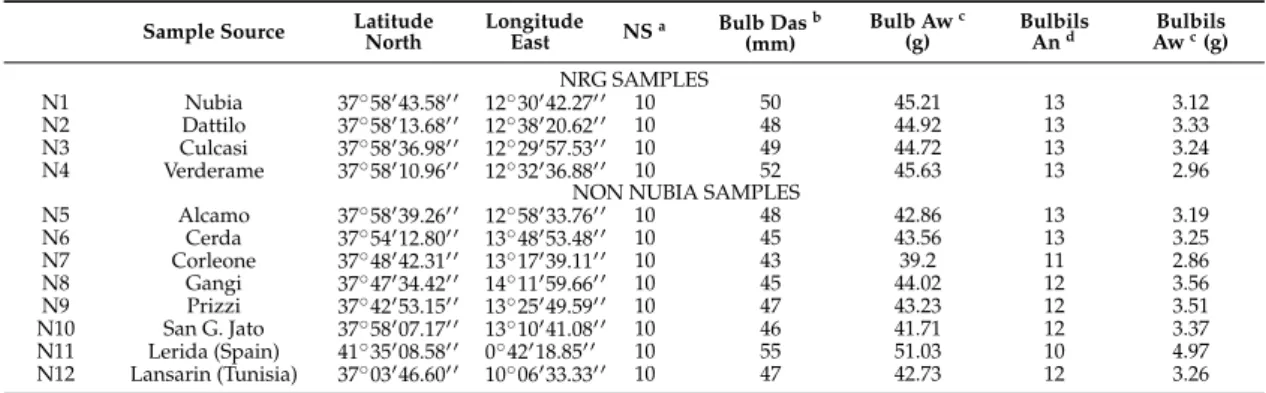
Table 1.General information about the studied garlic samples.
Sample Source LatitudeNorth LongitudeEast NSa Bulb Dasb
(mm) Bulb Awc (g) Bulbils And AwBulbilsc(g) NRG SAMPLES N1 Nubia 37˝58143.581 1 12˝30142.271 1 10 50 45.21 13 3.12 N2 Dattilo 37˝58113.681 1 12˝38120.621 1 10 48 44.92 13 3.33 N3 Culcasi 37˝58136.981 1 12˝29157.531 1 10 49 44.72 13 3.24 N4 Verderame 37˝58110.961 1 12˝32136.881 1 10 52 45.63 13 2.96
NON NUBIA SAMPLES
N5 Alcamo 37˝58139.261 1 12˝58133.761 1 10 48 42.86 13 3.19 N6 Cerda 37˝54112.801 1 13˝48153.481 1 10 45 43.56 13 3.25 N7 Corleone 37˝48142.311 1 13˝17139.111 1 10 43 39.2 11 2.86 N8 Gangi 37˝47134.421 1 14˝11159.661 1 10 45 44.02 12 3.56 N9 Prizzi 37˝42153.151 1 13˝25149.591 1 10 47 43.23 12 3.51 N10 San G. Jato 37˝58107.171 1 13˝10141.081 1 10 46 41.71 12 3.37 N11 Lerida (Spain) 41˝35108.581 1 0˝42118.851 1 10 55 51.03 10 4.97 N12 Lansarin (Tunisia) 37˝03146.601 1 10˝06133.331 1 10 47 42.73 12 3.26
aNS, Number of Samples;bdas, diameter average size;caw, average weight;dan, average number.
All garlic samples were harvested during the last crop season. We divided the analyzed garlic samples into two main groups. The first group named “Nubia” is composed of NRG samples (of certified origin) coming from the district of Paceco and from other neighboring areas (Dattilo, Culcasi, Verderame). The second group named “Non Nubia” is composed of garlic samples of various cultivar coming from different areas of Sicily (S. Giuseppe Jato, Corleone, Prizzi, Gangi, Alcamo, Cerda), from Lerida (Spain) and Lansarin (Tunisia). Lerida is a town located 160 km west of Barcelona whereas Lansarin is a hilly area located 30 km north of Tunis. The ICP-MS analyses were performed just on the edible part of the garlic without its internal bud.
2.2. Study Site
Garlic is a bulbiferous vegetable growing underground; therefore, it absorbs the minerals present in the soil. Indeed, garlic’s multi-elemental profile is strongly dependent on the composition of the soil and is mainly linked to the geological structure and soil quality of the origin site. Relative to the analyzed garlic samples, all Nubia samples come from the Paceco geographic area located in the southeast of Trapani. The soil is prevalently clayey a with high content of potassium and a low content of organic matter [18]. The other Sicilian (Non Nubia) garlic samples originate from the geographic area between Palermo (Cerda, Corleone, Gangi, Prizzi and S. Giuseppe Jato) and Trapani (Alcamo) [19]. These places are characterized by clay soils, except for Gangi, which displays a mainly arenaceous clay. The Spanish samples come from Lerida which is characterized by sandy soils with high levels of iron [20]. The Tunisian samples come from Lansarin, which is characterized by clayey soil with high iron concentration [21].
2.3. Chemicals and Standard Solution
High purity gases (99.9990% argon and 99.9995% helium) were supplied by Rivoira (Rivoira S.p.A., Milan, Italy). Suprapure concentrated acids (65% v/v nitric acid and 30% v/v hydrogen peroxide, J.T. Backer, Mallinckrodt Backer, Milan, Italy) were used to digest the samples. High purity water with resistivity of 10 MΩ cm (J.T. Backer, Mallinckrodt Backer, Milan, Italy) was used throughout.
Stock standard solution (1 g/L in 2% of nitric acid) of each element under investigation (Cr, Ni, Cu, As, Se, Sb, Ba, Pb, Zn, Fe, Mg, Ca, Al, Na, K) were purchased from Fluka, Milan, Italy and (Mn and Cd) from Merck, Darmstadt, Germany. Standard solutions of Sc, Bi, In, Ge (1 g/L in 2% nitric acid) were purchased from Fluka (Milan, Italy) and were used as on-line internal standards (at the level of 1 mg/L) to correct for instrumental drift and variation due to the matrix.
To tune the instrument, an ICP-MS tuning solution containing 1 mg/L of 7Li, 59Co, 80Y and 205Tl in 2% HNO3was obtained from Agilent (Santa Clara, CA, USA). Calibration standards were
prepared at concentration ranges suitable for the analytes being investigated: from 0.020 to 2 mg/kg for the elements Al, As, Cd, Cr, Sb, Pb, Se; from 0.020 to 5 mg/kg for the elements Ba, Cu, Ni; from
0.5 to 50 mg/kg for the elements Ca, Fe, K, Mg, Mn, Na, Zn. The calibration curves were obtained by using five standard solutions. The internal Re standard was prepared at 0.8 µg/L. Before use, glassware was washed with 5% HNO3for at the least 12 h, rinsed with ultrapure water, and then dried.
Accuracy and precision were assessed by analysing the certified standard matrices: rice flour (NIST SRM 1568a) [22]; spinach leaves (NIST SRM 1570a); cabbage powder (IAEA-359).
2.4. Sample Preparation
Approximately 0.5 g of fresh garlic was firstly added with 1 mL of internal Re standard at 0.8 µg/L, and then were digested with 8 mL of HNO3(65% v/v) and 2 mL of H2O2(30% v/v) in acid-prewashed
PTFE vessels. The mineralization was carried out with a microwave oven at constant power (1000 W). First the temperature was increased to 180˝C in 10 min (step 1), and then it was held at 180˝C for
another 10 min (step 2). After cooling down to room temperature, the digested samples were weighed. Then, 500 mg were transferred into pre-cleaned 50 mL volumetric flasks and diluted until the mark using deionized water. Finally, they were stored at 4˝C before acquisition.
2.5. Instrumentation
We obtained the mineralization of garlic samples by means of Ethos 1 (Milestone, Bergamo, Italy), a closed-vessel microwave digestion system equipped with sensors for temperature and pressure. The ICP-MS instrument used for the element determination is an Agilent 7500cx (Agilent Technologies, Santa Clara, CA, USA) with an MS spectrometer powered by a 27.12 MHz radiofrequency solid-state generator at 1500 W. The ICP-MS was equipped with a MicroMist glass concentric pneumatic nebulizer coupled with a cooled Scott double pass type spray chamber made of quartz. The ICP torch was a classic Fassel-type torch with wide diameter (2.5 mm) fitted with a shield torch system. Ni sampler and skimmer cones of 1.0 mm and 0.4 mm were used. An octopole collision/reaction system with helium gas was used to minimize polyatomic interferences resulting from plasma and matrix.
The equipment is provided with an off-axis ion lens, a quadrupole mass analyzer, and an electron multiplier detector. Our instrument also includes an auto sampler ASX520 (Cetac Technologies Inc., Omaha, NE, USA) and an integrated sample introduction system.
2.6. ICP-MS Analysis
ICP-MS is one of the most sensitive analytical techniques for fast multi-element determination of mineral elements at trace and ultra-trace concentrations in different sample matrices. The use of ICP-MS as a simultaneous multi-element detection method presents excellent selectivity and also offers high sensitivity [23]. In this paper, the instrument was tuned to achieve the best compromise between high intensities and low yields of oxidized and doubly charged ions. The operating conditions were optimized to obtain the highest signal-to-noise ratio for7Li,59Co,115In, and238U along with140Ce,
16O/140Ce < 2.5% and140Ce and16O < 5%. In particular, we used: RF power, 1500 W; plasma gas flow
rate, 15 L/min; auxiliary gas flow rate, 0.9 L/min; carrier gas flow rate 1.1 L/min; helium collision gas flow rate, 4 mL/min; spray chamber temperature, 2˝C; sample depth, 9 mm; sample introduction flow
rate 1 mL/min; nebulizer pump, 0.1 rps; extract lens 1 voltage, 1.5 V. The instrument in no gas-mode for Mn, Pb, Zn, Ca, Na, K, Ba and in helium mode for Cr, Ni, As, Se, Cd, Fe, Cu, Sb, Al to remove spectral interferences has been used. Monitored isotopes were24Mg,23Na,27Al,39K,44Ca,52Cr,55Mn,
57Fe,60Ni,63Cu,66Zn,75As,77Se,111Cd,121Sb,137Ba,206Pb,207Pb,208Pb. As mentioned above, these
isotopes were chosen to maximize sensitivity and to minimize interferences due to the matrix. The internal standards used were: 45Sc for Al, Na, Mg, K, Ca, Cr, Mn, Fe, Ni, Cu;72Ge for Zn, As, Se; 115In for Cd, Sb, Ba;209Bi for Pb. Integration times were 0.5 s/point for As, Cr, Cu, Ni, and Se, and
0.1 s/point for the other elements. Three points for each mass and three replicate acquisitions were taken to integrate the peaks.
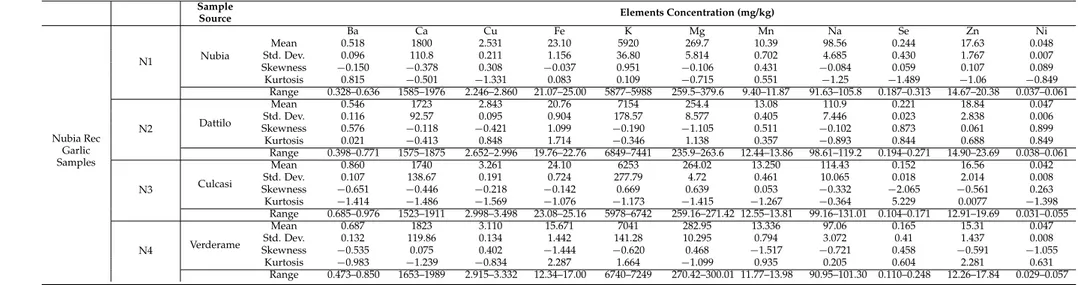
Table 2.General information about the studied garlic samples.
Sample
Source Elements Concentration (mg/kg)
Nubia Rec Garlic Samples N1 Nubia Ba Ca Cu Fe K Mg Mn Na Se Zn Ni Mean 0.518 1800 2.531 23.10 5920 269.7 10.39 98.56 0.244 17.63 0.048 Std. Dev. 0.096 110.8 0.211 1.156 36.80 5.814 0.702 4.685 0.430 1.767 0.007 Skewness ´0.150 ´0.378 0.308 ´0.037 0.951 ´0.106 0.431 ´0.084 0.059 0.107 0.089 Kurtosis 0.815 ´0.501 ´1.331 0.083 0.109 ´0.715 0.551 ´1.25 ´1.489 ´1.06 ´0.849 Range 0.328–0.636 1585–1976 2.246–2.860 21.07–25.00 5877–5988 259.5–379.6 9.40–11.87 91.63–105.8 0.187–0.313 14.67–20.38 0.037–0.061 N2 Dattilo Mean 0.546 1723 2.843 20.76 7154 254.4 13.08 110.9 0.221 18.84 0.047 Std. Dev. 0.116 92.57 0.095 0.904 178.57 8.577 0.405 7.446 0.023 2.838 0.006 Skewness 0.576 ´0.118 ´0.421 1.099 ´0.190 ´1.105 0.511 ´0.102 0.873 0.061 0.899 Kurtosis 0.021 ´0.413 0.848 1.714 ´0.346 1.138 0.357 ´0.893 0.844 0.688 0.849 Range 0.398–0.771 1575–1875 2.652–2.996 19.76–22.76 6849–7441 235.9–263.6 12.44–13.86 98.61–119.2 0.194–0.271 14.90–23.69 0.038–0.061 N3 Culcasi Mean 0.860 1740 3.261 24.10 6253 264.02 13.250 114.43 0.152 16.56 0.042 Std. Dev. 0.107 138.67 0.191 0.724 277.79 4.72 0.461 10.065 0.018 2.014 0.008 Skewness ´0.651 ´0.446 ´0.218 ´0.142 0.669 0.639 0.053 ´0.332 ´2.065 ´0.561 0.263 Kurtosis ´1.414 ´1.486 ´1.569 ´1.076 ´1.173 ´1.415 ´1.267 ´0.364 5.229 0.0077 ´1.398 Range 0.685–0.976 1523–1911 2.998–3.498 23.08–25.16 5978–6742 259.16–271.42 12.55–13.81 99.16–131.01 0.104–0.171 12.91–19.69 0.031–0.055 N4 Verderame Mean 0.687 1823 3.110 15.671 7041 282.95 13.336 97.06 0.165 15.31 0.047 Std. Dev. 0.132 119.86 0.134 1.442 141.28 10.295 0.794 3.072 0.41 1.437 0.008 Skewness ´0.535 0.075 0.402 ´1.444 ´0.620 0.468 ´1.517 ´0.721 0.458 ´0.591 ´1.055 Kurtosis ´0.983 ´1.239 ´0.834 2.287 1.664 ´1.099 0.935 0.205 0.604 2.281 0.631 Range 0.473–0.850 1653–1989 2.915–3.332 12.34–17.00 6740–7249 270.42–300.01 11.77–13.98 90.95–101.30 0.110–0.248 12.26–17.84 0.029–0.057
Table 2. Cont.
Sample
Source Elements Concentration (mg/kg)
Non Nubia Samples N5 Alcamo Mean 0.211 1274 0.946 24.63 4349 245.56 7.529 94.13 0.196 9.249 0.122 Std. Dev. 0.023 235.94 0.062 1.423 307.04 25.529 0.356 11.96 0.003 1.495 0.015 Skewness ´0.754 ´0.541 ´0.491 ´0.462 0.557 1.554 ´0.777 ´1.874 ´0.221 1.047 0.765 Kurtosis ´1.082 ´3.232 ´2.295 ´2.462 ´2.457 2.322 ´2.242 3.74 ´1.317 1.998 0.182 Range 0.178´0.236 1010–1478 0.867–1.012 22.81–25.96 4080–4746 225.79–287.98 7.04–7.89 73.45–103.25 0.015–0.024 7.570–11.62 0.105–0.146 N6 Cerda Mean 0.332 1592 2.811 17.89 4663 277.53 12.204 100.698 0.045 8.993 0.468 Std. Dev. 0.11 95.30 0.127 0.183 138.701 10.368 1.18 1.493 0.015 2.653 0.337 Skewness ´0.794 ´0.446 ´1.533 0.605 0.044 ´0.621 ´0.806 0.487 ´0.235 0.053 ´0.552 Kurtosis ´1.833 ´0.263 2.388 ´1.601 ´1.927 ´1.011 ´1.703 ´0.463 ´0.922 ´2.5 ´3.216 Range 0.178–0.426 1456–1701 2.600–2.917 17.72–18.14 4522–4840 264.37–290.84 10.54–13.25 98.98–102.81 0.025–0.064 5.923–12.00 0.066–0.117 N7 Corleone Mean 0.220 1515 2.201 13.74 3442 248.57 11.045 119.20 0.045 8.113 0.057 Std. Dev. 0.042 176.35 0.274 0.192 573.01 29.681 0.606 3.529 0.014 0.686 0.022 Skewness 0.188 ´1.303 0.307 0.277 0.461 ´1.938 0.424 ´0.531 ´0.192 1.188 ´0.678 Kurtosis ´1.847 0.562 ´1.458 ´0.137 ´3.082 3.849 ´1.581 ´0.185 1.461 1.370 1.054 Range 0.175–0.275 1237–1636 1.875–2.560 13.50–14.01 2875–4087 197.00–269.31 10.41–11.86 114.11–123.21 0.025–0.065 7.500–9.200 0.024–0.084 N8 Gangi Mean 0.222 967.0 2.114 17.25 4304 294.78 8.815 84.075 0.028 9.515 0.112 Std. Dev. 0.083 56.51 0.179 0.228 353.74 7.382 0.241 30.256 0.008 1.282 0.031 Skewness 0.588 0.361 0.037 ´0.922 0.824 0.034 ´1.536 2.160 1.886 ´0.770 0.005 Kurtosis ´3.183 ´0.600 ´2.545 1,154 ´0.432 0.006 2.319 4.728 3.859 ´2.266 ´0.529 Range 0.150–0.320 899.0–1045 1.913–2.322 16.89–17.50 3981–4827 284.98–304.65 8.41–9.02 65.71–137.82 0.021–0.043 8.160–11.08 0.070–0.153 N9 Prizzi Mean 0.190 1016 1.959 13.70 4294 275.36 10.197 135.75 0.05 6.628 0.073 Std. Dev. 0.032 63.90 0.098 0.371 244.41 16.544 0.476 10.43 0.0190 0.679 0.015 Skewness ´0.353 0.473 ´1.919 ´1.429 0.071 ´1.709 0.825 ´0.265 ´1.185 1.651 0.363 Kurtosis ´2.309 ´2.158 4.050 2.113 ´2.73 3.161 ´1.096 ´1.517 1.658 3.099 ´2.662 Range 0.150–0.225 947.0–1098 1.787–2.040 13.08–14.00 4023–4566 247.25–289.20 9.77–10.88 121.86–147.21 0.019–0.070 6.016–7.777 0.056–0.092 N10 San G. Jato Mean 0.211 1447 1.806 14.23 3029.4 184.20 10.489 113.90 0.067 11.69 0.061 Std. Dev. 0.028 76.10 0.040 0.526 59.79 3.99 0.531 5.56 0.016 4.109 0.012 Skewness 0.316 0.900 1.740 0.885 1.529 0.742 ´0.003 0.829 ´0.334 2.066 ´1.519 Kurtosis ´2.156 0.918 3.256 ´0.734 2.561 ´0.573 ´2.31 0.992 ´2.132 4.335 2.445 Range 0.117–0.246 1365–1564 1.776–1.875 13.72–14.99 2980–3129 180.11–190.01 9.87–11.12 107.62–122.40 0.046–0.085 9.200–18.92 0.040–0.071 N11 Spain Mean 0.216 804.6 0.960 25.10 2898 164.08 6.347 132.46 0.03 10.23 0.669 Std. Dev. 0.086 107.16 0.144 0.260 185.30 10.13 0.399 34.548 0.01 2.446 0.262 Skewness 1.275 0.419 0.802 0.640 ´0.845 ´0.379 0.489 0.099 0.343 ´0.376 ´1.284 Kurtosis 2.721 ´1.375 0.317 ´0.393 ´0.306 0.651 ´1.549 ´2.34 ´0.457 ´0.245 1.567 Range 0.098–0.415 675.0–982.0 0.764–1.245 24.78–25.57 2537–3088 145.96–181.52 5.92–6.98 96.52–176.21 0.015–0.051 6.160–13.94 0.092–0.910 N12 Tunisia Mean 0.187 698.2 1.137 29.97 3268 270.61 10.173 97.55 0.017 9.350 0.651 Std. Dev. 0.089 64.418 0.158 0.326 201.8 10.976 0.577 5.555 0.005 2.785 0.299 Skewness 0.112 0.422 0.381 2.285 ´0.074 0.385 ´0.549 ´1.089 1.05 0.637 ´1.373 Kurtosis ´1.978 ´1.560 ´1.031 5.813 ´0.993 0.083 0.171 1.743 0.188 ´0.825 0.558 Range 0.105–0.300 618.0–798.0 0.957–1.412 29.69–30.81 2968–3555 251.54–288.28 9.02–10.84 85.27–104.25 0.012–0.027 5.94–13.74 0.102–0.910
The effects of40Ar,35Cl on75As, and of44Ca,16O and43Ca,16OH on60Ni were checked and the interferences were corrected by elemental interference equations. Besides, the isotopic variability in Pb was corrected by elemental interference equation. These equations, reported in various EPA methods and applied by the instrument software (ICP-MS ChemStation B.03.07, Waldbronn, Germany), contain the naturally occurring isotope ratios of elements and allow the subtraction of isobaric or polyatomic interferences.
2.7. Statistical Methods
All statistical calculations were made by IBM SPSS Statistics, Version 21 software package. The starting matrix was constituted by 120 rows corresponding to all the analyzed garlic samples and by 11 columns (variables) representing the concentration of the observed elements (Ba, Ca, Cu, Fe, K, Mg, Mn, Na, Se, Zn, Ni) that we found in our samples. For the preliminary statistical analysis, the data were grouped into 12 categories according to the geographic origin of samples. We calculated the average, the standard deviation, the skewness, and the kurtosis for each category. In particular, in this way we studied (i) the dispersion from the average by using the standard deviation (SD); (ii) the shape of the distribution of the collected data by means of the skewness; and (iii) a measure of the asymmetry and of the “peakedness” by means of the kurtosis. The obtained values are reported in Table2and confirm the goodness of the achieved data. Successively, the data in the starting matrix were subjected to Principal Component Analysis (PCA) in order to reduce data dimensionality and to cluster them depending on the total content of metals (see section Multivariate Statistical Analysis).
3. Results
3.1. Method Validation
According to international guidelines [24], the limit of detection (LOD), the limit of quantification (LOQ), the linearity, the accuracy, and the precision were determined to validate the method (Table3). LOD and LOQ were determined as 3.3 σ/S and 10 σ/S, respectively, where “σ” is the residual standard deviation and “S” is the slope of the regression curve. Nevertheless, since a garlic standard certified matrix for trace element determination was not found in commerce, the certified references used for validation were: rice flour (NIST SRM 1568a) [22]; spinach leaves (NIST SRM 1570a); cabbage powder (IAEA-359). Precision was estimated on the relative standard deviation of measurements obtained from 10 analyses of the same certified matrices under the same operating conditions. Table3shows that the detection and quantification limits are adequate for the analysis; the linearity was good with R2ě0.9991, the accuracy and precision were also sufficiently satisfactory. Note that the accuracy can vary from 80% to 120% depending on the ratio between the measured metals concentration and that certified by the producer of the analysed matrix.
3.2. Multi-Element Profile of Garlic Samples
Table2shows the descriptive statistics on the trace elements that we detected in our garlic samples, grouped for sampling area. We did not report any values for As, Pb, Cd, Cr, Sb, or Al because their concentration was below the LOD. Nickel (Ni) was the only toxic element detected in all the studied samples. As it is well known, Ni at high doses has a toxic effect on human health. For example, the oral median lethal dose of nickel acetate was 350 mg/kg in rats and 420 mg/kg in mice [25,26]. However, the Nickel concentration found in all garlic samples are very low and cannot cause any injury to human health.
Indeed, Nickel concentration could serve as a biomarker for geographical origin. In fact, from the inspection of Table2, the garlic samples coming from Tunisia and Spain possess the highest Ni level. Moreover, particularly significant is the comparison between Selenium (Se) levels in the analyzed samples. The concentration of this element is higher in NRG samples compared to Non Nubia samples.
Table 3.Analytical performance of the method.
Element Isotope LODa
(mg/kg) LOQ b (mg/kg) Calibration Range (mg/kg) R2 c Precision (SDR%, n = 10)d Accuracy e (%) Al 27 0.015 0.052 0.020–2 0.9998 2.9 85.63 As 75 0.010 0.035 0.020–2 0.9996 2.6 89.78 Ba 137 0.015 0.052 0.020–5 0.9999 3.7 90.71 Ca 44 0.017 0.059 0.5–50 0.9993 2.9 101.54 Cd 111 0.018 0.063 0.020–2 0.9999 2.7 94.53 Cr 52 0.011 0.038 0.020–2 0.9998 2.4 91.78 Cu 63 0.018 0.063 0.020–5 0.9999 2.1 86.56 Fe 57 0.017 0.059 0.5–50 0.9999 2.2 96.54 K 39 0.016 0.056 0.5–50 0.9991 3.6 102.31 Mg 24 0.015 0.052 0.5–50 0.9993 3.3 101.44 Mn 55 0.014 0.049 0.5–50 0.9999 2.9 102.9 Na 23 0.016 0.056 0.5–50 0.9997 2.6 86.76 Ni 60 0.010 0.035 0.020–5 0.9999 3.2 83.32 Sb 121 0.012 0.042 0.020–2 0.9999 2.8 93.68 Pb 208 0.011 0.038 0.020–2 0.9999 2.1 94.37 Se 77 0.010 0.035 0.020–2 0.9995 2.5 85.89 Zn 66 0.016 0.056 0.5–50 0.9999 3.1 97.32
aLOD, limit of detection (3.3 σ/S);bLOQ, limit of quantification (10 σ/S);cR2, least square regression coefficient;
dSDR, Standard Deviation Ratio;eAverage of 10 replicates.
3.3. Multivariate Statistical Analysis
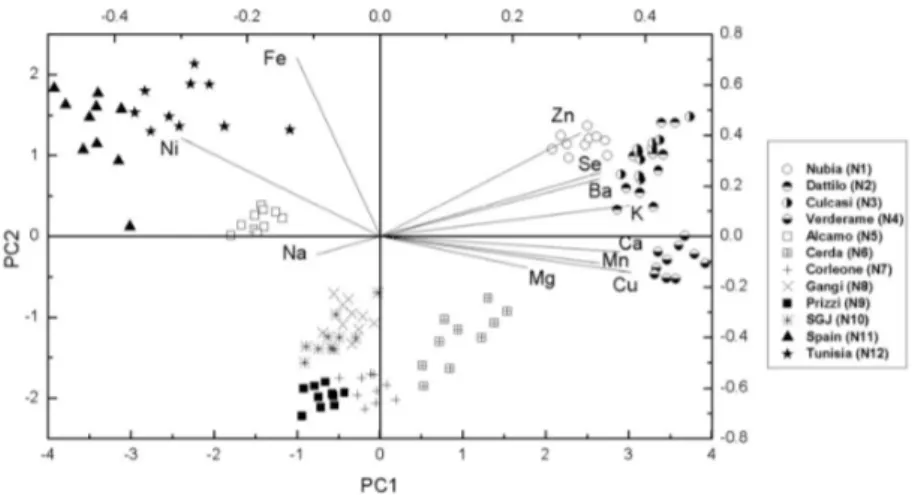
As mentioned before, we performed a multivariate statistical analysis in terms of the Principal Components Analysis (PCA). It is an “unsupervised” statistical method that can reduce data dimensionality and allows data clustering with respect to the considered variables. Data were mean-centered and the singular value decomposition (SVD) algorithm was applied to perform a PCA with cross validation. The PCA technique allowed the reduction of the data dimensionality from 11 to 2 with a variance percentage higher than 70%. Figure2reports the resulting score plot, together with the corresponding loadings (top and right axes), of the first two principal components (PC1 vs. PC2). The score plot illustrates how this kind of analysis is able to discriminate the different garlic species, being able to cluster and group the sample depending on the relative content of metals. The corresponding loadings plot (top and right axes of Figure2) is used to identify the bases of the clustering. In particular, samples from Nubia (N1) and Dattilo (N2) can be mainly discriminated because they show the highest levels of Zn and Se. In fact, as shown in Table2, for these samples the average concentration of Zn is 17.63 and 18.84 mg/kg, and the average concentration of Se is 0.244 and 0.221 mg/kg, respectively. Samples from Culcasi (N3) show the highest content of Ba and Cu (0.860 and 3.261 mg/kg, respectively) whereas those from Verderame (N4) show the highest content of Ca and Mn: 1823 and 13.336 mg/kg, respectively. Finally, note that the samples from Spain and Tunisia show the highest content of Fe (25.10 and 29.97 mg/kg, respectively) and Ni (0.669 and 0.651 mg/kg, respectively).
Foods 2016, 5, x 9 of 12
analyzed samples. The concentration of this element is higher in NRG samples compared to Non Nubia samples.
3.3. Multivariate Statistical Analysis
As mentioned before, we performed a multivariate statistical analysis in terms of the Principal Components Analysis (PCA). It is an “unsupervised” statistical method that can reduce data dimensionality and allows data clustering with respect to the considered variables. Data were mean-centered and the singular value decomposition (SVD) algorithm was applied to perform a PCA with cross validation. The PCA technique allowed the reduction of the data dimensionality from 11 to 2 with a variance percentage higher than 70%. Figure 2 reports the resulting score plot, together with the corresponding loadings (top and right axes), of the first two principal components (PC1 vs. PC2). The score plot illustrates how this kind of analysis is able to discriminate the different garlic species, being able to cluster and group the sample depending on the relative content of metals. The corresponding loadings plot (top and right axes of Figure 2) is used to identify the bases of the clustering. In particular, samples from Nubia (N1) and Dattilo (N2) can be mainly discriminated because they show the highest levels of Zn and Se. In fact, as shown in Table 2, for these samples the average concentration of Zn is 17.63 and 18.84 mg/kg, and the average concentration of Se is 0.244 and 0.221 mg/kg, respectively. Samples from Culcasi (N3) show the highest content of Ba and Cu (0.860 and 3.261 mg/kg, respectively) whereas those from Verderame (N4) show the highest content of Ca and Mn: 1823 and 13.336 mg/kg, respectively. Finally, note that the samples from Spain and Tunisia show the highest content of Fe (25.10 and 29.97 mg/kg, respectively) and Ni (0.669 and 0.651 mg/kg, respectively).
Figure 2. Score (left and bottom axes) and loadings (right and top axes) plot showing the results of the PCA performed on all the analyzed garlic samples.
4. Discussion
On average, garlic contains approximately 65% water, 28% carbohydrates (fructans), 2.3% organosulfur compounds, 2% proteins (alliinase), 1.2% free amino acids (e.g., arginine) and 1.5% fibers. Allicin is the main active substance that is responsible for the typical pungent smell and for garlic’s therapeutic properties [27–29]. When fresh garlic is chopped or crushed, alliin (a sulfoxide that is a natural constituent of fresh garlic) transforms into allicin by the action of an enzyme called alliinase. However, allicin is an unstable compound and easily oxidable into a series of other sulfur-containing compounds such as diallyl disulfide. Furthermore, for condensation reactions, allicin can be converted into ajoenes [30], into vinyldithiins [31], and into thiosulfinates that also have a good
Figure 2.Score (left and bottom axes) and loadings (right and top axes) plot showing the results of the PCA performed on all the analyzed garlic samples.
4. Discussion
On average, garlic contains approximately 65% water, 28% carbohydrates (fructans), 2.3% organosulfur compounds, 2% proteins (alliinase), 1.2% free amino acids (e.g., arginine) and 1.5% fibers. Allicin is the main active substance that is responsible for the typical pungent smell and for garlic’s therapeutic properties [27–29]. When fresh garlic is chopped or crushed, alliin (a sulfoxide that is a natural constituent of fresh garlic) transforms into allicin by the action of an enzyme called alliinase. However, allicin is an unstable compound and easily oxidable into a series of other sulfur-containing compounds such as diallyl disulfide. Furthermore, for condensation reactions, allicin can be converted into ajoenes [30], into vinyldithiins [31], and into thiosulfinates that also have a good curative action [32]. Besides allicin, garlic contains different compounds able to produce many beneficial effects for health. For this reason, garlic is used not only as flavoring but also for healing in many cultures [33].
The overall results of our analysis show that the application of Principal Component Analysis to the measured minerals content allows for sample discrimination. Samples of NRG show an average content of Se, K, Zn, and Ca that is higher than Non Nubia samples and an extremely low Ni concentration, especially if compared with samples from Spain and Tunisia. Note that just the Selenium levels are one order of magnitude higher in NRG samples. Since many healthy beneficial effects of garlic are related to the presence of different Seleno-compounds [17], this suggests the use of garlic and in particular of that coming from the Paceco district for preventing or blocking carcinogenesis. In fact, the association between reduced risk in intestinal cancer and high intake of garlic was investigated by the European prospective investigation into cancer and nutrition (EPIC). Several epidemiological studies suggest that the consumption of garlic and related allium foods reduces the risk of certain cancer types, including those of the gastrointestinal tract [34,35]. The potential benefits of garlic as an anticancer agent is indeed mainly due to its ability to accumulate Selenium, which is a cancer fighting mineral.
5. Conclusions
In this work, we determined the multi-elemental profiles of different garlic samples by ICP-MS analysis in order to individuate through a multivariate statistical analysis which elements may be considered as geographic indicators for the discrimination of origin. We analyzed four garlic varieties coming from the district of Paceco (TP, Sicily, Italy), known as Nubia Red Garlic (NRG) and certified as traditional Italian food products (P.A.T.) by the Ministry of Agriculture, Food, and Forestry [36], and compared with six other varieties coming from different places within Sicily and with two varieties coming from Spain and Tunisia. Garlic is widely consumed in different parts of the world and many studies report its healthy protective effect against many different diseases, independent of the specific cultivar and from the particular geographic origin of the garlic. The healthy effects of garlic depend on the level of some mineral elements, such as Se, K, Zn, and Ca. In particular, the high content of Selenium found in NRG samples identifies this element, not only as an indicator for the discrimination of geographic origin of this cultivar, but it is also useful to demonstrate that Nubia Red Garlic shows important health qualities and could be used as an anticarcinogenic agent.
Author Contributions:Rossella Vadalà and Giuseppe D. Bua: ICP-MS Analisys; Antonio F. Mottese: Geological study of the area; Andrea Salvo: ICP-MS Analisys and data processing; Domenico Mallamace, Sebastiano Vasi and Giacomo Dugo: obtaining samples; Carmelo Corsaro, Salvatore V. Giofrè and Maria Alfa: data processing; Nicola Cicero: ICP-MS Analisys, data processing and coordination of work writing.
Conflicts of Interest:The authors declare no conflict of interest.
Abbreviations
NRG Nubia Red Garlic
PAT Product agriculture Traditional
ICP-MS Inductively Coupled Plasma Mass Spectrometry
PCA Principal Components Analysis
LOD Limit of Detection
LOQ Limit of Quantification
SVD Singular Value Decomposition
PC Principal Component
References
1. Block, E. The chemistry of garlic and onions. Sci. Am. 1985, 252, 114–119. [CrossRef] [PubMed]
2. Ramaa, C.S.; Shirode, A.R.; Mundada, A.S.; Kadam, V.J. Nutraceuticals: An emerging era in the treatment and prevention of cardiovascular diseases. Curr. Pharm. Biotechnol. 2006, 7, 15–23. [CrossRef] [PubMed] 3. Catalano, R.; Lo Cicero, G. Guida alle escursioni-Vol 1-La Sicilia Occidentale. In Procceedings of
the 79˝Congresso Nazionale della Società Geologica Italiana, Palermo, Italy, 18–20 September 1998. 4. Lazzarini, E. Gli Ortaggi e le Piante Aromatiche; Hoepli: Milan, Italy, 2013.
5. Di Bella, G.; Potortì, A.G.; Lo Turco, V.; Bua, D.; Licata, P.; Cicero, N.; Dugo, G. Trace Elements In Thunnus Thynnus From Mediterranean Sea: Benefit-Risk Assessment For Consumer. Food Addit. Contam. 2015, 8, 175–181. [CrossRef] [PubMed]
6. Lo Turco, V.; Di Bella, G.; Furci, P.; Cicero, N.; Pollicino, G.; Dugo, G. Heavy metals content by ICP-OES in Sarda sarda, Sardinella aurita and Lepidopus caudatus from Straits of Messina (Sicily, Italy). Nat. Prod. Res. 2012, 27, 518–523. [CrossRef] [PubMed]
7. Naccari, C.; Cicero, N.; Ferrantelli, V.; Giangrosso, G.; Vella, A.; Macaluso, A.; Naccari, F.; Dugo, G. Toxic metals in pelagic, benthic and demersal fish species from Mediterranean FAO zone 37. Bull. Environ. Contam. Toxicol. 2015, 95, 567–573. [CrossRef] [PubMed]
8. Salvo, A.; Cicero, N.; Vadalà, R.; Mottese, A.F.; Bua, D.; Mallamace, D.; Giannetto, C.; Dugo, G. Toxic and essential metals determination in commercial seafood: Paracentrotus lividus by ICP-MS. Nat. Prod. Res. 2015, 30, 657–664. [CrossRef] [PubMed]
9. Salvo, A.; Potortì, A.G.; Cicero, N.; Bruno, M.; Lo Turco, V.; Di Bella, G.; Dugo, G. Statistical characterisation of heavy metal contents in Paracentrotus lividus from Mediterranean Sea. Nat. Prod. Res. 2014, 28, 718–726. [CrossRef] [PubMed]
10. Poldma, P.; Tonutare, T.; Viitak, A.; Luik, A.; Moor, U. Effect of Selenium Treatment on Mineral Nutrition, Bulb Size, and Antioxidant Properties of Garlic (Allium sativum L.). J. Agric. Food Chem. 2011, 59, 5498–5503. [CrossRef] [PubMed]
11. Camargo, A.B.; Resnizky, S.; Marchevsky, E.J.; Luco, J.M. Use of the Argentinean garlic (Allium sativum L.) germplasm mineral profile for determining geographic origin. J. Food Compos. Anal. 2010, 23, 586–591. [CrossRef]
12. Cicero, N.; Corsaro, C.; Salvo, A.; Vasi, S.; Giofre, S.V.; Ferrantelli, V.; Di Stefano, V.; Mallamace, D.; Dugo, G. The metabolic profile of lemon juice by proton HR-MAS NMR: The case of the PGI Interdonato Lemon of Messina. Nat. Prod. Res. 2015, 29, 1894–1902. [CrossRef] [PubMed]
13. Corsaro, C.; Mallamace, D.; Vasi, S.; Ferrantelli, V.; Dugo, G.; Cicero, N. H HR-MAS NMR Spectroscopy and the Metabolite Determination of Typical Foods in Mediterranean Diet. J. Anal. Methods Chem. 2015. [CrossRef] [PubMed]
14. Mallamace, D.; Corsaro, C.; Salvo, A.; Cicero, N.; Macaluso, A.; Giangrosso, G.; Ferrantelli, V.; Dugo, G. A multivariate statistical analysis coming from the NMR metabolic profile of cherry tomatoes (The Sicilian Pachino case). Phys. A 2014, 401, 112–117. [CrossRef]
15. Das, S. Garlic—A natural source of cancer preventive compounds. Asian Pac. J Cancer Prev. 2002, 3, 305–311. [PubMed]
16. Santhoscha, S.G.; Jamuna, P.; Prabhavathi, S.N. Bioactive components of garlic and their physiological role in health maintenance: A rewiew. Food Biosci. 2013, 3, 59–74. [CrossRef]
17. Arnault, I.; Auger, J. Seleno compounds in garlic and onion. J. Chromatog. A 2006, 1112, 23–30. [CrossRef] [PubMed]
18. Parrinello, A.M.; Amato, A.; Cordella, C.; Pizzo, A. L’aglio nel territorio della S.O.A.T. di Paceco; Regione Siciliana, Assessorato Agricoltura E Foreste, IX Servizio Regionale Assistenza Tecnica, Sperimentazione, Ricerca Applicata E Divulgazione; Assessorato Agricoltura, Regione Sicilia: Palermo, Italy, 2002.
19. Maetzke, F.; Cullotta, S.; La Mantia, T.; La Mela Veca, D.S.; Pizzurro, G.M. Individuazione di aree ecologicamente omogenee e di un sistema di aree a priorità di intervento per l’ampliamento della superficie forestale in Sicilia. Forest 2008, 5, 280–295. [CrossRef]
20. Tumea, P.; Bechb, J.; Tumec, L.; Bechd, J.; Revertere, F.; Longanb, L.; Cendoya, P. Concentrations and distributions of Ba, Cr, Sr, V, Al, and Fe in Torrelles soil profiles (Catalonia, Spain). J. Geochem. Explor. 2008, 96, 94–105. [CrossRef]
21. Yoshida, M.; Kallali, H. Environmental Magnetic Study of Surface Soil/Sediment in Northern Tunisia—Field Screening for Potentially Toxic Elements Contamination. In Proceedings of the 7th International Symposium on Recent Advance in Exploration Geophysics in Kyoto (RAEG2003), Kyoto University, Kyoto, Japan, January 2003.
22. Zhu, Y.; Umemurab, T.; Haraguchib, H.; Inagakia, K.; Chibaa, K. Determination of REEs in seawater by ICP-MS after on-line preconcentration using a syringe-driven chelating column. Talanta 2009, 78, 891–895. [CrossRef] [PubMed]
23. Gonzàlvez, A.; Armenta, S.; Cervera, M.L.; De La Guardia, M. Elemental composition of seasoning products. Talanta 2008, 74, 1085–1095. [CrossRef] [PubMed]
24. Ellison, S.L.R.; Williams, A. European Pharmacopoeia Technical Guide, Eurachem/Citac Guide Quantifying Uncertainty in Analytical Measurement, 3rd ed.; LGC: London, UK, 2011.
25. Dorant, E.; Van Den Brandt, P.A.; Goldbohm, R.A.; Hermus, R.J.; Sturmans, F. Garlic and its significance for the prevention of cancer in humans: A critical review. Br. J. Cancers 1993, 67, 424–429. [CrossRef]
26. Li, T.S.C. Medicinal Plants; Technomic Publ. Co.: Chicago, IL, USA, 2000.
27. Denkhaus, E.; Salnikow, K. Nickel essentiality, toxicity, and carcinogenicity. Crit. Rev. Oncol. Hematol. 2002, 42, 35–56. [CrossRef]
28. National Research Council. Medical and Biological Effects of Environmental Pollutants. Nickel; Committee on Medical and Biological Effects of Environmental Pollutants, National Academy of Sciences: Washington, DC, USA, 1975.
29. Macpherson, L.J.; Geierstanger, B.H.; Viswanath, V.; Bandell, M.; Eid, S.R.; Hwang, S.W.; Patapoutian, A. The pungency of garlic: Activation of TRPA1 and TRPV1 in response to allicin. Curr. Biol. 2005, 15, 929–934. [CrossRef] [PubMed]
30. Song, K.; Milner, J.A. The influence of heating on the anticancer properties of garlic. J. Nutr. 2001, 131, 1054s–1057s. [PubMed]
31. Yoshida, H.; Katsuzaki, H.; Ohta, R.; Ishikawa, K.; Fukuda, H.; Fujino, T.; Suzuki, A. An organosulfur compound isolated from oil-macerated garlic extract and its antimicrobial effect. Biosci. Biotechnol. Biochem.
1999, 63, 588–590. [CrossRef] [PubMed]
32. Lawson, L.D.; Wang, Z.J. Alliin and Allicin-Derived garlic compounds increases breath acetone through Allyl Methyl Sulfide; use in measuring Allicin bioavailability. J. Agric. Food Chem. 2005, 53, 1974–1983. [CrossRef] [PubMed]
33. Lawson, L.D.; Hughes, B.G. Characterization of the formation of allicin and other thiosulfinates from garlic. Planta Med. 1992, 58, 345–350. [CrossRef] [PubMed]
34. Rivlin, R.S. Historical perspective on the use of garlic. J. Nutr. 2001, 131, 951S–954S. [PubMed]
35. Steinmetz, K.A.; Kushi, L.H.; Bostick, R.M.; Folsome, A.R.; Potter, J.D. Vegetables fruit and colon cancer in the Iowa Women’s health Study. Am. J. Epidemiol. 1994, 139, 1–15. [PubMed]
36. Ministerial Decree. 5 June 2014 Ministero delle Politiche Agricole Alimentari e Forestali G.U. Supplemento Ordinario; n. 48; 20 June 2014; XIV Revisione dell’Elenco Nazionale dei Prodotti Agroalimentari Tradizionali; MIPAAF: Roma, Italy, 2014.
© 2016 by the authors; licensee MDPI, Basel, Switzerland. This article is an open access article distributed under the terms and conditions of the Creative Commons by Attribution (CC-BY) license (http://creativecommons.org/licenses/by/4.0/).