Loris Belcastro
Scalable Data Analysis: methods,
tools and applications
Supervisor: Domenico Talia
Preface
In the last years the ability to produce and gather data has increased exponen-tially. Every day huge amounts of data are collected from several sources, such as social networks, sensors, mobile devices. To extract helpful knowledge from such big data, novel technologies, architectures, and algorithms have been de-veloped by data scientists for capturing and analyzing complex and/or high velocity data.
The goal of this thesis is studying, designing and exploiting models, tech-nologies, tools and systems for Big Data analysis, especially on Clouds, to support scalable distributed knowledge discovery applications. The work is organized in two main parts. The first part focuses on methods and tools for supporting scalable execution of distributed knowledge discovery applications and, in general, solutions for dealing with Big Data issues. The second part presents data analysis applications and methodologies for extracting knowl-edge from large datasets.
As result of the first research activity, we integrated the MapReduce model into the workflow formalism provided by the Data Mining Cloud Framework (DMCF), a systems developed at the University of Calabria for creating and executing scalable data analysis application on Clouds. By implementing a DMCF data mining application whose workflow includes MapReduce com-putations, we were able to achieve a nearly linear speedup, thanks to the combined scalability provided by the DMCF workflows languages and by the MapReduce framework.
The second research activity led to the design and implementation of Geo-con, an open-source, scalable, and service-oriented middleware designed to help developers to implement context-aware mobile applications. Geocon pro-vides a service and a client library for storing, indexing, and retrieving infor-mation about entities that are commonly involved in these scenarios, such as (mobile) users, places, events and other resources (e.g., photos, media, com-ments).
As result of the third research activity, we present G-RoI, a novel data min-ing technique that exploits the indications contained in geotagged social media
items to discover the boundaries of a Place-of-Interest (PoI), commonly called Region-of-Interest (RoI). To assess the quality of the proposed technique, an experimental evaluation was carried out on a set of PoIs located in the center of Rome and Paris, using a large set of geotagged photos published in Flickr over six years. The experimental results show that G-RoI is able to detect more accurate RoIs than existing techniques, regardless of shapes, areas and densities of PoIs, and without being influenced by the proximity of different PoIs.
Finally, we designed a predictor of the arrival delay of scheduled flights due to weather conditions, as several studies have shown that weather is one of the primary causes of flight delays. Accurate prediction of flight delays is an important problem to be addressed given the economic impact of flight delays to both airlines and travelers. In our model, the predicted arrival delay takes into consideration both flight information (origin airport, destination airport, scheduled departure and arrival time) and weather conditions at origin airport and destination airport according to the flight timetable. The results show a high accuracy in prediction of delays and a good scalability, which means the proposed solution identifies a very useful pattern of flight delay that may help airlines in reducing delays.
Rende, Cosenza, Italy Loris Belcastro
Prefazione
Negli ultimi anni la capacit`a di generare e collezionare dati `e aumentata in maniera esponenziale. Ogni giorno, infatti, grandi moli di dati vengono collezionati da diverse sorgenti, tra cui social network, sensori, dispositivi mo-bili. Questi grandi quantitativi di dati, spesso riferiti col termine “Big Data”, presentano una serie di caratteristiche, quali la complessit`a e la velocit`a di generazione, che li rendono estremamente difficili da gestire. Per tali ragioni, nuove tecnologie, architetture ed algoritmi sono stati sviluppati per analizzare grandi moli di dati ed estrarre da questi conoscenza utile
Questo lavoro di tesi ha come obiettivo lo studio e l’impiego di modelli, tecnologie e sistemi per l’analisi di Big Data, che possono essere utilizzate, so-prattutto in ambiente Cloud, per sviluppare applicazioni scalabili e distribuite per la scoperta di conoscenza. Il lavoro `e organizzato in due parti principali. La prima parte si focalizza su metodi e strumenti per l’esecuzione scalabile di ap-plicazioni distribuite per l’estrazione di conoscenza e, in generale, di soluzioni per far fronte alle problematiche connesse ai Big Data. Nella seconda parte, invece, vengono presentate alcune applicazioni di data analysis e metodologie per l’estrazione di conoscenza da grandi volumi di dati.
La prima attivit`a di ricerca ha avuto come risultato l’integrazione del modello MapReduce all’interno del formalismo dei workflow messo a dispo-sizione da Data Mining Cloud Framework (DMCF), un sistema, sviluppato all’Universit`a della Calabria, per creare ed eseguire applicazioni scalabili per l’analisi di dati sul Cloud. Integrando operazioni MapReduce all’interno dei workflow, in particolare, si `e dimostrato come sia possibile costruire appli-cazioni di data mining scalabili, con valori di speedup prossimi a quelli ideali. La seconda attivit`a di ricerca ha portato alla progettazione e all’implemen-tazione di Geocon, un middleware orientato ai servizi, open-source e scalabile, progettato per facilitare lo sviluppo di applicazioni mobili context-aware. Geo-con mette a disposizione una libreria di servizio ed una libreria client per la memorizzazione, indicizzazione ed estrazione di informazioni relative ad entit`a che sono comunemente utilizzate in questi scenari, come utenti, luoghi, eventi ed altre risorse (es. foto, media, commenti).
Come risultato della terza attivit`a di ricerca, presentiamo G-RoI, una nuova tecnica di data mining che sfrutta le indicazioni contenute nel dati geolocalizzati provenienti dai social network per estrarre regioni di interesse (RoI), intese come i confini geografici che contraddistinguono l’area associata ad un punto di interesse (PoI). Per validare la qualit`a della tecnica proposta, `e stata eseguita una valutazione sperimentale su un insieme di PoI nel centro di Roma e Parigi, utilizzando un dataset di grandi dimensioni costituito da foto pubblicate su Flickr in un periodo di sei anni. I risultati sperimentali ottenuti hanno dimostrato come G-RoI sia in grado di rilevare RoI pi`u accu-rate rispetto alle tecniche esistenti, indipendentemente dalle caratteristiche di forma, dimensione, densit`a e prossimit`a dei PoI considerati.
Infine, `e stato progettato un predittore del ritardo di arrivo dei voli dovuto alle condizioni meteorologiche. Diversi studi, infatti, hanno dimostrato che il meteo `e una delle cause principali del ritardo aereo. La predizione accurata dei ritardi aerei `e un problema molto importante, con un grande impatto eco-nomico sia per le compagnie aeree che per i passeggeri. Nel nostro modello, il ritardo predetto prende in considerazioni le informazioni del volo (es. aero-porti di origine e di destinazione, orari previsti per la partenza e l’arrivo) e le condizioni meteorologiche agli aeroporti di origine e di destinazione in ac-cordo agli orari di volo programmati. I risultati hanno mostrato un’elevata accuratezza nella predizione dei ritardi e una buona scalabilit`a, evidenziando come la soluzione proposta sia in grado di fornire informazioni utili alle com-pagnie aeree per la riduzione dei ritardi.
Rende, Cosenza, Italy Loris Belcastro
Acknowledgements
During the time of writing of this PhD thesis I received support and help from many people.
Firstly, I would like to express my sincere gratitude to my supervisor, Prof. Domenico Talia, for his generous support, motivation, and great knowledge, who helped me in each step to complete my PhD course and related research. Besides my supervisor, I would like to thank Prof. Paolo Trunfio and Dr. Fabrizio Marozzo, for their help, insightful comments, and stimulating discus-sions. I must say that it was a pleasure to work with them.
A special thanks to my colleagues, friends, for their indispensable support that was essential to reach this goal.
And finally, I should like to conclude by expressing my deep gratitude to my family, in particular to my wife Francesca, for their love, support and essential encouragement.
Contents
1 Introduction . . . 1
1.1 Publications . . . 3
1.1.1 Journals . . . 4
1.1.2 Book Chapters . . . 4
1.1.3 Papers in refereed conference proceedings . . . 4
1.2 Organization of the Thesis . . . 4
2 Big Data Analysis on Clouds: models, tools and solutions . . 7
2.1 Big Data definitions . . . 8
2.2 Introduction to Big Data Analytics . . . 9
2.3 Cloud computing . . . 10
2.3.1 Basic concepts . . . 10
2.3.2 Cloud service distribution and deployment models . . . 11
2.4 Cloud solutions for Big Data . . . 12
2.4.1 Microsoft Azure . . . 13
2.4.2 Amazon Web Services . . . 14
2.4.3 OpenNebula . . . 14
2.4.4 OpenStack . . . 15
2.5 Systems for Big Data Analytics in the Cloud . . . 16
2.5.1 MapReduce . . . 16 2.5.2 Spark . . . 18 2.5.3 Mahout . . . 19 2.5.4 Hunk . . . 19 2.5.5 Sector/Sphere . . . 20 2.5.6 BigML . . . 21
2.5.7 Kognitio Analytical Platform . . . 22
2.5.8 Data Analysis Workflows . . . 23
2.5.9 NoSQL Models for Data Analytics . . . 28
2.5.10 Visual Analytics . . . 33
2.5.11 Big Data funding projects . . . 34
2.5.13 Summary . . . 36
2.6 Research Trends . . . 38
2.7 Conclusions . . . 41
3 Workflows and MapReduce: Integration on Clouds . . . 45
3.1 Data Mining Cloud Framework . . . 46
3.1.1 Applications execution . . . 47
3.1.2 Workflow formalisms . . . 48
3.2 Extending VS4Cloud/JS4Cloud with MapReduce . . . 50
3.2.1 Motivations . . . 51
3.2.2 Integration model . . . 51
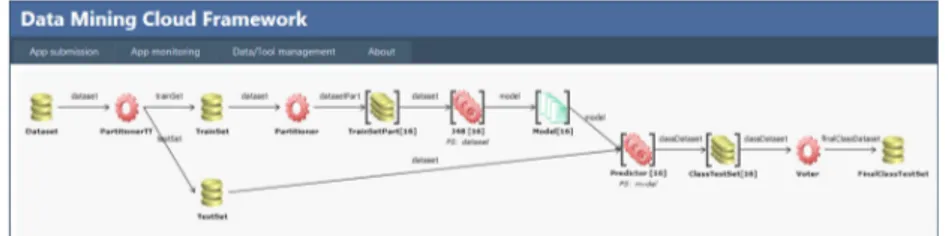
3.2.3 A Data Mining Application Case . . . 53
3.3 Related work . . . 55
3.4 Conclusions . . . 56
4 A scalable middleware for context-aware applications . . . 57
4.1 Related Work . . . 58 4.2 Metadata Model . . . 61 4.3 Middleware . . . 63 4.3.1 Software components . . . 63 4.3.2 Distributed architecture . . . 66 4.4 Performance evaluation . . . 67 4.4.1 Mobile application . . . 67
4.4.2 Experimental setup and performance parameters . . . 68
4.4.3 Performance results . . . 69
4.5 Conclusions . . . 70
5 Analysis of geotagged social data . . . 73
5.1 Problem definition . . . 75 5.2 Related work . . . 75 5.3 Methodology . . . 77 5.3.1 Example . . . 78 5.3.2 Algorithmic details . . . 80 5.4 Evaluation . . . 85 5.4.1 Performance metrics . . . 85 5.4.2 Data source . . . 85 5.4.3 Experimental results . . . 86 5.5 Conclusions . . . 92
6 A scalable data mining technique for flight delay prediction 95 6.1 Problem definition . . . 97
6.1.1 Preliminary definitions . . . 97
6.1.2 Problem statement . . . 97
6.1.3 Data sources . . . 98
6.2 Data understanding . . . 100
6.3 Data analysis . . . 101
6.3.1 Data preprocessing and transformation . . . 102
6.3.2 Target data creation . . . 104
6.3.3 Modeling . . . 107 6.4 Evaluation . . . 109 6.5 Related work . . . 114 6.6 Conclusions . . . 117 7 Conclusions . . . 119 References . . . 123
List of Figures
2.1 OpenStack architecture (source: openstack.org). . . 15
2.2 Example of BigML prediction model for air pollution (source: bigml.com). . . 22
2.3 Example of Azure Machine Learning workflow (source: studio.azureml.net). . . 25
2.4 Example of CloudFlow workflow (source: clowdflows.org). . . 26
2.5 Example of Bank Fraud Graph Dataset (source: neo4j.com). . . . 32
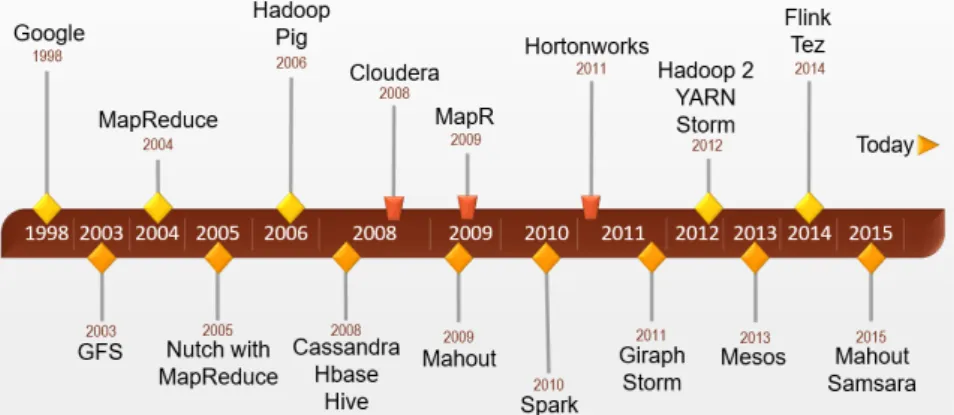
2.6 A short Hadoop ecosystem’s history. . . 35
3.1 Architecture of Data Mining Cloud Framework. . . 46
3.2 Example of data analysis application designed using VL4Cloud. 49 3.3 Example of data analysis application designed using JS4Cloud. . 50
3.4 Types of Tools available in DMCF. . . 52
3.5 Example of MapReduce descriptor in JSON format. . . 53
3.6 Flight delay analysis workflow using DMCF with MapReduce. . 54
4.1 Example of User metadata in JSON. . . 63
4.2 Example of Place metadata in JSON. . . 63
4.3 Software components of the Geocon middleware. . . 64
4.4 Distributed architecture of the Geocon middleware. . . 67
4.5 GeoconView: A location-aware mobile application based on the Geocon middleware. . . 68
4.6 Latency time vs number of queries per second, for different numbers of events stored in the system, using: a) 2 data nodes; b) 8 data nodes. . . 70
4.7 Speedup vs number of data nodes, for different numbers of queries per second, using: a) 500k events; b) 2000k events. . . 71
4.8 Latency time vs number of data nodes/number of events (scaleup), for different numbers of queries per second. . . 71
5.2 Set of convex polygons in CP identified by the RoI reduction procedure, with indication of RoI R chosen by the RoI
selection procedure. . . 80
5.3 G-RoI selection from Colosseum’s convex polygons. . . 81
5.4 G-RoI selection procedure: An example with three iterations. . . 84
5.5 An example of metadata element returned by the Flickr APIs. . 86
5.6 RoIs identified by different techniques: Circle (purple lines), DBSCAN (orange), Slope (red), G-RoI (blue). Real RoIs shown as black dotted lines. . . 88
5.7 City of Rome: RoIs identified by G-RoI (blue lines) compared with real ones (black dotted lines). . . 90
5.8 RoIs identified by different techniques in Paris: Circle (purple lines), DBSCAN (orange), Slope (red), G-RoI (blue). Real RoIs shown as black dotted lines. . . 91
6.1 Delayed flights due to a single delay cause or a combination of them. . . 102
6.2 Data analysis process. . . 102
6.3 Data flow of the first join step. . . 104
6.4 Method used for creating balanced training and test sets. . . 106
6.5 Parallel version of Random Forest implemented in MapReduce. 108 6.6 Performance indicators vs number of weather observations considered at origin (a) and destination (b) airport. . . 111
6.7 Performance indicators vs number of weather observations at origin and destination airports (a) and ROC curves (b). . . 112
6.8 Performance indicators vs delay threshold (a) and ROC curves (b). . . 113
6.9 Performance indicators vs target dataset (a) and ROC curves (b). . . 114
List of Tables
2.1 Comparison of some NoSQL databases. . . 30
2.2 A brief comparison of most common Big Data analytics systems. 37 2.3 Summary considerations about graph databases. . . 38
2.4 Summary considerations about Key-Value databases. . . 38
2.5 Summary considerations about Column-oriented databases. . . 39
2.6 Summary considerations about Document-oriented databases. . . 39
4.1 Comparison with related systems. . . 60
4.2 Basic User metadata. . . 62
4.3 Basic Place metadata. . . 62
4.4 Basic Event metadata. . . 62
4.5 Basic Resource metadata. . . 62
4.6 CRUD methods for Resource elements. . . 66
4.7 System parameters. . . 69
5.1 Comparison with related algorithms. . . 77
5.2 Precision, Recall, and F1score of Circle, DBSCAN, Slope and G-RoI over 24 PoIs in Rome. For each row, the best F1score is indicated in bold. . . 89
5.3 Precision, Recall, and F1score of Circle, DBSCAN, Slope and G-RoI over 24 PoIs in Paris. For each row, the best F1score is indicated in bold. . . 92
6.1 Datasets specifications. . . 99
6.2 Confusion matrix. . . 99
6.3 Analysis of flight on-time performance by year. . . 100
6.4 Analysis of flight delay causes by year. . . 101
6.5 Analysis of delayed flights due to weather conditions by year. . . 101
6.6 Features of target datasets. . . 106
6.8 Predictor performance obtained using: 3 observations with
3-hour step (first row); 7 observations every hour (second row). 112 6.9 Turnaround time and relative speedup values (calculated with
respect to 2 workers) of the four data mining phases. . . 115 6.10 Related work comparison. . . 117
1
Introduction
In the last years the ability to produce and gather data has increased expo-nentially. In fact, in the Internet of Things’ era, huge amounts of digital data are generated by and collected from several sources, such as sensors, cams, in-vehicle infotainment, smart meters, mobile devices, web applications and services. The huge amount of data generated, the speed at which it is pro-duced, and its heterogeneity in terms of format (e.g., video, text, xml, email), represent a challenge to the current storage, process and analysis capabilities. In particular, thanks to the growth of social networks (e.g., Facebook, Twit-ter, Pinterest, Instagram, Foursquare, etc.), the widespread diffusion of mobile phones, and the large use of location-based services, every day millions of peo-ple access social network services and share information about their interests and activities. Those data volumes, commonly referred as Big Data, can be exploited to extract useful information and to produce helpful knowledge for science, industry, public services and in general for humankind.
Although nowadays the term Big Data is often misused, it is very impor-tant in computer science for understanding business and human activities. In fact, Big Data is not only characterized by the large size of datasets, but also by the complexity, by the variety, and by the velocity of data that can be collected and processed. So, we can collect huge amounts of digital data from sources, at a very high rate that the volume of data is overwhelming our ability to make use of it. This situation is commonly called “data deluge”.
In science and business, people are analyzing data to extract information and knowledge useful for making new discoveries or for supporting decision processes. This can be done by exploiting Big Data analytics techniques and tools. As an example, one of the leading trends today is the analysis of big geotagged data for creating spatio-temporal sequences or trajectories tracing user movements. Such kind of information is clearly highly valuable for science and business: tourism agencies and municipalities can know the most visited places by tourists, the time of year when such places are visited, and other useful information [13][81]; transport operators can know the places and routes where is it more likely to serve passengers[154] or crowed areas where more
transportation resources need to be allocated[152]; city managers may exploit social media analysis to reveal mobility insights in cities such as incident locations[82], or to study and prevent crime events [84][57].
But it must be also considered that Twitter and Facebook produce more then 20 TB of data every day. Then to extract value from such kind of data, novel technologies and architectures have been developed by data scientists for capturing and analyzing complex and/or high velocity data. In this scenario data mining raised in the last decades as a research and technology field that provides several different techniques and algorithms for the automatic analysis of large datasets. The usage of sequential data mining algorithms for analyzing large volumes of data requires a very long time for extracting useful models and patterns. For this reason, high performance computers, such as many and multi-core systems, Clouds, and multi-clusters, paired with parallel and distributed algorithms are commonly used by data analysts to tackle Big Data issues and get valuable information and knowledge in a reasonable time. In this context, Cloud computing is probably the most valid and cost-effective solution for supporting Big Data storage and for executing sophisti-cated data analytic applications. In fact, thanks to elastic resources allocation and high computing power, Cloud computing represents a compelling solution for Big Data analytics, allowing faster data analysis, that means more timely results and then greater data value.
The goal of this thesis is studying, designing and exploiting models, tech-nologies, tools, and systems for Big Data analysis, especially on Clouds, to support scalable distributed knowledge discovery applications. The work is organized in two main parts. The first part focuses on methods and tools for supporting scalable execution of distributed knowledge discovery applications and, in general, solutions for dealing with Big Data issues. The second part presents data analysis applications and methodologies for extracting knowl-edge from large datasets.
In the first part of this thesis, two research approaches are presented: the first one is the use of the MapReduce programming model for processing large datasets on Clouds and, in particular, the use of the MapReduce paradigm in combination with the workflow paradigm to enable scalable data processing or to implement knowledge discovery applications on Clouds; the second one is instead the design and implementation of a scalable middleware for context-aware applications, which can be deployed on Clouds.
As a result of the first research approach, we present an extension for in-tegrating the MapReduce model into the workflow engine provided by Data Mining Cloud Framework (DMCF), a framework for supporting the scalable execution of distributed knowledge discovery applications. More in detail, we describe how workflows, created using VL4Cloud or JS4Cloud (i.e., the for-malisms provided by DMCF for designing workflows), can include MapRe-duce algorithms and tools, and how these workflows are executed in parallel on DMCF to enable scalable data processing on Clouds.
The second research approach led to the design of Geocon, an open-source service-oriented middleware designed to help developers to implement context-aware mobile applications. Geocon provides a service and a client library for storing, indexing, and retrieving information about entities that are commonly involved in these scenarios, such as (mobile) users, places, events and other resources (e.g., photos, media, comments). To deal with very the large number of users and resources involved in such kind of applications, Geocon is designed to scale horizontally on a multiple nodes. Despite not being directly involved in the data analysis process, Geocon represents a solution for improving the capabilities of collecting, storing, indexing, and querying huge amount of data produced by mobile context-aware applications. Data collected and stored exploiting Geocon can be subsequently fed to a data analysis application for extracting valuable information.
With regards to data analysis applications proposed in the second part of this thesis work, we focused on two research topics: the first one is the use of knowledge discovery methodologies for extracting highly valuable informa-tion exploiting data coming from social networks; the second one is instead the use of parallel and distributed machine learning techniques, coupled with the MapReduce programming model, for extracting high valuable information from large datasets.
As a result of this research topic, we present G-RoI, a novel mining tech-nique that exploits indications contained in geotagged social media items to discover the boundaries of a Place-of-Interest (PoI), also called Region-of-Interest (RoI). We experimentally evaluated the accuracy of G-RoI in detect-ing the RoIs associated to a set of PoIs in Rome and Paris, usdetect-ing a large set of geotagged photos published in Flickr over six years.
The result of the second research work is a predictor of the arrival delay of a scheduled flight due to weather conditions. This work was motivated by the fact that several studies have shown that weather is one of the primary causes of flight delays, with a significant economical impact (i.e., the cost of flight delays for US economy was estimated to be more than 30 billion in 2007). The data preparation and mining tasks have been implemented as MapReduce programs that have been executed on a Cloud infrastructure to achieve scalability. The results show a high accuracy in prediction of delays and a good scalability, which means the proposed methodology identifies a very useful pattern of flight delay that may help airlines in reducing delays.
1.1 Publications
The following publications have been produced while accomplishing this the-sis.
1.1.1 Journals
• L. Belcastro, F. Marozzo, D. Talia, P. Trunfio, “Using Scalable Data Min-ing for PredictMin-ing Flight Delays”. ACM Transactions on Intelligent Sys-tems and Technology (ACM TIST), vol. 8, n. 1, October 2016.
• L. Belcastro, F. Marozzo, D. Talia, P. Trunfio, “G-RoI: Automatic Region-of-Interest detection driven by geotagged social media data”. ACM Trans-actions on Knowledge Discovery from Data (ACM TKDD). Under review, 2016.
• L. Belcastro, F. Marozzo, D. Talia, P. Trunfio, “A Scalable Middleware for Context-aware Mobile Applications”. Concurrency and Computation: Practice and Experience. Under review, 2017.
1.1.2 Book Chapters
• L. Belcastro, F. Marozzo, D. Talia, P. Trunfio, “Big Data Analysis on Clouds”. In: Handbook of Big Data Technologies, S. Sakr, A. Zomaya (Editors), Springer, 2017.
1.1.3 Papers in refereed conference proceedings
• L. Belcastro, G. Di Lieto, M. Lackovic, F. Marozzo, P. Trunfio, “Geo-con: A Middleware for Location-aware Ubiquitous Applications”. Proc. of the First International Workshop on Ultrascale Computing for Early Re-searchers (UCER 2016), 2016.
• L. Belcastro, F. Marozzo, D. Talia, P. Trunfio, “Programming Visual and Script-based Big Data Analytics Workflows on Clouds”. Post-Proc. of the High Performance Computing Workshop 2014, Cetraro, Italy, Advances in Parallel Computing, vol. 26, pp. 18–31, IOS Press, 2015.
1.2 Organization of the Thesis
The remainder of this thesis is organized as follows. Chapter 2 discusses mod-els, technologies and research trends in Big Data analysis on Clouds.
Then next two chapters discuss solutions that can be used for developing respectively data analysis and mobile context-aware applications, also in pres-ence of Big Data. In particular, Chapter 3 presents the Data Mining Cloud Framework (DMCF) and discusses how its workflow paradigm has been inte-grated with the MapReduce model, while Chapter 4 discusses the middleware Geocon for developing mobile context-aware applications.
Next two chapters present data mining applications that made use of big datasets for extracting useful information. Specifically, Chapter 5 presents the G-RoI mining technique for extracting RoIs from geotagged social media data gathered from social networks, while Chapter 6 presents a predictor
of the arrival delay of a scheduled flight due to weather conditions. Finally, Chapter 7 discusses conclusions and future work.
2
Big Data Analysis on Clouds: models, tools
and solutions
Every day huge amounts of data are collected from several sources, such as social networks (e.g., Facebook, Twitter, Pinterest, Instagram, Foursquare, etc.), sensors, mobile devices. Such data volumes, commonly referred as Big Data, can be exploited to extract useful information and to produce helpful knowledge for science, industry, public services and in general for humankind. However, the process of knowledge discovery from Big Data is not so easy, mainly due to data characteristics, as size, complexity and variety that require to address several issues. In this scenario data mining raised in the last decades as a research and technology field that provides several different techniques and algorithms for the automatic analysis of large datasets.
Cloud computing is a valid and cost-effective solution for supporting Big Data storage and for executing sophisticated data mining applications. Big Data analytics is a continuously growing field, where novel and efficient solu-tions (i.e., in terms of platforms, programming tools, frameworks, and data mining algorithms) spring up everyday to cope with the growing scope of interest in Big Data.
This chapter discusses models, technologies and research trends in Big Data analysis on Clouds. In particular, the chapter presents representative examples of Cloud environments that can be used to implement applications and frameworks for data analysis, and an overview of the leading software tools and technologies that are used for developing scalable data analysis on Clouds.
The remainder of the chapter is organized as follows. Section 2.1 provides a brief discussion about existing Big Data definitions. Section 2.2 provides a brief introduction to Big Data Analytics. Section 2.3 introduces the main Cloud computing concepts. Section 2.4 describes representative examples of Cloud environments that can be used to implement applications and frame-works for data analysis in the Cloud. Section 2.5 provides an overview of the leading software tools and technologies used for developing scalable data anal-ysis on Clouds. Section 2.6 discusses some research trends and open challenges on Big Data analysis. Finally, Section 2.7 concludes the chapter.
2.1 Big Data definitions
Nowadays the term Big Data is often misused, but it is very important in computer science for understanding business and human activities. Several definitions for Big Data have been proposed in literature, but reaching a global consensus about what it means is not easy.
Although not explicitly mentioning the term “Big Data”, the first defi-nition was proposed by Doug Laney (an analyst of the META Group, now Gartner) in a 2001 report, in which a three-dimensional model, also known as the “3Vs” (Volume, Velocity, and Variety) model, is used to describe Big Data. Many years after, this model continues to be one of the most used, considering that much of the industry and the research (e.g., IBM [69] and Microsoft researchers [104]) still adopt the Big Data definition provided by Gartner [56]:“Big Data is high volume, high velocity, and/or high variety in-formation assets that demand cost-effective, innovative forms of inin-formation processing that enable enhanced insight, decision making, and process automa-tion”.
According to the above definition, Big Data is not only characterized by the large size of datasets, but also by the variety (i.e., data from multiple repositories, domains, or types), and by the velocity of data that can be col-lected and processed. In fact, we can collect huge amounts of digital data from several sources, at a very high rate that the volume of data is overwhelming our ability to make use of it. This situation is commonly called “data deluge”. Many other definitions have been proposed in literature that extended the “3Vs” model by introducing other features, like “Value” [71][54], “Verac-ity” [122], “Complex“Verac-ity” [4], etc.
About that, a 2011 report from IDC [54] provided a “4Vs” definition for Big Data: “Big data technologies describe a new generation of technologies and architectures, designed to economically extract value from very large volumes of a wide variety of data, by enabling high-velocity capture, discovery, and/or analysis”. This definition delineates a new feature of Big Data, i.e., value, that refers to the capability to create lot of value for organizations, societies and consumers from data analyses.
On the contrary, in 2012 Gartner [14] and IBM [68] extended the “3Vs” model by introducing the Veracity as the fourth “V”. Veracity includes ques-tions about quality, reliability, and uncertainty of captured data and the out-come of analysis of that data.
Finally, the definition of Big Data provided by NIST [42] introduced a new feature of Big Data, i.e., the variability: “Big Data consists of exten-sive datasets – primarily in the characteristics of volume, variety, velocity, and/or variability – that require a scalable architecture for efficient storage, manipulation, and analysis”. Variability is defined as the changes in other data characteristics that produce variance in data meaning, in lexicon, with a potential huge impact on data homogenization.
From the discussion above, it is clear that finding a common definition of Big Data is very difficult. In this regard, a brief review on Big Data definitions have been conducted by De Mauro, et al. [34] that aims to define a consensual definition of Big Data.
2.2 Introduction to Big Data Analytics
Data Analytics plays a crucial role in today’s business by helping companies to improve operational efficiency and gain competitive advantages over busi-ness rivals. According to a very popular definition[94]: “Data Analytics is the science of examining raw data with the purpose of drawing conclusions about that information”.
Since 1950s, organizations were using basic data analytics techniques to discover useful information about market trends or insights. In most cases, such kind of analysis was essentially provided to manually examine numbers in spreadsheets with the aim of extracting information that could be used for future decisions. But today, to give organizations a competitive edge, data analytics must identify insights for immediate decisions. Today, most organi-zations collect all the data – often really huge amounts – that streams into their businesses for extracting meaningful and valuable information for busi-ness (e.g., for making better decisions or planning marketing strategies) and science (e.g., verify or disprove models or theories) purposes.
Big Data Analytics refers to advanced data analytics techniques applied to Big Data sets. These techniques include data mining, statistics, data visual-ization, artificial intelligence, machine learning, natural language processing, etc. The usage of Big Data Analytics produces several benefits, especially in big companies, in terms of cost reduction for storing and querying large amount of data, effectiveness of decision making, ability to provides services that better meet customers’ needs. Some Big Data Analytics application fields are discussed in the following:
• Text Analytics: it is the process of deriving information from text sources (e.g., document, social networks, blogs, web sites) [55], which can be used for sentiment analysis, content classification, text summarization, etc. • Predictive analytics: it is the process of predicting future events or
behav-iors by exploiting models developed using a variety of statistical, machine learning, data mining, and other analytical techniques [110].
• In-Memory analytics: it is the process that loads data to be analyzed directly into systems random access memory (RAM), instead of storing data on physical disks. In such way, in-memory analytics approach greatly reduces queries and calculation times, allowing business intelligence appli-cations to support faster business decisions [95].
• Graph analytics (or Network Analysis): it analyzes the behavior of vari-ous connected components through the use of network and graph theories,
which is useful for investigating structures in social networks [111]. Ex-amples of graph analytics path, connectivity, community, and centrality analysis.
• Prescriptive Analytics: it is a form of advanced analytics which examines data or content to optimize decisions about what actions to take in order to maximize profit, given a set of constraints and key objectives[119]. It is characterized by techniques such as graph analysis, simulation, com-plex event processing, neural networks, recommendation engines, heuris-tics, and machine learning.
Despite the great benefits discussed above, dealing with big data is not a bed of roses. In fact, the process of knowledge discovery from Big Data is generally complex, mainly due to data characteristics, as size, complexity and variety, that require to address several issues. Moreover, Big Data analytics is a continuously growing field where so novel and efficient solutions (i.e., in terms of platforms, programming tools, frameworks, and data mining algorithms) spring up everyday to cope with the growing scope of interest in Big Data. In this context, Cloud computing is a valid and cost-effective solution for supporting Big Data storage and for executing sophisticated data analytics applications.
2.3 Cloud computing
This section introduces the basic concepts of Cloud computing, which pro-vides scalable storage and processing services that can be used for extracting knowledge from Big Data repositories. In the following we provide basic Cloud computing definitions (Section 2.3.1) and discuss the main service distribution and deployment models provided by Cloud vendors (Section 2.3.2).
2.3.1 Basic concepts
In the last years, Clouds have emerged as effective computing platforms to face the challenge of extracting knowledge from Big Data repositories in limited time, as well as to provide effective and efficient data analysis environments to both researchers and companies. From a client perspective, the Cloud is an abstraction for remote, infinitely scalable provisioning of computation and storage resources. From an implementation point of view, Cloud systems are based on large sets of computing resources, located somewhere “in the Cloud”, which are allocated to applications on demand [10]. Thus, Cloud computing can be defined as a distributed computing paradigm in which all the resources, dynamically scalable and often virtualized, are provided as services over the Internet. As defined by NIST (National Institute of Standards and Technol-ogy) [105] Cloud computing can be described as: “A model for enabling con-venient, on-demand network access to a shared pool of configurable computing
resources (e.g., networks, servers, storage, applications, and services) that can be rapidly provisioned and released with minimal management effort or service provider interaction”.
From the NIST definition, we can identify five essential characteristics of Cloud computing systems, which are on-demand self-service, broad network access, resource pooling, rapid elasticity, and measured service. Cloud systems can be classified on the basis of their service model and their deployment model.
2.3.2 Cloud service distribution and deployment models
Cloud computing vendors provide their services according to three main dis-tribution models:
• Software as a Service (SaaS), in which software and data are provided through Internet to customers as ready-to-use services. Specifically, soft-ware and associated data are hosted by providers, and customers access them without need to use any additional hardware or software. Examples of SaaS services are Gmail, Facebook, Twitter, Microsoft Office 365. • Platform as a Service (PaaS), in an environment including databases,
ap-plication servers, development environment for building, testing and run-ning custom applications. Developers can just focus on deploying of appli-cations since Cloud providers are in charge of maintenance and optimiza-tion of the environment and underlying infrastructure. Examples of PaaS services areWindows Azure, Force.com, Google App Engine.
• Infrastructure as a Service (IaaS), that is an outsourcing model under which customers rent resources like CPUs, disks, or more complex re-sources like virtualized servers or operating systems to support their op-erations (e.g., Amazon EC2, RackSpace Cloud). Compared to the PaaS approach, the IaaS model has a higher system administration costs for the user; on the other hand, IaaS allows a full customization of the execution environment.
The most common models for providing Big Data analytics solution on Clouds are PaaS and SaaS. IaaS is usually not used for high-level data ana-lytics applications but mainly to handle the storage and computing needs of data analysis processes. In fact, IaaS is the more expensive delivery model, because it requires a greater investment of IT resources. On the contrary, PaaS is widely used for Big Data analytics, because it provides data ana-lysts with tools, programming suites, environments, and libraries ready to be built, deployed and run on the Cloud platform. With the PaaS model users do not need to care about configuring and scaling the infrastructure (e.g., a dis-tributed and scalable Hadoop system), because the Cloud vendor will do that for them. Finally, the SaaS model is used to offer complete Big Data analytics applications to end users, so that they can execute analysis on large and/or
complex datasets by exploiting Cloud scalability in storing and processing data.
Regarding deployment models, Cloud computing services are delivered ac-cording to three main forms:
• Public Cloud : it provides services to the general public through the In-ternet and users have little or no control over the underlying technology infrastructure. Vendors manage their proprietary data centers delivering services built on top of them.
• Private Cloud : it provides services deployed over a company intranet or in a private data center. Often, small and medium-sized IT companies prefer this deployment model as it offers advance security and data control solutions that are not available in the public Cloud model.
• Hybrid Cloud : it is the composition of two or more (private or public) Clouds that remain different entities but are linked together.
As outlined in [85], users access Cloud computing services using different client devices and interact with Cloud-based services using a Web browser or desktop/mobile app. The business software and users data are executed and stored on servers hosted in Cloud data centers that provide storage and computing resources. Resources include thousands of servers and storage de-vices connected each other through an intra-Cloud network. The transfer of data between data center and users takes place on wide-area network. Sev-eral technologies and standards are used by the different components of the architecture. For example, users can interact with Cloud services through SOAP-based or RESTful Web services [118] and Ajax technologies allow Web interfaces to Cloud services to have look and interactivity equivalent to those of desktop applications. Open Cloud Computing Interface (OCCI)1
specifies how Cloud providers can deliver their compute, data, and network resources through a standardized interface.
2.4 Cloud solutions for Big Data
At the beginning of the Big Data phenomenon, only big IT companies, such as Facebook, Yahoo!, Twitter, Amazon, LinkedIn, invested large amounts of re-sources in the development of proprietary or open source projects to cope with Big Data analysis problems. But today, Big Data analysis becomes highly sig-nificant and useful for small and medium-sized businesses. To address this in-creasing demand a large vendor community started offering highly distributed platforms for Big Data analysis. Among open-source projects, Apache Hadoop is the leading open-source data-processing platform, which was contributed by IT giants such as Facebook and Yahoo.
Since 2008, several companies, such as Cloudera, MapR, and Hortonworks, started offering enterprise platform for Hadoop, with greats efforts to improve
1
Hadoop performances in terms of high-scalable storage and data processing. Instead, IBM and Pivotal started offering its own customized Hadoop dis-tribution. Other big companies decided to provide only additional softwares and support for Hadoop platform developed by external providers: for ex-ample, Microsoft decided to base its offer on Hortonworks platform, while Oracle decided to resell Cloudera platform. However Hadoop is not the only solution for Big Data analytics. Out of the Hadoop box other solutions are emerging. In particular, in-memory analysis has become a widespread trend, so that companies started offering tools and services for faster in-memory analysis, such as SAP, that is considered the leading company with its Hana2 platform. Other vendors, including HP, Teradata and Actian, developed an-alytical database tools with in-memory analysis capabilities. Moreover, some vendors, like Microsoft, IBM, Oracle, and SAP, stand out from their peers for offering a complete solution for data analysis, including DBMS systems, soft-ware for data integration, stream-processing, business intelligence, in-memory processing, and Hadoop platform.
In addition, many vendors decided to focus whole offer on the Cloud. Among these certainly there are Amazon Web Services (AWS) and 1010data. In particular, AWS provides a wide range of services and products on the Cloud for Big Data analysis, including scalable database systems and solu-tions for decision support. Other smaller vendors, including Actian, InfiniDB, HP Vertica, Infobright, and Kognitio, focused their big-data offer on database management systems for analytics only. Following the approach in [133], the remainder of the section introduces representative examples of Cloud environ-ments: Microsoft Azure as an example of public PaaS, Amazon Web Services as the most popular public IaaS, OpenNebula and OpenStack as examples of private IaaS. These environments can be used to implement applications and frameworks for data analysis in the Cloud.
2.4.1 Microsoft Azure
Azure3is the Microsoft Cloud proposal. It is environment providing a large set of Cloud services that can be used by developers to create Cloud-oriented ap-plications, or to enhance existing applications with Cloud-based capabilities. The platform provides on-demand compute and storage resources exploiting the computational and storage power of the Microsoft data centers. Azure is designed for supporting high availability and dynamic scaling services that match user needs with a pay-per-use pricing model. The Azure platform can be used to perform the storage of large datasets, execute large volumes of batch computations, and develop SaaS applications targeted towards end-users. Microsoft Azure includes three basic components/services:
2
https://hana.sap.com
3
• Compute is the computational environment to execute Cloud applications. Each application is structured into roles: Web role, for Web-based appli-cations; Worker role, for batch appliappli-cations; Virtuam Machines role, for virtual-machine images.
• Storage provides scalable storage to manage: binary and text data (Blobs), non-relational tables (Tables), queues for asynchronous communication between components (Queues). In addition, for relational databases, Mi-crosoft provides its own scalable Cloud database services, called Azure SQL Database.
• Fabric controller whose aim is to build a network of interconnected nodes from the physical machines of a single data center. The Compute and Storage services are built on top of this component.
Microsoft Azure provides standard interfaces that allow developers to in-teract with its services. Moreover, developers can use IDEs like Microsoft Visual Studio and Eclipse to easily design and publish Azure applications. 2.4.2 Amazon Web Services
Amazon offers compute and storage resources of its IT infrastructure to de-velopers in the form of Web services. Amazon Web Services (AWS)4is a large set of Cloud services that can be composed by users to build their SaaS appli-cations or integrate traditional software with Cloud capabilities. It is simple to interact with these service since Amazon provides SDKs for the main pro-gramming languages and platforms (e.g. Java, .Net, PHP, Android).
AWS compute solution includes Elastic Compute Cloud (EC2), for creating and running virtual servers, and Amazon Elastic MapReduce for building and executing MapReduce applications. The Amazon storage solution is based on S3 Storage Service, with a range of storage classes designed to cope with different use cases (i.e., Standard, Infrequent Access, and Glacier for long term storage archive). A full set of database systems are also proposed: Relational Database Service (RDS) for relational tables; DynamoDB for non-relational tables; SimpleDB for managing small datasets; ElasticCache for caching data. Even though Amazon is best known to be the first IaaS provider (based on its EC2 and S3 services), it is now also a PaaS provider, with services like Elastic Beanstalk, that allows users to quickly create, deploy, and manage applications using a large set of AWS services, or Amazon Machine Learning, that provides visualization tools and wizards for easily creating machine learning models. 2.4.3 OpenNebula
OpenNebula [125] is an open-source framework mainly used to build private and hybrid Clouds. The main component of the OpenNebula architecture is
4
the Core, which creates and controls virtual machines by interconnecting them with a virtual network environment. Moreover, the Core interacts with specific storage, network and virtualization operations through pluggable components called Drivers. In this way, OpenNebula is independent from the underlying infrastructure and offers a uniform management environment. The Core also supports the deployment of Services, which are a set of linked components (e.g., Web server, database) executed on several virtual machines. Another component is the Scheduler, which is responsible for allocating the virtual machines on the physical servers. To this end, the Scheduler interacts with the Core component through appropriate deployment commands.
OpenNebula can implement a hybrid Cloud using specific Cloud Drivers that allow to interact with external Clouds. In this way, the local infrastruc-ture can be supplemented with computing and storage resources from pub-lic Clouds. Currently, OpenNebula includes drivers for using resources from Amazon EC2 and Eucalyptus [109], another open source Cloud framework. 2.4.4 OpenStack
OpenStack5
is an open source Cloud operating system realesed under the terms od the Apache License 2.0. It allows the management of large pools of processing, storage, and networking resources in a datacenter through a Web-based interface. Most decisions about its development are decided by the community to the point that every six months there is a design sum-mit to gather requirements and define new specifications for the upcoming release. The modular architecture of OpenStack is composed by four main components, as shown in Figure 2.1.
Fig. 2.1. OpenStack architecture (source: openstack.org).
OpenStack Compute provides virtual servers upon demand by managing the pool of processing resources available in the datacenter. It supports dif-ferent virtualization technologies (e.g., VMware, KVM) and is designed to
5
scale horizontally. OpenStack Storage provides a scalable and redundant stor-age system. It supports Object Storstor-age and Block Storstor-age: the former allows storing and retrieving objects and files in the datacenter. OpenStack Net-working manages the networks and IP addresses. Finally, OpenStack Shared Services are additional services provided to ease the use of the datacenter, such as Identity Service for mapping users and services, Image Service for managing server images, and Database Service for relational databases.
2.5 Systems for Big Data Analytics in the Cloud
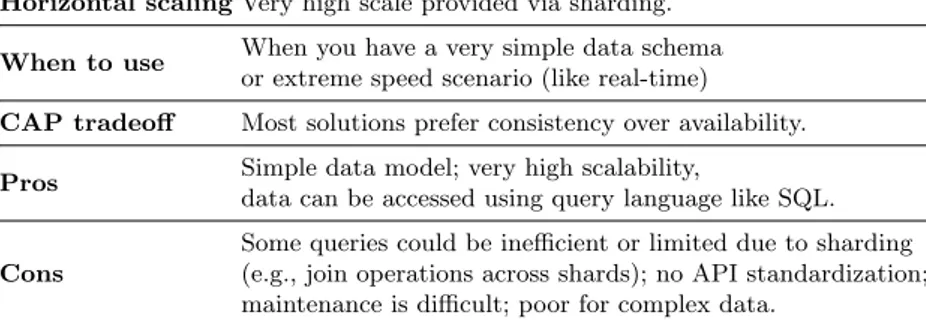
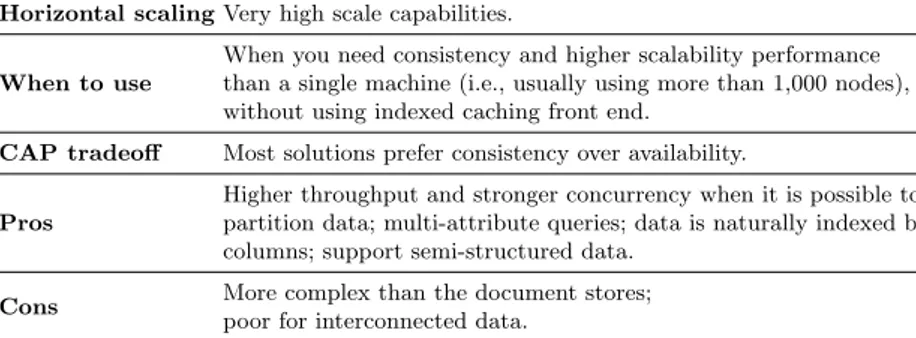
In this section we describe the most used tools for developing scalable data analysis on Clouds, such as MapReduce, Spark, workflow systems, and NoSQL database management systems. In particular, we discuss some frameworks commonly used to develop scalable applications that analyze big amounts of data, such as Apache Hadoop, the best-known MapReduce implementation, and Spark. We present also some powerful data mining programming tools and strategies designed to be executed in the Cloud for exploiting complex and flexible software models, such as the distributed workflows. Workflows provide a declarative way of specifying the high-level logic of an application, hiding the low-level details. They are also able to integrate existing software modules, datasets, and services in complex compositions that implement dis-covery processes. In this section we presented several data mining workflow systems, such as the Data Mining Cloud Framework, Microsoft Azure Machine Learning, and ClowdFlows. Moreover, we discuss about NoSQL database tech-nology that recently became popular as an alternative or as a complement to relational databases. In the last years, several NoSQL systems have been pro-posed for providing more scalability and higher performance than relational databases. We introduce the basic principles of NoSQL, described represen-tative NoSQL systems, and outline interesting data analytics use cases where NoSQL tools are useful. Finally, we present a brief overview of well known visual analytics tools, that help users in analytical reasoning by interactive visual interfaces.
2.5.1 MapReduce
MapReduce is a programming model developed by Google [35] in 2004 for large-scale data processing to cope efficiently with the challenge of processing enormous amounts of data generated by Internet-based applications.
Since its introduction, MapReduce has proven to be applicable to a wide range of domains, including machine learning and data mining, social data analysis, financial analysis, scientific simulation, image retrieval and process-ing, blog crawlprocess-ing, machine translation, language modellprocess-ing, and bioinformat-ics. Today, MapReduce is widely recognized as one of the most important programming models for Cloud computing environments, being it supported
by Google and other leading Cloud providers such as Amazon, with its Elastic MapReduce service6, and Microsoft, with its HDInsight7, or on top of private Cloud infrastructures such as OpenStack, with its Sahara service8.
Hadoop9 is the most used open source MapReduce implementation for
developing parallel applications that analyze big amounts of data. It can be adopted for developing distributed and parallel applications using many pro-gramming languages (e.g., Java, Ruby, Python, C++). Hadoop relieves devel-opers from having to deal with classical distributed computing issues, such as load balancing, fault tolerance, data locality, and network bandwidth saving. The Hadoop project is not only about the MapReduce programming model (Hadoop MapReduce module), as it includes other modules such as:
• Hadoop Distributed File System (HDFS): a distributed file system provid-ing fault tolerance with automatic recovery, portability across heteroge-neous commodity hardware and operating systems, high-throughput ac-cess and data reliability.
• Hadoop YARN : a framework for cluster resource management and job
scheduling.
• Hadoop Common: common utilities that support the other Hadoop
mod-ules.
In particular, thanks to the introduction of YARN in 2013, Hadoop turns from a batch processing solution into a platform for running a large variety of data applications, such as streaming, in-memory, and graphs analysis. As a result, Hadoop became a reference for several other frameworks, such as: Giraph for graph analysis; Storm for streaming data analysis; Hive, which is a data warehouse software for querying and managing large datasets; Pig, which is as a dataflow language for exploring large datasets; Tez for exe-cuting complex directed-acyclic graph of data processing tasks; Oozie, which is a workflow scheduler system for managing Hadoop jobs. Besides Hadoop and its ecosystem, several other MapReduce implementations have been im-plemented within other systems, including GridGain, Skynet, MapSharp and Twister [45]. One of the most popular alternative to Hadoop is Disco, which is a lightweight, open-source framework for distributed computing. The Disco core is written in Erlang, a functional language designed for building fault-tolerant distributed applications. Disco has been used for a variety of purposes, such as log analysis, text indexing, probabilistic modeling and data mining.
6 http://aws.amazon.com/elasticmapreduce/ 7 http://azure.microsoft.com/services/hdinsight/ 8 http://wiki.openstack.org/wiki/Sahara 9 http://hadoop.apache.org/
2.5.2 Spark
Apache Spark10is another Apache framework for Big Data processing. Differ-ently from Hadoop in which intermediate data are always stored in distributed file systems, Spark stores data in RAM memory and queries it repeatedly so as to obtain better performance for some class of applications (e.g., iterative machine learning algorithms) [148]. For many years, Hadoop has been con-sidered the leading open source Big Data framework, but recently Spark has become the more popular so that it is supported by every major Hadoop ven-dors. In fact, for particular tasks, Spark is up to 100 times faster than Hadoop in memory and 10 times faster on disk. Several other libraries have been built on top of Spark: Spark SQL for dealing with SQL and DataFrames, MLlib for machine learning, GraphX for graphs and graph-parallel computation, and Spark Streaming to build scalable fault-tolerant streaming applications.
For these reasons, Spark is becoming the primary execution engine for data processing and, in general, a must-have for Big Data applications. But even though in some applications Spark can be considered a better alterna-tive to Hadoop, in many other applications it has limitations that make it complementary to Hadoop. The main limitation of Spark is that it does not provide its own distributed and scalable storage system, that is a fundamental requirement for Big Data applications that use huge and continually increas-ing volume of data stored across a very large number of nodes. To overcome this lack, Spark has been designed to run on top of several data sources, such as Cloud object storage (e.g., Amazon S3 Storage, Swift Object Storage), distributed filesystem (e.g., HDFS), no-SQL databases (e.g., HBase, Apache Cassandra), and others. Today an increasing number of big vendors, such Mi-crosoft Azure or Cloudera, offer Spark as well as Hadoop, so developers can choose the most suitable framework for each data analytics application.
With respect to Hadoop, Spark loads data from data sources and executes most of its tasks in RAM memory. In this way, Spark reduces significantly the time spent in writing and reading from hard drives, so that the execu-tion is far faster than Hadoop. Regarding task recovering in case of failures, Hadoop flushes all of the data back to the storage after each operation. Simi-larly, Spark allow recovering in case of failures by arranging data in Resilient Distributed Datasets (RDD), which are a immutable and fault-tolerant collec-tions of records which can be stored in the volatile memory or in a persistent storage (e.g., HDFS, HBase). Moreover, Spark’s real-time processing capa-bility is increasingly being used by Big Data analysts into applications that requires to extract insights quickly from data, such as recommendation and monitoring systems.
Several big companies and organizations use Spark for Big Data analysis purpose: for example, Ebay uses Spark for log transaction aggregation and analytics, Kelkoo for product recommendations, SK Telecom analyses mobile usage patterns of customers.
10
2.5.3 Mahout
Apache Mahout11is an open-source framework that provides scalable imple-mentations of machine learning algorithms that are applicable on big input. Originally, the Mahout project provided implementations of machine learning algorithms executable on the top of Apache Hadoop framework. But the com-parison of the performance of Mahout algorithms on Hadoop with other ma-chine learning libraries, showed that Hadoop spends the majority of the pro-cessing time to load the state from file system at every intermediate step [123]. For these reasons, the latest version of Mahout goes beyond Hadoop and provides several machine learning algorithms for collaborative filtering, clas-sification, and clustering, implemented not only in Hadoop MapReduce, but also in Spark, H2O12
. Both Apache Spark and H2O process data in mem-ory so they can achieve a significant performance gain when compared to Hadoop framework for specific classes of applications (e.g., interactive jobs, real-time queries, and stream data) [123]. In addition, the latest release of Mahout introduces a new math environment, called Samsara [89], that helps users in creating their own math providing general linear algebra and statisti-cal operations. In the following, some examples for each algorithm’s category are listed: analyzing user history and preferences to suggest accurate recom-mendations (collaborative filtering), selecting whether a new input matches a previously observed pattern or not (classification), and grouping large number of things together into clusters that share some similarity (clustering) [112]. In the future, Mahout will support Apache Flink13
, an open source platform that provides data distribution, communication, and fault tolerance for distributed computations over data streams.
2.5.4 Hunk
Hunk14is a commercial data analysis platform developed by Splunk for rapidly exploring, analyzing and visualizing data in Hadoop and NoSQL data stores. Hunk uses a set of high-level user and programming interfaces to offer speed and simplicity of getting insights from large unstructured and structured datasets. One of the key components of the Hunk architecture is the Splunk Virtual Index. This system decouples the storage tier from the data access and analytics tiers, so enabling Hunk to route requests to different data stores. The analytics tier is based on Splunks Search Processing Language (SPL) de-signed for data exploration across large, different datasets. The Hunk web framework allows building applications on top of the Hadoop Distributed File System (HDFS) and/or the NoSQL data store.
11 http://mahout.apache.org/ 12 http://www.h2o.ai 13 https://flink.apache.org/ 14 http://www.splunk.com/en us/products/hunk.html
Developers can use Hunk to build their Big Data applications on top of data in Hadoop using a set of well known languages and frameworks. Indeed, the framework enables developers to integrate data and function-ality from Hunk into enterprise Big Data applications using a web frame-work, documented REST API and software development kits for CSharp,Java, JavaScript, PHP and Ruby. Also common development languages such as HTML5 and Python can be used by developers.
The Hunk framework can be deployed on on-premises Hadoop clusters or private Clouds and it is available as a preconfigured instance on the Amazon public Cloud using the Amazon Web Services (AWS). This public Cloud so-lution allows Hunk users to utilize the Hunk facilities and tools from AWS, also exploiting commodity storage on Amazon S3, according to a pay-per-use model. Finally, the framework implements and makes available a set of ap-plications that enable the Hunk analytics platform to explore, explore and visualize data in NoSQL and other data stores, including Apache Accumulo, Apache Cassandra, MongoDB and Neo4j. Hunk is also provided in combina-tion with the Cloudera’s enterprise data hub to develop large-scale applica-tions that can access and analyze Big Data sets.
2.5.5 Sector/Sphere
Sector/Sphere15 is a Cloud framework designed at the University of Illinois-Chicago to implement data analysis applications involving large, geograph-ically distributed datasets in which the data can be naturally processed in parallel [63]. The framework includes two components: a storage service called Sector, which manages the large distributed datasets with high reliability, high performance IO, and a uniform access, and a compute service called Sphere, which makes use of the Sector service to simplify data access, increase data IO bandwidth, and exploit wide area high performance networks. Both of them are available as open source software16
. Sector is a distributed storage system that can be deployed over a wide area network and allows users to ingest and download large datasets from any location with a high-speed network con-nection to the system. The system can be deployed over a large number of commodity computers (called nodes), located either within a data center or across data centers, which are connected by high-speed networks.
In an example scenario, nodes in the same rack are connected by 1 Gbps networks, two racks in the same data center are connected by 10 Gbps net-works, and two different data centers are connected by 10 Gbps networks. Sector assumes that the datasets it stores are divided into one or more sepa-rate files, called slices, which are replicated and distributed over the various nodes managed by Sector.
The Sector architecture includes a Security server, a Master server and a number of Slave nodes. The Security server maintains user accounts, file 15
http://sector.sourceforge.net/
16
access information, and the list of authorized slave nodes. The Master server maintains the metadata of the files stored in the system, controls the running of the slave nodes, and responds to users’ requests. The Slaves nodes store the files managed by the system and process the data upon the request of a Sector client. Sphere is a compute service built on top of Sector and provides a set of programming interfaces to write distributed data analysis applications. Sphere takes streams as inputs and produces streams as outputs. A stream consists of multiple data segments that are processed by Sphere Processing Engines (SPEs) using slave nodes. Usually there are many more segments than SPEs. Each SPE takes a segment from a stream as an input and produces a segment of a stream as output. These output segments can in turn be the input segments of another Sphere process. Developers can use the Sphere client APIs to initialize input streams, upload processing function libraries, start Sphere processes, and read the processing results.
2.5.6 BigML BigML17
is a system provided as a Software-as-a-Service (SaaS) for discovering predictive models from data and it uses data classification and regression algorithms. The distinctive feature of BigML is that predictive models are presented to users as interactive decision trees. The decision trees can be dynamically visualized and explored within the BigML interface, downloaded for local usage and/or integration with applications, services, and other data analysis tools. Recently, BigML launched its PaaS solution, called BigML PredictServer, which is a dedicated machine image that can be deployed on Amazon AWS. An example of BigML prediction model is shown in Figure 2.2. Extracting and using predictive models in BigML consists in multiple steps, as detailed as follows:
• Data source setting and dataset creation. A data source is the raw data from which a user wants to extract a predictive model. Each data source instance is described by a set of columns, each one representing an in-stance feature, or field. One of the fields is considered as the feature to be predicted. A dataset is created as a structured version of a data source in which each field has been processed and serialized according to its type (numeric, categorical, etc.).
• Model extraction and visualization. Given a dataset, the system generates the number of predictive models specified by the user, who can also choose the level of parallelism level for the task. The interface provides a visual tree representation of each predictive model, allowing users to adjust the support and confidence values and to observe in real time how these values influence the model.
• Prediction making. A model can be used individually, or in a group (the so-called ensemble, composed of multiple models extracted from different 17
Fig. 2.2. Example of BigML prediction model for air pollution (source: bigml.com).
parts of a dataset), to make predictions on new data. The system provides interactive forms to submit a predictive query for a new data using the input fields from a model or ensemble. The system provides APIs to auto-mate the generation of predictions, which is particularly useful when the number of input fields is high.
• Models evaluation. BigML provides functionalities to evaluate the good-ness of the predictive models extracted. This is done by generating per-formance measures that can be applied to the kind of extracted model (classification or regression).
2.5.7 Kognitio Analytical Platform
Kognitio Analytical Platform18, available as Cloud based service or supplied as a pre-integrated appliance, allows users to pull very large amounts of data from existing data storage systems into high-speed computer memory, allow-ing complex analytical questions to be answered interactively. Although Kog-nitio has its own internal disk subsystem, it is primarily used as an analytical 18
layer on top of existing storage/data processing systems, e.g., Hadoop clus-ters and/or existing traditional disk-based data warehouse products, Cloud storage, etc. A feature called External Tables allows persistent data to re-side on external systems. Using this feature the system administrator, or a privileged user, can easily setup access to data that resides in another envi-ronment, typically a disk store such as the above-mentioned Hadoop clusters and data warehouse systems. To a final user, the Kognitio Analytical Plat-form looks like a relational database management system (RDBMS) similar to many commercial databases. However, unlike these databases, Kognitio has been designed specifically to handle analytical query workload, as opposed to the more traditional on-line transaction processing (OLTP) workload. Key reasons of Kognitios high performance in managing analytical query workload are:
• Data is held in high-speed RAM using structures optimized for in-memory analysis, which is different from a simple copy of disk-based data, like a traditional cache.
• Massively Parallel Processing (MPP) allows scaling out across large arrays of low-cost industry standard servers, up to thousands nodes.
• Query parallelization allows every processor core on every server to be equally involved in every query.
• Machine code generation and advanced query plan optimization techniques ensure every processor cycle is effectively used to its maximum capacity. Parallelism in Kognitio Analytical Platform fully exploits the so-called shared nothing distributed computing approach, in which none of the nodes share memory or disk storage, and there is no single point of contention across the system.
2.5.8 Data Analysis Workflows
A workflow consists of a series of activities, events or tasks that must be performed to accomplish a goal and/or obtain a result. For example, a data analysis workflow can be designed as a sequence of pre-processing, analysis, post-processing, and interpretation steps. At a practical level, a workflow can be implemented as a computer program and can be expressed in a program-ming language or paradigm that allows expressing the basic workflow steps and includes mechanisms to orchestrate them.
Workflows have emerged as an effective paradigm to address the com-plexity of scientific and business applications. The wide availability of high-performance computing systems, Grids and Clouds, allowed scientists and engineers to implement more and more complex applications to access and process large data repositories and run scientific experiments in silico on distributed computing platforms. Most of these applications are designed as workflows that include data analysis, scientific computation methods and com-plex simulation techniques. The design and execution of many scientific