Elsevier Editorial System(tm) for Talanta Manuscript Draft
Manuscript Number: TAL-D-18-02274R1
Title: A new multivariate standard addition strategy for stripping voltammetric electronic tongues: application to the determination of Tl(I) and In(III) in samples with complex matrices
Article Type: Research Paper
Keywords: sensor array; multivariate standard addition; partial least squares (PLS) calibration; matrix effect; anodic striping voltammetry Corresponding Author: Dr. Núria Serrano,
Corresponding Author's Institution: First Author: Clara Pérez-Ràfols
Order of Authors: Clara Pérez-Ràfols; Jaume Puy-Llovera; Núria Serrano; Cristina Ariño; Miquel Esteban; José Manuel Díaz-Cruz
Abstract: A new multivariate standard addition strategy applicable to stripping methods was proposed as an extention of the classical
univariate standard addition method for the resolution of complex samples involving overlapped peaks and complex matrices. The proposed strategy consists in alternate additions of the considered analytes and the
further extrapolation to a simulated blank solution measured by skipping the preconcentration step (deposition time = 0). This calibration
approach was successfully tested in tonic water samples spiked with Tl(I) and In(III) using a sensor array based on a SeCyst-SPCNFE and an ex-situ-BiSPCE, providing good concordance between replicates and much better accuracy than the usual multivariate external calibration method.
1 2 3 4 5 6 7 8 9 10 11 12 13 14 15 16 17 18 19 20 21 22 23 24 25 26 27 28 29 30 31 32 33 34 35 36 37 38 39 40 41 42 43 44 45 46 47 48 49 50 51 52 53 54 55 56 57 58 59 60
A new multivariate standard addition strategy for stripping
voltammetric electronic tongues: application to the determination
of Tl(I) and In(III) in samples with complex matrices
Clara Pérez-Ràfols, Jaume Puy-Llovera, Núria Serrano*, Cristina Ariño, Miquel Esteban, José Manuel Díaz-Cruz
Departament d’Enginyeria Química i Química Analítica, Facultat de Química, Universitat de Barcelona, Martí i Franquès 1-11, E–08028 Barcelona (Spain)
Phone: 0034934033706, fax: 0034934021233, e-mail: [email protected] * to whom correspondence should be addressed
ABSTRACT
A new multivariate standard addition strategy applicable to stripping methods was proposed as an extention of the classical univariate standard addition method for the resolution of complex samples involving overlapped peaks and complex matrices. The proposed strategy consists in alternate additions of the considered analytes and the further extrapolation to a simulated blank solution measured by skipping the preconcentration step (deposition time = 0). This calibration approach was successfully tested in tonic water samples spiked with Tl(I) and In(III) using a sensor array based on a SeCyst-SPCNFE and an ex-situ-BiSPCE, providing good concordance between replicates and much better accuracy than the usual multivariate external calibration method.
Keywords: sensor array, multivariate standard addition, partial least squares (PLS) calibration, matrix effect, anodic striping voltammetry
*Revised Manuscript (clean copy)
1 2 3 4 5 6 7 8 9 10 11 12 13 14 15 16 17 18 19 20 21 22 23 24 25 26 27 28 29 30 31 32 33 34 35 36 37 38 39 40 41 42 43 44 45 46 47 48 49 50 51 52 53 54 55 56 57 58 59 60
1. INTRODUCTION
Analytical determinations based on instrumental analysis require the use of calibration methods. When univariate instrumental responses are involved, three well-known calibration methods can be used [1,2]: external standard, standard addition and internal standard.
All these methods can be easily applied in samples involving one analyte or several analytes as far as they do not interfere with each other. However, when there are interactions between species and/or overlapped signals the application of these univariate methodologies is hindered and it is necessary to use multivariate strategies that include a data treatment based on chemometric techniques such as Partial Least Squares (PLS) [3].
Regarding voltammetric measurements, in the last two decades the use of sensors arrays or electronic tongues has been popularized for the resolution of complex samples [4,5]. These devices are based on the use of sensors with reduced selectivity, grouped in arrays with cross-response characteristics. This strategy is usually coupled to an external calibration that involves an experimental design with both a set of training samples to build a calibration model and a set of test samples to validate such calibration model. Once the model has been validated, it can be later applied to predict the concentration of the analytes in unknown samples, essentially by interpolation. This strategy would be the multivariate analog to the external standard univariate method and has been extensively applied in numerous works [6–10]. It usually provides good results for calibration, validation and prediction of unknown samples, which share the same matrix, but presents problems when complex samples are analysed. In these cases, the use of matrix matched standard, where the matrix sample is simulated, can be useful [11]. However, the reconstruction of the matrix sample is not always straightforward
1 2 3 4 5 6 7 8 9 10 11 12 13 14 15 16 17 18 19 20 21 22 23 24 25 26 27 28 29 30 31 32 33 34 35 36 37 38 39 40 41 42 43 44 45 46 47 48 49 50 51 52 53 54 55 56 57 58 59 60
and obtaining a blank sample (without analytes) is not possible. Therefore the application of matrix matching methods cannot be easily generalized. In voltammetric univariate measurements matrix problems are solved by the use of the standard addition method. Since the early years of Chemometrics, several approaches have been proposed to attempt the extrapolation of the standard addition method to the multivariate analysis. Kowalski and coworkers [12–14] developed the generalized standard addition method (GSAM) based on the classical least-squares calibration (CLS) of a ‘signal increase’ matrix where the spectra of the sample was subtracted from the original spectra of the successive standard additions [15–18]. An improved PLS version of GSAM was later proposed [19]. However, the use of the GSAM decayed along the 1990’s when the study of second order data grabbed the attention of multivariate standard addition strategies [20–23]. Another approach proposed by Melucci and Locatelli [24] was based on the direct application of PLS to the sample voltammograms before and after the additions, the construction of a calibration model related to added concentrations and the extrapolation to a blank voltammogram for the prediction of the concentration of the target analyte. However, this method was never applied to the determination of more than one analyte. More recently, our group extended this approach to multicomponent analysis [25]. It should be pointed out that this method requires the extrapolation to the voltammogram of a blank solution. However, obtaining this ‘true blank solution’ is not so easy in real complex samples already containing the analyte, since it is really difficult, if not impossible, to remove analytes from such real samples without altering their matrix. In techniques like differential pulse voltammetry (DPV), there are not many solutions available for that. A compromise strategy would be to find unpolluted samples of similar matrix to these under study. In contrast, techniques involving the preconcentration of the analyte such as anodic stripping voltammetry (ASV) present
1 2 3 4 5 6 7 8 9 10 11 12 13 14 15 16 17 18 19 20 21 22 23 24 25 26 27 28 29 30 31 32 33 34 35 36 37 38 39 40 41 42 43 44 45 46 47 48 49 50 51 52 53 54 55 56 57 58 59 60
much more possibilities in this sense, since the deposition time is a key parameter, which can help to simulate the voltammogram of a hypothetic “true blank” solution (that is not possible to obtain or prepare) from the measurement of the real sample at deposition time zero. This idea is based on the fact that the overall stripping signal is essentially the sum of a first component consisting in the capacitive currents caused by the scan and a second one including the faradaic currents of the analytes that are accumulated on and stripped from the electrode. Eventually, the first component can also include some faradaic currents from oxidations and reductions of the matrix not involved in accumulation/stripping processes. From this fact, a hypothesis is made assuming that a decrease in the deposition time practically does not affect the first component but it causes a decrease in the second component comparable to the effect of a decrease in the concentration of the analytes in the solution. In the limiting case of deposition time tending to zero, the voltammogram would consist only on the first component and, hence, should be very similar to that obtained at non-zero deposition time in the absence of analytes in the solution, i.e., in the measurement of a blank. Thus, in the present paper we propose a methodology where, in order to simulate this ‘true blank solution’ in ASV measurements, the deposition step is skipped (deposition time, td=0) to avoid the accumulation of the target analytes on the electrode surface. For this purpose, we have chosen typical analytes usually determined by ASV, i.e. trace metal ions. Specifically we have considered the simultaneous determination of Tl(I) and In(III) in a spiked tonic water solution (as an example of a complex food matrix sample) using a sensor array based on a bismuth film screen-printed carbon electrode (BiSPCE) and a selenocystine modified screen-printed carbon nanofiber electrode (SeCyst-SPCNFE). These sensors, which have been proved to provide good results for metal ion determination [26,27], were chosen for this array due to their cross-response. This
1 2 3 4 5 6 7 8 9 10 11 12 13 14 15 16 17 18 19 20 21 22 23 24 25 26 27 28 29 30 31 32 33 34 35 36 37 38 39 40 41 42 43 44 45 46 47 48 49 50 51 52 53 54 55 56 57 58 59 60
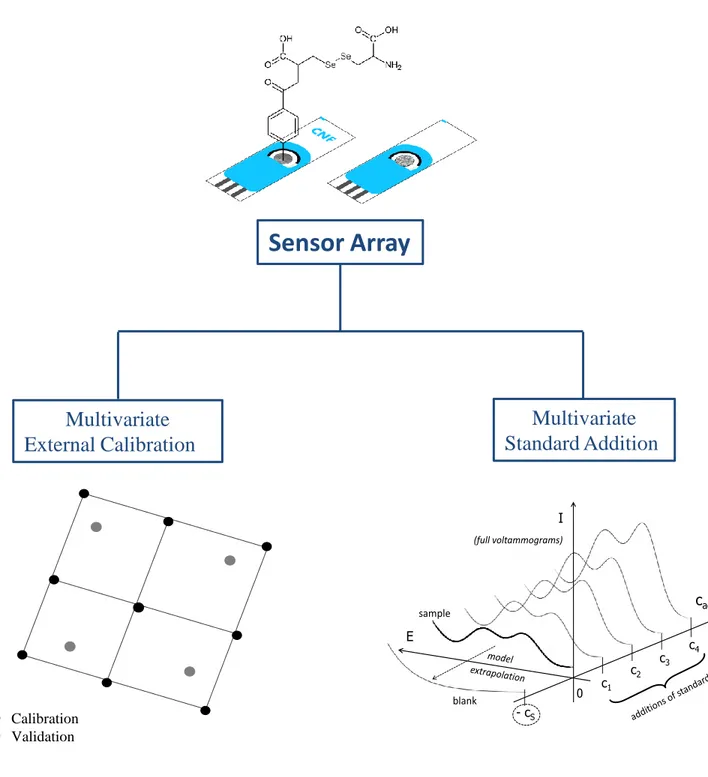
experimental system was selected to compare this novel multivariate standard addition calibration method with the more common multivariate external calibration used for electronic tongues (Figure 1).
2. EXPERIMENTAL SECTION
2.1. Chemicals and Solutions.
4-aminobenzoic acid (ABA), selenocystine, N-hydroxysulfosuccinimide (sulfo-NHS) and sodium nitrite were supplied by Sigma-Aldrich (St. Louis, MO, USA). 2-(N-morpholino)-ethanesulfonic (MES), potassium ferrocyanide K4[Fe(CN)6]·3H2O, sodium acetate and acetic acid were obtained from Merck (Darmstadt, Germany). Potassium ferricyanide K3[Fe(CN)6] and ethanol were provided by Panreac (Barcelona, Spain). N-(3-dimethylaminopropyl)-N′-ethylcarbodiimide hydrochloride (EDC) was purchased from AppliChem (Darmstadt, Germany). All reagents were of analytical grade and ultrapure water (Milli-Q plus 185 system, Millipore) was used in all experiments.
Standard Bi(III) and In(III) 1.000 g L-1 atomic absorption standard solutions were supplied by Fluka. Tl(I) stock solutions 10-3 mol L-1 were prepared from TlCl, supplied by Sigma-Aldrich, and stock solution concentrations were determined by ICP-MS. Tonic water samples were purchased in local supermarkets.
2.2. Instrumentation.
An Autolab System PGSTAT12 (EcoChemie, The Netherlands), in its multichannel configuration and using GPES Multichannel 4.7 software package (EcoChemie) was used to perform differential pulse anodic stripping voltammetric (DPASV) measurements.
1 2 3 4 5 6 7 8 9 10 11 12 13 14 15 16 17 18 19 20 21 22 23 24 25 26 27 28 29 30 31 32 33 34 35 36 37 38 39 40 41 42 43 44 45 46 47 48 49 50 51 52 53 54 55 56 57 58 59 60
Ag|AgCl|KCl (3 mol L-1) and Pt wire were used as reference and auxiliary electrodes respectively. A selenocystine modified electrode prepared from a commercial carbon nanofiber modified screen-printed electrode (SeCyst-SPCNFE) and an ex-situ bismuth film prepared from a commercial carbon screen-printed electrode (ex-situ-BiSPCE)
were used as working electrodes. Both carbon and carbon nanofiber screen-printed electrodes (ref. 110, DS SPCE and ref. 110CNF, DS SPCE respectively) were of 4 mm diameter and were purchased from DropSens (Oviedo, Spain). These screen-printed electrodes were connected to the Autolab System by means of flexible cables (ref. CAC, DropSens).
pH measurements were performed using a Crison micro pH 2000 pH-meter.
All measurements were carried out at room temperature (20 °C) and a purified nitrogen atmosphere (Linde N50) was used for the bismuth film preparation.
2.3. Preparation of modified SPEs.
2.3.1. Selenocystine modified electrode (SeCyst-SPCNFE)
Selenocystine was immobilized on the surface of a SPCNFE following a procedure previously reported [26]. Briefly, NaNO2 0.2 mmol L-1 was added to a cooled solution of ABA 73 mmol L-1 in HCl 1 mol L-1 for the in-situ generation of the aryl diazonium salt. After 5 min of stirring in an ice bath, 10 µL of the resulting solution were dropped onto the electrode surface and the electrochemical grafting process was performed by applying 10 cyclic voltammetric cycles from 0 V to -1 V at 0.2 V s-1. Then, to activate the generated carboxylic groups, the electrodes were incubated for 1 h with 10 μL of a 26 mmol L−1 EDC and 35 mmol L−1 sulfo-NHS solution in 100 mmol L−1 MES buffer (pH 4.5). Finally, the activated groups reacted over night with the amine terminal groups of selenocystine (94 mmol L-1 in ethanol absolute) at 4 ºC.
1 2 3 4 5 6 7 8 9 10 11 12 13 14 15 16 17 18 19 20 21 22 23 24 25 26 27 28 29 30 31 32 33 34 35 36 37 38 39 40 41 42 43 44 45 46 47 48 49 50 51 52 53 54 55 56 57 58 59 60
2.3.2. Ex-situ bismuth film electrode (ex-situ-BiSPCE)
The deposition of the bismuth film was based on a procedure previously reported [28]. The SPCE, the auxiliary and the reference electrodes were immersed in a solution of 0.2 mol L-1 acetate buffer (pH 4.5) containing 100 mg L-1 Bi(III). After 10 min of deaeration, a deposition potential (Ed) of -0.80 V was applied with stirring for 300 s, followed by a rest period of 20 s, without stirring.
2.4. Voltammetric measurements.
DPASV measurements of Tl(I) and In(III) using a sensor array based on SeCyst-SPCNFE and ex-situ-BiSPCE were carried out applying a deposition potential (Ed) of -1.30 V during a deposition time (td) of 120 s with stirring, followed by a rest period (tr) of 5 s, and scanning the potential from -1.30 V to -0.65 V, using a step potential of 5 mV, pulse times of 50 ms,pulse amplitudes of 100 mV and a scan rate of 10 mV s-1. Individual calibration plots were obtained increasing Tl(I) or In(III) concentrations in 0.1 mol L-1 acetate buffer solution (pH 4.5).
For tonic water samples determinations, two different calibration strategies, multivariate external calibration and multivariate standard addition, were explored (Figure 1).
2.4.1. Multivariate external calibration
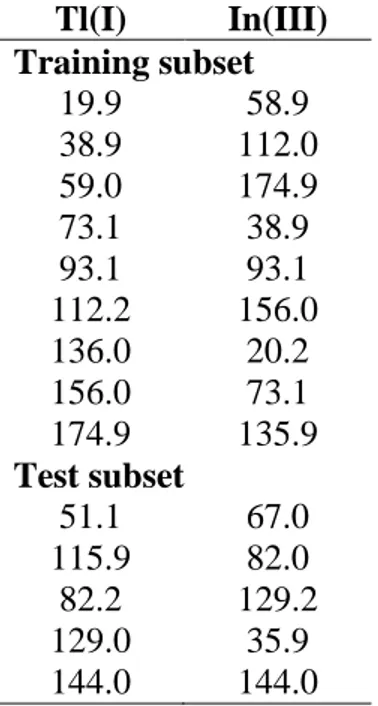
For the multivariate external calibration a set of 9 training samples and 5 validation samples was used in which training samples were distributed in a square design and validation samples along the experimental domain (Table 1). These samples were prepared in acetate buffer (pH 4.5) by appropriate dilution of stock solutions. For the determination of Tl(I) and In(III) in spiked tonic water samples three replicates were considered.
1 2 3 4 5 6 7 8 9 10 11 12 13 14 15 16 17 18 19 20 21 22 23 24 25 26 27 28 29 30 31 32 33 34 35 36 37 38 39 40 41 42 43 44 45 46 47 48 49 50 51 52 53 54 55 56 57 58 59 60
In order to eliminate the remaining bound metals, both working electrodes were cleaned by applying a cleaning potential of -0.30 V during 15 s in 0.1 mol L-1 HClO4 after each measurements. This potential was selected as the highest potential that can be used without oxidising the bismuth film.
2.4.2. Multivariate standard addition
For the multivariate standard addition the spiked tonic water diluted with acetate buffer (pH 4.5) was placed in the cell. Prior to starting the calibration curves, blank measurements were simulated by scanning twice the sample without the application of a deposition time (td = 0).
The calibration curves were performed using the above-mentioned DPASV conditions (Ed = -1.30 V, td = 120 s). Firstly, three replicates of the initial sample were measured and then alternate additions of Tl(I) and In(III) solutions were carried out.
Three replicates of this calibration strategy were performed for the spiked tonic water sample, using a new set of electrodes for each replicate.
2.5. Sample preparation.
Tonic water samples were spiked with 100 µg L-1 of Tl(I) and 225 µg L-1 of In(III). Voltammetric measurements were carried out after dilution of the spiked tonic water sample with acetate buffer at pH 4.5 (dilution factor 1:2).
2.6. Data processing.
In order to build data matrices, DPASV measurements using both SeCyst-SPCNFE and
ex-situ-BiSPCE were considered. Firstly, different pre-processing steps were performed,
1 2 3 4 5 6 7 8 9 10 11 12 13 14 15 16 17 18 19 20 21 22 23 24 25 26 27 28 29 30 31 32 33 34 35 36 37 38 39 40 41 42 43 44 45 46 47 48 49 50 51 52 53 54 55 56 57 58 59 60
multiple points instead of two adjacent points) and autoscale. These pre-processed data were used for the PLS models built in both calibration methods.
For the multivariate external calibration, PLS1 models were constructed using Tl(I) or In(III) concentrations present on each calibration sample. For both Tl(I) and In(III) models 4 latent variables (LV) were selected.
For the multivariate standard addition, PLS1 models were constructed using Tl(I) and In(III) standard added concentrations. 5 and 3 LVs were selected for Tl(I) and In(III) PLS1 models respectively.
Data pre-processment, variable selection and construction of PLS model were performed using Matlab® [29] with PLS-toolbox [30].
3. RESULTS AND DISCUSSION
It is well-known that the voltammetric simultaneous determination of Tl(I) and In(III) is problematic due to their overlapped stripping signals. In a previous study [9], it was concluded that one working electrode was not enough for the resolution of this system whereas the use of a sensor array based on two electrodes with cross-response provided much better results, allowing the simultaneous determination of both metal ions in synthetic and spiked tap water samples.
In this work a sensor array based on a SeCyst-SPCNFE and an ex-situ-BiSPCE was selected to study the resolution of this system in samples with stronger matrix effect. In order to study the cross-response between these two sensors, individual calibrations of Tl(I) and In(III) were carried out for each sensor. Firstly, the Ed was optimized to -1.30 V to ensure the best separation between Tl(I) and In(III) peaks. Then, twelve standard solutions of increasing concentration ranging from 1.1 to 200.0 µg L-1 of either Tl(I) or In(III) were measured, obtaining well-defined peaks in all cases (data not
1 2 3 4 5 6 7 8 9 10 11 12 13 14 15 16 17 18 19 20 21 22 23 24 25 26 27 28 29 30 31 32 33 34 35 36 37 38 39 40 41 42 43 44 45 46 47 48 49 50 51 52 53 54 55 56 57 58 59 60
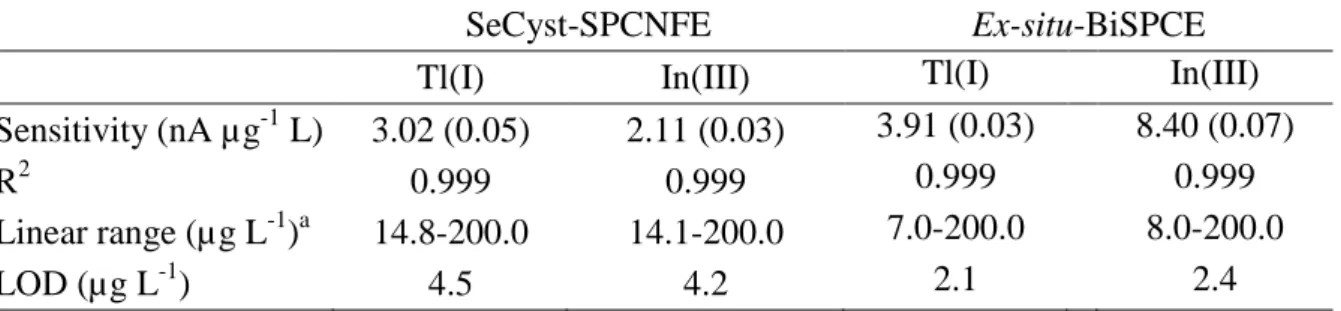
shown). Calibration data for both sensors are reported in Table 2. As it can be observed, good linear responses were achieved for both sensors in all the concentration range considered, with limits of detection (LOD), calculated as 3 times the standard deviation of the intercept over the slope of the calibration curve, at the level of a few µg L-1 and slightly lower in the case of ex-situ-BiSPCE. Regarding sensitivities, which were obtained from the slopes of the calibration curves, higher sensitivities were achieved with ex-situ-BiSPCE, especially for In(III), and a cross-selectivity was obtained between both sensors since SeCyst-SPCNFE is more sensitive to Tl(I) than In(III) and
ex-situ-BiSPCE is more sensitive to In(III) than Tl(I). Therefore, the sensor array based
on SeCyst-SPCNFE and ex-situ-BiSPCE presents the cross-response required for the simultaneous determination of Tl(I) and In(III).
3.1. Multivariate external calibration
A PLS model was built in order to simultaneously determine Tl(I) and In(III) using the considered sensor array. With this aim, the above mentioned training and test subsets were taken into account (Table 1). The concentration range considered was 19.9-174.9 µg L-1 for Tl(I) and 20.2-174.9 µg L-1 for In(III).
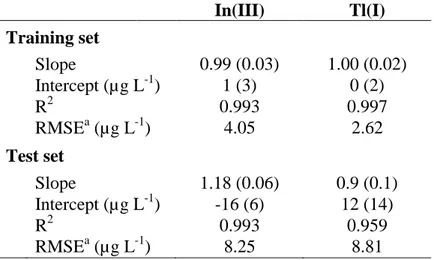
Considering that data pretreatment plays a key role in the building of a PLS model, voltammograms were firstly smoothed and baseline corrected with automatic weighted least squares (AWLS). The resulting voltammograms for SeCyst-SPCNFE and ex-situ-BiSPCE are shown in Figures 2A and 2B respectively. Then the data were derived using gap-segment function and autoscaled. PLS1 models for the determination of Tl(I) and In(III) were built from these pretreated data. Figures 3A and 3B show the comparison graphs between predicted vs expected concentration of Tl(I) and In(III) respectively and general parameters of the regression lines including slopes, intercepts, correlation
1 2 3 4 5 6 7 8 9 10 11 12 13 14 15 16 17 18 19 20 21 22 23 24 25 26 27 28 29 30 31 32 33 34 35 36 37 38 39 40 41 42 43 44 45 46 47 48 49 50 51 52 53 54 55 56 57 58 59 60
coefficients and the root mean square errors (RMSE) for both training and test subsets are summarized in Table 3. Good results were achieved for target metal ions for both training and test subsets, with intercepts close to 0, slopes and correlation coefficients close to one and small RMSE values.
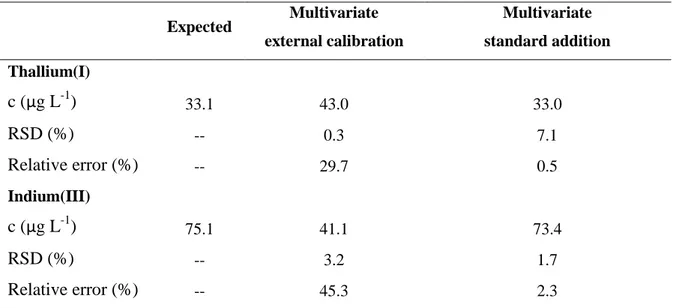
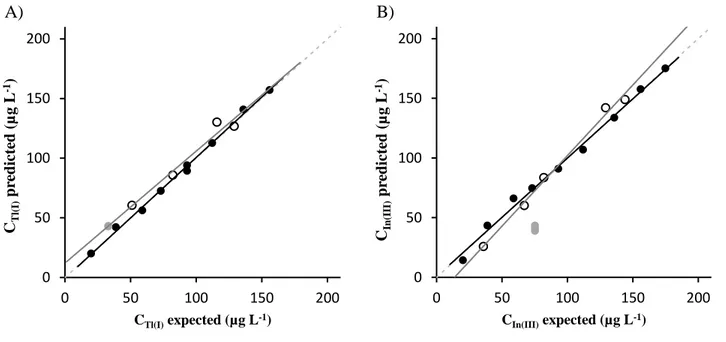
After the successful calibration and validation of the system, these models were applied for the simultaneous determination of Tl(I) and In(III) in spiked tonic water samples. As it can be observed in Figure 3 and Table 4, the concordance between samples, inferred by the provided RSD (%), was good for both studied metal ions. However, the accuracy of the results, inferred by the relative error (%), is very poor, particularly in the case of In(III). This lack of accuracy could be attributed to the sample matrix effect. As it can be seen in Figure 2, the tonic water voltammograms (thick lines) present a different behaviour than calibration or validation samples prepared in acetate buffer (thin lines), i.e. lower signals for similar concentrations and shifted potentials, which cause different overlapping of peaks (higher overlapping in the case of SeCyst-SCPNFE and lower overlapping for ex-situ-BiSPCE).
These results differ from previously reported studies [9], where the use of a sensor array coupled to PLS models could successfully predict Tl(I) and In(III) concentrations in tap water. This fact could be attributed to the higher complexity of the matrix in the sample here considered. Hence, this external calibration strategy provides successful results when simple real samples, where analytes behave similar to calibration and validation samples, are studied; whereas more complex matrix samples, which affect the analytes behaviour, lead to poor results.
1 2 3 4 5 6 7 8 9 10 11 12 13 14 15 16 17 18 19 20 21 22 23 24 25 26 27 28 29 30 31 32 33 34 35 36 37 38 39 40 41 42 43 44 45 46 47 48 49 50 51 52 53 54 55 56 57 58 59 60
3.2. Multivariate standard addition
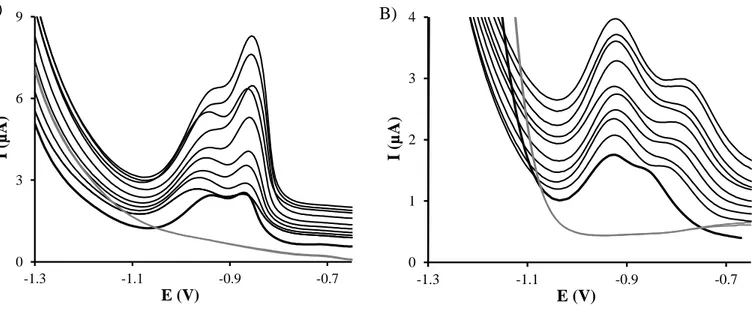
As it was mentioned above, the use of multivariate external calibration does not allow the simultaneous determination of Tl(I) and In(III) in samples with complex matrices. Therefore in this work a novel calibration strategy, multivariate standard addition, was pioneeringly applied for the resolution of this system by stripping voltammetry. Figures 4A and 4B show the DPASV measurements resulting from the application of this calibration approach on both SeCyst-SPCNFE and ex-situ-BiSPCE respectively.
The proposed strategy requires the measurement of a “true blank” solution, which usually is difficult to obtain in samples that already contain the target analytes but, as discussed before, can be simulated in accumulation methods like stripping voltammetry, by measuring at zero deposition time. In this sense, a blank voltammogram was firstly simulated using the considered sensor array by scanning the spiked tonic water sample from -1.30 V to -0.65 V without any deposition step (td = 0) (grey lines in Figure 4). With the removal of the deposition step, the deposition of Tl(I) and In(III) on the electrode surface is avoided but the matrix sample effect is still considered. It should be pointed out the importance of this simulated blank voltammogram since it will be used as target of the subsequent PLS model. For this reason, this simulated blank was recorded twice. After that, the spiked tonic water sample was measured with the optimized stripping conditions (Ed = -1.30 V and td = 120 s) (thick lines in Figure 4) and finally the voltammograms after successive alternate additions of both metal ions were also recorded (thin lines in Figure 4).
As in the case of multivariate external calibration, a data pre-treatment is required prior to the construction of PLS1 models. In this sense, the data were derived using gap-segment function and autoscaled. In this case PLS1 models were calibrated using the obtained signals of the initial sample and the subsequent additions as X variable and the
1 2 3 4 5 6 7 8 9 10 11 12 13 14 15 16 17 18 19 20 21 22 23 24 25 26 27 28 29 30 31 32 33 34 35 36 37 38 39 40 41 42 43 44 45 46 47 48 49 50 51 52 53 54 55 56 57 58 59 60
added concentrations of Tl(I) or In(III) as Y variable. Then this model was applied to determine Tl(I) or In(III) concentrations in the spiked tonic water sample by the extrapolation of these concentrations to the simulated blank voltammogram. Figures 5A and 5B show a representative comparison graph of predicted vs. expected added concentrations for both Tl(I) and In(III) respectively.
Three replicates of the spiked tonic water sample were analysed using the proposed multivariate standard addition methodology and the mean of the concentrations obtained for both target metal ions are shown in Table 4. As it can be observed, good concordance between replicates was obtained even though the presence of deposited Tl(I) and In(III) change the hydrogen evolution potential, as seen by the change of the background current at low potentials. In comparison to the multivariate external calibration a much better accuracy, inferred by the relative error (%), was achieved for both Tl(I) and In(III). These results suggest that the multivariate standard addition calibration method is a more suitable strategy than the multivariate external calibration for the measurement of overlapped analytes in samples with complex matrices. This improvement could be also attributed to the fact that in the multivariate standard addition approach only a few Tl/In concentration ratios are involved whereas in the multivariate external calibration the Tl/In concentration ratios vary significantly along the experimental design, causing higher potential shifts as it can be seen comparing Figures 2 and 4. Therefore, the loss of linearity caused by this potential shift makes it more difficult to model this system by PLS.
1 2 3 4 5 6 7 8 9 10 11 12 13 14 15 16 17 18 19 20 21 22 23 24 25 26 27 28 29 30 31 32 33 34 35 36 37 38 39 40 41 42 43 44 45 46 47 48 49 50 51 52 53 54 55 56 57 58 59 60
4. CONCLUSIONS
In this work the simultaneous voltammetric determination of Tl(I) and In(III) in tonic water using a sensor array based on a SeCyst-SPCNFE and an ex-situ-BiSPCE was studied as a model system of overlapped peaks present in samples with complex matrices. Firstly the resolution of this system was attempted using the more classical multivariate external calibration but, although this system was successfully calibrated and validated for both metal ions using synthetic samples, the complexity of the tonic water matrix did not allow the accurate determination of Tl(I) and In(III).
Taking into account that in the case of univariate analysis these problems related to matrix complexity can be overcome by the application of the standard addition method, a newly proposed multivariate standard addition strategy was tested for the resolution of this system. Taking advantage of the presence of an accumulation step in anodic stripping techniques, a new approach was postulated based on the removal of this accumulation step (td = 0) to simulate a true blank solution. This strategy was successfully applied allowing the simultaneous determination of Tl(I) and In(III) in the spiked tonic water sample, inferred from the good accuracy and low RSD (%).
Thus, this proposed multivariate standard addition calibration method is postulated as an alternative calibration strategy for the resolution of complex systems involving overlapped peaks and complex matrices that cannot be neither solved by the multivariate external calibration nor simulated to allow the application of matrix matching strategies. In particular, the proposed methodology can be a powerful incentive for the development of stripping voltammetric electronic tongues able to work in really complicate media.
1 2 3 4 5 6 7 8 9 10 11 12 13 14 15 16 17 18 19 20 21 22 23 24 25 26 27 28 29 30 31 32 33 34 35 36 37 38 39 40 41 42 43 44 45 46 47 48 49 50 51 52 53 54 55 56 57 58 59 60
5. AKNOWLEDGMENTS
This work is supported by the Generalitat of Catalonia (Project 2014SGR269). Clara Pérez-Ràfols acknowledges the Spanish Ministry of Economy and Competitiveness for a Ph.D grant (reference FPU15/ 02140).
6. REFERENCES
[1] D.C. Harris, Quantitative Chemical Analysis, 7th ed., W.H. Freeman and Company, New York, USA, 2007.
[2] J.N. Miller, J.C. Miller, Statistics and Chemometrics for Analtical Chemistry, 6th ed., Pearson, Essex, UK, 2010.
[3] S.D. Brown, R. Tauler, B. Walczak Eds., Comprehensive Chemometrics, Elsevier Science, Amsterdam, The Netherlands, 2009.
[4] M. del Valle, Electronic tongues employing electrochemical sensors, Electroanalysis. 22 (2010) 1539–1555. doi:10.1002/elan.201000013.
[5] M. del Valle, Sensor arrays and electronic tongue systems, Int. J. Electrochem. 2012 (2012) 1–12. doi:10.1155/2012/986025.
[6] N. Serrano, B. Prieto-Simón, X. Cetó, M. del Valle, Array of peptide-modified electrodes for the simultaneous determination of Pb(II), Cd(II) and Zn(II), Talanta. 125 (2014) 159–166. doi:10.1016/j.talanta.2014.02.052.
[7] A. González-Calabuig, D. Guerrero, N. Serrano, M. del Valle, Simultaneous voltammetric determination of heavy metals by use of crown ether-modified electrodes and chemometrics, Electroanalysis. 28 (2016) 663–670.
doi:10.1002/elan.201500512.
[8] N. Serrano, A. González-Calabuig, M. del Valle, Crown ether-modified
1 2 3 4 5 6 7 8 9 10 11 12 13 14 15 16 17 18 19 20 21 22 23 24 25 26 27 28 29 30 31 32 33 34 35 36 37 38 39 40 41 42 43 44 45 46 47 48 49 50 51 52 53 54 55 56 57 58 59 60
Pb(II) and Cu(II), Talanta. 138 (2015) 130–137. doi:10.1016/j.talanta.2015.01.044.
[9] C. Pérez-Ràfols, N. Serrano, J.M. Díaz-Cruz, C. Ariño, M. Esteban,
Simultaneous determination of Tl(I) and In(III) using a voltammetric sensor array, Sensors Actuators B Chem. 245 (2017) 18–24.
doi:10.1016/j.snb.2017.01.089.
[10] C. Pérez-Ràfols, N. Serrano, J.M. Díaz-Cruz, C. Ariño, M. Esteban, A screen-printed voltammetric electronic tongue for the analysis of complex mixtures of metal ions, Sensors Actuators B Chem. 250 (2017) 393–401.
doi:10.1016/j.snb.2017.04.165.
[11] R.H. Labrador, J. Olsson, F. Winquist, R. Martínez-Máñez, J. Soto,
Determination of bisulfites in wines with an electronic tongue based on pulse voltammetry, Electroanalysis. 21 (2009) 612–617. doi:10.1002/elan.200804457. [12] B.E. Saxberg, B.R. Kowalski, Generalized standard addition method, Anal.
Chem. 51 (1979) 1031–1038.
[13] C. Jochum, P. Jochum, B.R. Kowalski, Error propagation and optimal performance in multicomponent Analysis, Anal. Chem. 53 (1981) 85–92. doi:10.1021/ac00224a023.
[14] J.H. Kalivas, Precision and stability for the generalized standard addition method, Anal. Chem. 55 (1983) 565–567. doi:10.1021/ac00254a033.
[15] J.H. Kalivas, B.R. Kowalski, Automated multicomponent analysis with
corrections for interferences and matrix effects, Anal. Chem. 55 (1983) 532–535. [16] R.W. Gerlach, B.R. Kowalski, The generalized standard addition method:
intermetallic interferences in anodic stripping voltammetry, Anal. Chim. Acta. 134 (1982) 119–127.
1 2 3 4 5 6 7 8 9 10 11 12 13 14 15 16 17 18 19 20 21 22 23 24 25 26 27 28 29 30 31 32 33 34 35 36 37 38 39 40 41 42 43 44 45 46 47 48 49 50 51 52 53 54 55 56 57 58 59 60
[17] E.A.G. Zagatto, A.O. Jacintho, F.J. Krug, B.F. Reis, Flow injection systems with inductively-coupled argon plasma atomic emission spectrometry: Part 2. The generalized standard addition method, Anal. Chim. Acta. 145 (1983) 169–178. [18] J.H. Kalivas, B.R. Kowalski, Generalized standard addition method for
multicomponent instrument characterization and elimination of interferences in inductively coupled plasma spectrometry, Anal. Chem. 53 (1981) 2207–2212. [19] I.E. Frank, J.H. Kalivas, B.R. Kowalski, Partial least squares solutions for
multicomponent analysis, Anal. Chem. 55 (1983) 1800–1804.
[20] V.A. Lozano, R. Tauler, G.A. Ibañez, A.C. Olivieri, Standard addition analysis of fluoroquinolones in human serum in the presence of the interferent salicylate using lanthanide-sensitized excitation-time decay luminescence data and multivariate curve resolution, Talanta. 77 (2009) 1715–1723.
doi:10.1016/j.talanta.2008.10.020.
[21] E. Peré-Trepat, S. Lacorte, R. Tauler, Alternative calibration approaches for LC – MS quantitative determination of coeluted compounds in complex environmental mixtures using multivariate curve resolution, Anal. Chim. Acta. 595 (2007) 228– 237. doi:10.1016/j.aca.2007.04.011.
[22] V.A. Lozano, G. Ibañez, A.C. Olivieri, A novel second-order standard addition analytical method based on data processing with multidimensional partial least-squares and residual bilinearization, Anal. Chim. Acta. 651 (2009) 165–172. doi:10.1016/j.aca.2009.08.027.
[23] A. Afkhami, M. Abbasi-Tarighat, M. Bahram, H. Abdollahi, A new strategy for solving matrix effect in multivariate calibration standard addition data using combination of H-point curve isolation and H-point standard addition methods, Anal. Chim. Acta. 613 (2008) 144–151. doi:10.1016/j.aca.2008.02.056.
1 2 3 4 5 6 7 8 9 10 11 12 13 14 15 16 17 18 19 20 21 22 23 24 25 26 27 28 29 30 31 32 33 34 35 36 37 38 39 40 41 42 43 44 45 46 47 48 49 50 51 52 53 54 55 56 57 58 59 60
[24] D. Melucci, C. Locatelli, Multivariate calibration in differential pulse stripping voltammetry using a home-made carbon-nanotubes paste electrode, J.
Electroanal. Chem. 675 (2012) 25–31. doi:10.1016/j.jelechem.2012.04.020. [25] K. Martínez, C. Ariño, J.M. Díaz-Cruz, N. Serrano, M. Esteban., Multivariate
standard addition for the analysis of overlapping voltammetric signals in the presence of matrix effects: application to the simultaneous determination of hydroquinone and catechol, Chemom. Intell. Lab. Sys. 178 (2018) 32-38. doi: 10.1016/j.chemolab.2018.05.002.
[26] J. Puy-Llovera, C. Pérez-Ràfols, N. Serrano, J.M. Díaz-Cruz, C. Ariño, M. Esteban, Selenocystine modified screen-printed electrode as an alternative sensor for the voltammetric determination of metal ions, Talanta. 175 (2017) 501–506. doi:10.1016/j.talanta.2017.07.089.
[27] N. Serrano, A. Alberich, J.M. Díaz-Cruz, C. Ariño, M. Esteban, Coating
methods, modifiers and applications of bismuth screen-printed electrodes, TrAC - Trends Anal. Chem. 46 (2013) 15–29. doi:10.1016/j.trac.2013.01.012.
[28] N. Serrano, J.M. Díaz-Cruz, C. Ariño, M. Esteban, Ex situ deposited bismuth film on screen-printed carbon electrode : A disposable device for stripping voltammetry of heavy metal ions, Electroanalysis. (2010) 1460–1467. doi:10.1002/elan.200900183.
[29] Matlab, version R2008b ed., Mathworks Inc.: Natick, MA, USA, (2008).
Calibration Validation E cadd I c1 c2 c3 c4 - cS sample blank 0 b) (full voltammograms)
Multivariate
External Calibration
Multivariate
Standard Addition
Tl
In
Table 1. Concentration values, in µg L-1, for the samples included in the training and test subsets. Tl(I) In(III) Training subset 19.9 58.9 38.9 112.0 59.0 174.9 73.1 38.9 93.1 93.1 112.2 156.0 136.0 20.2 156.0 73.1 174.9 135.9 Test subset 51.1 67.0 115.9 82.0 82.2 129.2 129.0 35.9 144.0 144.0 Table 1
Table 2. Calibration data for the individual determination of Tl(I) and In(III) on SeCyst-SPCNFE and ex-situ-BiSPCE at Ed of -1.30 V, td of 120 s and pH 4.5. The standard deviations are denoted by parenthesis.
a
The lowest value of the linear range was considered from the LOQ
SeCyst-SPCNFE Ex-situ-BiSPCE
Tl(I) In(III) Tl(I) In(III)
Sensitivity (nA µg-1 L) 3.02 (0.05) 2.11 (0.03) 3.91 (0.03) 8.40 (0.07)
R2 0.999 0.999 0.999 0.999
Linear range (µg L-1)a 14.8-200.0 14.1-200.0 7.0-200.0 8.0-200.0
LOD (µg L-1) 4.5 4.2 2.1 2.4
Table 3. Main parameters of the regression lines obtained in the comparison between predicted vs. expected values of the training and test subsets for In(III) and Tl(I) (ranges calculated at the 95% confidence level) for the sensor array. The standard deviations are denoted by parenthesis.
aRMSE: root mean square error
In(III) Tl(I) Training set Slope 0.99 (0.03) 1.00 (0.02) Intercept (µg L-1) 1 (3) 0 (2) R2 0.993 0.997 RMSEa (µg L-1) 4.05 2.62 Test set Slope 1.18 (0.06) 0.9 (0.1) Intercept (µg L-1) -16 (6) 12 (14) R2 0.993 0.959 RMSEa (µg L-1) 8.25 8.81 Table 3
Table 4. Total concentrations of Tl(I) and In(III) determined in tonic water samples by DPASV on the multisensor array formed by SeCyst-SPCNFE / ex-situ-BiSPCE modified electrodes using the multivariate external calibration and the multivariate standard addition method.
Expected Multivariate external calibration Multivariate standard addition Thallium(I) c (µg L-1) 33.1 43.0 33.0 RSD (%) -- 0.3 7.1 Relative error (%) -- 29.7 0.5 Indium(III) c (µg L-1) 75.1 41.1 73.4 RSD (%) -- 3.2 1.7 Relative error (%) -- 45.3 2.3 Table 4
Caption to figures
Figure 1. Scheme of the different multivariate calibration strategies used.
Figure 2. DPASV voltammograms on SeCyst-SPCNFE (A) and ex-situ-BiSPCE (B) in acetate buffer at pH 4.5, td of 120 s and an Ed of -1.30 V of the calibration and validation samples used for the multivariate external calibration (thin lines) of Tl(I) and In(III) and tonic water samples spiked with different concentrations of these metal ions (thick lines).
Figure 3. Comparison graphs of predicted vs. expected concentrations obtained with the sensor array for Tl(I) (A) and In(III) (B) for training set (●, ), test set (○, ) and spiked tonic water samples (●). Dashed line represents theoretical diagonal line (y=x).
Figure 4. DPASV voltammograms on SeCyst-SPCNFE (A) and ex-situ-BiSPCE (B) applying a td of 120 s and an Ed of -1.30 V of the spiked tonic water sample (thick line), the subsequent alternative Tl(I) and In(III) additions (thin lines) and the simulated blank at td = 0 (grey line).
Figure 5. Comparison graphs of predicted vs. expected added concentrations obtained with the sensor array for Tl(I) (A) and In(III) (B) for the spiked tonic water and the subsequent alternative additions (●) and for the extrapolation of the concentration in the simulated blank (●).
Figure 1
Sensor Array
Calibration Validation E cadd I c1 c2 c3 c4 - cS sample blank 0 b) (full voltammograms)Multivariate
External Calibration
Multivariate
Standard Addition
Figure 1Figure 2
A) B)
Figure 3
A) B) 0 50 100 150 200 0 50 100 150 200 CT l( I) p re d ict ed ( µ g L -1) CTl(I)expected (µg L-1) 0 50 100 150 200 0 50 100 150 200 CIn (III) p re d ict ed ( µ g L -1) CIn(III)expected (µg L-1) Figure 3Figure 4
A) B) 0 3 6 9 -1.3 -1.1 -0.9 -0.7 I (µ A) E (V) 0 1 2 3 4 -1.3 -1.1 -0.9 -0.7 I (µ A ) E (V) Figure 4R² = 0.995 -100 -75 -50 -25 0 25 50 75 100 -80 -30 20 70 cIn( II I) p red (µ g L -1) cIn(III)add (µg L-1)