*Corresponding author. E-mail: [email protected]
This is an Open Access article distributed under the terms of the Creative Commons Attribution License (http://creativecommons. org/licenses/by/4.0/), which permits unrestricted use, distribution, and reproduction in any medium, provided the original author and source are credited.
Copyright © 2021 The Author(s). Published by Vilnius Gediminas Technical University
ISSN: 2029-4913 / eISSN: 2029-4921 2021 Volume 27 Issue 1: 262–279
https://doi.org/10.3846/tede.2021.13989
A GENETIC PROGRAMMING APPROACH
FOR ESTIMATING ECONOMIC SENTIMENT IN THE BALTIC
COUNTRIES AND THE EUROPEAN UNION
Oscar CLAVERIA 1*, Enric MONTE 2, Salvador TORRA 3
1AQR-IREA, University of Barcelona, Barcelona, Spain
2Department of Signal Theory and Communications, Polytechnic University of Catalunya,
Barcelona, Spain
3Riskcenter-IREA, Department of Econometrics, Statistics and Applied Economics,
University of Barcelona, Barcelona, Spain
Received 12 December 2019; accepted 11 October 2020
Abstract. In this study, we introduce a sentiment construction method based on the evolution of
survey-based indicators. We make use of genetic algorithms to evolve qualitative expectations in order to generate country-specific empirical economic sentiment indicators in the three Baltic re-publics and the European Union. First, for each country we search for the non-linear combination of firms’ and households’ expectations that minimises a fitness function. Second, we compute the frequency with which each survey expectation appears in the evolved indicators and examine the lag structure per variable selected by the algorithm. The industry survey indicator with the highest predictive performance are production expectations, while in the case of the consumer survey the distribution between variables is multi-modal. Third, we evaluate the out-of-sample predictive performance of the generated indicators, obtaining more accurate estimates of year-on-year GDP growth rates than with the scaled industrial and consumer confidence indicators. Finally, we use non-linear constrained optimisation to combine the evolved expectations of firms and consumers and generate aggregate expectations of of year-on-year GDP growth. We find that, in most cases, aggregate expectations outperform recursive autoregressive predictions of economic growth.
Keywords: genetic algorithms, sentiment indicators, qualitative expectations, forecasting,
eco-nomic growth.
JEL Classification: C51, C55, C63, C83, C93.
Introduction
Agents’ actions tend to depend on their expectations (Doronina Koltan et al., 2013). In a context of high uncertainty like the current one, agents’ expectations become crucial for economic analysis. As expectations are not directly observable, they are usually obtained
through surveys. The fact that survey expectations capture the beliefs and intentions of eco-nomic agents prior to the publication of GDP growth figures, makes them especially useful for economic forecasting.
Since 1961, the European Commission (EC) has conducted surveys of businesses and consumers in the member states of the European Union (EU). These surveys ask respond-ents if they expect an increase or decrease in their economic expectations, thus facilitating comparability between countries’ economic conditions. From the difference between the re-sponse percentages of the extreme categories, a diffusion index called balance is calculated and published regularly at the end of each month.
Soft computing, as opposed to traditional computing, deals with approximate models and gives solutions to complex real-life problems (Ibrahim, 2016). Soft computing is based on techniques such as artificial neural networks (Petković et al., 2017; Safa et al., 2020), sup-port vector regression (Jović et al., 2016; Shamshirband et al., 2014) and genetic algorithms (Petković et al., 2016; Shariati et al., 2020). The main motivation of the study is to propose a methodology for the construction of indicators of economic sentiment based on the model-ling of agents’ expectations through genetic algorithms.
The main advantage of the proposed approach is that it does not require knowledge of the underlying interconnections between different expectations as a precondition for its ap-plication. As a result, it allows evolving a wide range of business and consumer expectations without any required knowledge regarding their interactions in order to generate non-line-ar country-specific economic sentiment indicators. Therefore, the proposed data-based ap-proach is especially suitable in this case, in which there is no a priori functional relationship between the survey balances and the year-on-year growth rate of GDP.
The aim of the paper is three-fold. First, we propose an alternative approach for economic sentiment construction based on symbolic regression (SR) and genetic programming (GP). This procedure is based on a heuristic search of the optimal functional form that combines qualitative survey data in order to estimate economic growth. The main motivation to use this approach lies in its flexibility, given that the search algorithm not only selects those sur-vey indicators that best describe economic growth dynamics, but also combines the selected variables without imposing any type of restriction on the models or the parameters. With this aim, we use all survey variables from the industry and consumer surveys in the three Baltic States (Estonia, Latvia and Lithuania) and the EU to evolve country-specific non-lin-ear economic sentiment indicators for firms and households. We design two alternative SR experiments for each country: one for the industry survey in order to produce an evolved in-dustry confidence indicator and another one for the consumer survey to generate an evolved consumer confidence indicator.
Second, we use the obtained evolved expressions to compute the frequency distribution and the lag structure of the different survey variables selected by the genetic algorithms to track economic growth in each of the Baltic countries and the EU. The proposed empirical approach searches among the space of all models and, expresses the potential solutions in the form of computer programs, which are represented as tree structures where every tree node has an operator function and every terminal node an operand. This general representation scheme makes mathematical expressions easy to evolve and evaluate.
Third, with the aim of evaluating the performance of the evolved indicators, we analyse their out-of-sample predictive capacity, comparing it with that obtained using the EC confi-dence indicators. On the other hand, we use Granger causality tests to evaluate the predictive power of firms and consumer expectations of economic growth. Finally, we combine firms’ and consumers’ expectations by means of a generalized reduced gradient non-linear algo-rithm that yields the optimal weights in order to generate aggregate expectations of economic growth that we compare with recursive autoregressive forecasts used as a benchmark.
As a result, we provide researchers and practitioners with three outcomes: (i) evolved sentiment indicators that yield estimates of year-on-year GDP growth rates using survey expectations as the sole input; (ii) insight into the relative importance of the indicators of the industry and the consumer surveys of each country, as well as the lag structure of the selected variables determined by the algorithm; and (iii) the relative weight of the expectations of both firms and consumers in order to improve the forecast accuracy of predictions of economic growth in each country. These results are intended to highlight the value of the information coming from tendency surveys for the economic analysis, and also to provide researchers with an alternative way of generating agents’ expectations through empirical methods.
GP has been applied in robotics (Petković et al., 2016), image processing (Cuevas et al., 2016) and medical diagnosis (de Carvalho Filho et al., 2014). However, its use for economic modelling and forecasting is still recent (Álvarez-Díaz, 2020; Claveria et al., 2019, 2020; Sorić et al., 2019).
In order to cover this deficit, in this study we apply GP to construct indicators of econom-ic sentiment in the Balteconom-ic countries and the EU. With this aim, we use the survey expectations collected in the balances to generate non-linear confidence indicators through an evolution-ary process in which no assumptions are made about agents’ expectations.
The paper is divided into three sections. Next, the applied methodology and the design of the experiments are described. Section 2 presents the dataset and assesses the evolved ex-pressions. Results of the forecasting comparison are provided in Section 3. Finally, the main conclusions and future lines of research are presented.
1. Experimental setup
As stated by Petković et al. (2016), soft computing techniques have shown to be proficient in numerical mapping between data and variables of nonlinear frameworks. Among them, hybrid intelligent systems such as adaptive neuro-fuzzy inference systems, which enhance the ability to automatically learn and adapt, are increasingly being used by researchers in various fields (Nikolić et al., 2017; Toghroli et al., 2014). Other techniques of soft computing that are increasingly being used due to their flexibility for analysing unknown relationships between variables are genetic algorithms.
GP is a heuristic search technique for evolving programs that can be regarded as a gen-eralisation of genetic algorithms (see Katebi et al. (2020) for comparative analysis of meta-heuristic optimization algorithms). This optimization approach is based on the represen-tation of programs in tree structures. SR, as opposed to conventional regression analysis, which is based on a certain ex-ante model specification, uses GP to search for relationships
between a given set of variables and evolves the functions until reaching a solution that can be described as the functional form that best approximates the interactions between the variables of the system.
This function allows not only to visualise relevant links but also makes it possible to de-tect unknown relationships. Given the suitability of genetic algorithms for dede-tecting patterns in large data sets and for the automatic resolution of optimisation problems, GP is increas-ingly being applied in more areas (Alexandridis et al., 2017; Eliiyi et al., 2009; Fernández et al., 2019; Pan et al., 2019). Most of its applications in economics have been made in finance (Acosta-González & Fernández, 2014; Larkin & Ryan, 2008; Vasilakis et al., 2013). Applica-tions of GP in macroeconomics have been scarce (Álvarez-Díaz & Álvarez, 2003, 2005; Chen et al., 2012; Duda & Szydło, 2011; Kotanchek et al., 2010; Koza, 1992; Kronberger et al., 2011; Marković et al., 2017). See Claveria et al. (2017) for a review of recent applications of GP in economics.
GP can be regarded as a generalization of genetic algorithms, which are the most popular type of evolutionary algorithm. This type of algorithm selects the fittest programs for repro-duction to produce new and fitter offspring that become part of the new generation. GP ap-plies operations analogous to natural genetic processes to an initial population of programs: reproduction, crossover and mutation. Operations are applied recursively, generation after generation. The termination criterion can be set, either when a specific program reaches a desired fitness level, or when a predefined number of generations is reached.
In this study, we use GP to find the relationship between a wide spectrum of expectations and year-on-year GDP growth rates. This approach allows deriving algebraic expressions that optimally combine survey expectations to monitor economic outcomes. See Figure 1 for a visual description of the experiment.
To implement the GP experiments, the following items must be predetermined:
1. Initial population – A random population of 70000 functions is generated, from which the best 10000 individuals are selected.
2. Fitness function – The mean square error (MSE) is used to assess the fitness of each individual.
3. Strategy for the selection of parents – The tournament method is used to guarantee the diversity in the population. As a result, the best two of three randomly selected individuals are mated.
4. Probability of a new generation – The mutation probability is set at 0.20 and the cross-over probability at 0.75.
5. Termination criterion – A maximum of 100 generations is set.
On the assumption of having established a minimum fitness as a stopping criterion, if no individual reached it, the process would be repeated using the new generation as the population, so that the fitness of the population would improve in successive generations. Macias-Escobar et al. (2019) showed the effectiveness of population evolvability to solve dynamic optimization problems.
During the evolutionary process there is a trade-off between the level of precision sought and the complexity of the structure of the resulting models. In order to achieve simple and
easy-to-apply functional forms: (i) we limit the arithmetic operators to elementary functions (addition, subtraction, product and division), and (ii) we introduce regularisation terms in the slope, the curvature, and the complexity of the inferred functions. See Ardia et al. (2019) and Hastie et al. (2017) for a justification of the need to regularise. We use the Distributed Evolutionary Algorithms in Python (DEAP) package developed by Fortin et al. (2012).
For each country, we compare two sources of information: annual GDP growth rates and responses from businesses and consumers about the expected direction of change for a wide variety of economic variables. First, we run the experiment for the industry survey and then we repeat the experiment for the consumer survey indicators. As a result, we infer two an-alytical expressions per country: one that combines firms’ expectations to economic growth and, another one that combines consumers’ expectations to economic outcomes.
2. Evolved economic sentiment indicators
In this section we present the output of the GP experiments undertaken, in which the genetic algorithms searched the space of mathematical expressions to find patterns across survey variables that best tracked economic growth dynamics. We used year-on-year growth rates of seasonally adjusted GDP provided by Eurostat (2019) and all monthly and quarterly data from the EC industry and consumer surveys (see Table 1).
Figure 1. Experimental setup – Design of the GP experiment Pseudo Code:
• Initial population of M individuals • Select the best N individuals (N < M) • For Generations = 1 to Number Generations: Mutate all individuals with
a probability P mut
Iterate for the size of the population: Tournament:
select 3 random individuals from the population Mate the two best
* Avg_4 4 ґ2 ґ1 –1 ґ2 Ln() * Avg_4 4 ґ2 ґ1 –1 * 4 ґ2 * Avg_4 4 ґ2 ґ1 –1 * 4 ґ2 Max_4 ґ2 3 ґ3 –1 * (^2) Interchange Parents Offsprings * Avg_4 4 ґ2 ґ1 –1 Max_4 ґ2 3 ґ3 –1 ґ4 –1 / * ґ4 –1 / (^2) * 4 ґ2
Table 1. Survey indicators
Industry survey indicators Consumer survey indicators
X1 Production trend observed in recent months X1 Financial situation over last 12 months X2 Assessment of order-book levels X2 Financial situation over next 12 months X3 Assessment of export order-book levels X3 General economic situation over last 12 months X4 Assessment of stocks of finished products X4 General economic situation over next 12 months X5 Production expectations for the months ahead X5 Price trends over last 12 months
X6 Price expectations for the months ahead X6 Price trends over next 12 months
X7 Employment expectations for the months ahead X7 Unemployment expectations over next 12 months X8 Assessment of current production capacity X8 Major purchases at present
X9 New orders in recent months X9 Major purchases over next 12 months X10 Export expectations for the months ahead X10 Savings at present
X11 Current level of capacity utilization (%) X11 Savings over next 12 months
X12 Competitive position domestic market X12 Statement on financial situation of household X13 Competitive position inside EU X13 Intention to buy a car within the next 12 months X14 Competitive position outside EU X14 Purchase or build a home within the next 12 months
X15 Home improvements over the next 12 months
In both surveys, results are aggregated in balances. For the present study, all survey data were aggregated quarterly. The sample period goes from 2003.Q1 to 2019.Q2, but as the last fourteen quarters are used as the out-of-sample period to evaluate forecast accuracy, we estimate the SRs in the period 2003.Q1-2015.Q4.
We ran two different SR experiments for each country. In the first, we regressed GDP growth on the industry survey indicators to generate evolved industrial confidence indica-tors that give estimates of firms’ expectations regarding the evolution of economic activity (Exp.IND). While in the second, we do the same with consumer survey indicators to infer evolved consumer confidence indicators that provide quantitative estimations of households’ economic growth expectations (Exp.CONS). The obtained evolved indicators for firms and consumers are displayed in Table 2.
With respect to the obtained evolved economic indicators presented in Table 2, we ob-serve differences between the industrial and consumer confidence indicators, showing the former more complex structures, mostly non-linear, including ratios between the survey variables. Regarding the number of lags of the selected variables, these appear indistinctly with and without lags.
We also find that variable X5 from the industry survey (“production expectations for the months ahead”) is the most frequent in the evolved industry indicators, followed by the quarterly variable X14 (“competitive position outside EU”). Regarding consumer expecta-tions, variables X3 (“assessment of the general economic situation over the last 12 months”), X4 (“expectation about the general economic situation over the next 12 months”), X7
(“un-employment expectations over the next 12 months”) and X9 (“major purchases over the next 12 months”) are the variables with the highest predictive power.
Next, we compute the relative frequency with which each survey variable appears in the evolved indicators. Results are summarised in Figure 2. It can be seen that the frequency distribution of the consumer survey variables is multi-modal.
Table 2. Evolved industry and consumer confidence indicators
Evolved industry indicators
Estonia 0 22. * X14 0 22t+ . * X5t-2+ . * X0 22 7t Latvia − − − − − − + − − 1 1 1 1 4 1 0.51* 3 0.51* 5 0.51* 5 14 2 5 5 t t t t t t t X X X X X X X Lithuania −
(
−)
− + + − 4 1 4 9 * 10 6 1.01 4.33* 9 0.11 t t t t X X X X EU(
−) (
− −)
− − + + − + 2 4 3 4 3 0.10* 5 5 * 14 2 0.50 14 2 t t t t t t X X X X X XEvolved consumer indicators Estonia 0 21 11. * X t−3+ . * X0 21 4t−3− . * X0 21 7 0.13t− Latvia 0 10. * X3 0 10t− . * X15t-−1+ . * X0 10 4 0 10t+ . * X + . * X6 0 10t 9 1.01t+ Lithuania 0 10. * X2t−1− . * X0 10 3t-−4+ . * X0 10 4t−2+0 10. * X + . * X6 0 10t 7t EU −
(
(
−)
)
− − − − − − + + 2 − 3+ 4 2 4 2 3 7 * 14 3 5 9t t7t * 10tt t 12tt 9t X X X X X X X X XFigure 2. Bar chart – Relative frequency for survey variables
Consumer survey variables X1 X2 X3 X4 X5 X6 X7 X8 X9 X10 X11 X12 X13 X14 0 0.1 0.2 0.3 Rela tive f req uenc y 0 0.1 0.2 0.3 Rela tive f req uenc y X1 X2 X3 X4 X5 X6 X7 X8 X9 X10 X11 X12 X13X14X15 Industry survey variables
3. Empirical results
In this section we assess the performance of the evolved indicators in four respects. First, we compare the evolution over time of the expectations generated with the proposed indicators with those obtained with the indicators constructed by the EC. Next, we run Granger cau-sality tests to evaluate whether the evolved expectations are useful for forecasting economic growth. Third, we use a non-linear algorithm to compute the weights that optimally com-bine the evolved expectations of firms and consumers to generate aggregate expectations of economic growth. Fourth, we evaluate the out-of-sample performance of the evolved agents’ expectations for several forecast horizons by comparing them to recursive AR forecasts used as a benchmark. Finally, we discuss the obtained results.
3.1. Assessment of the performance of the evolved indicators
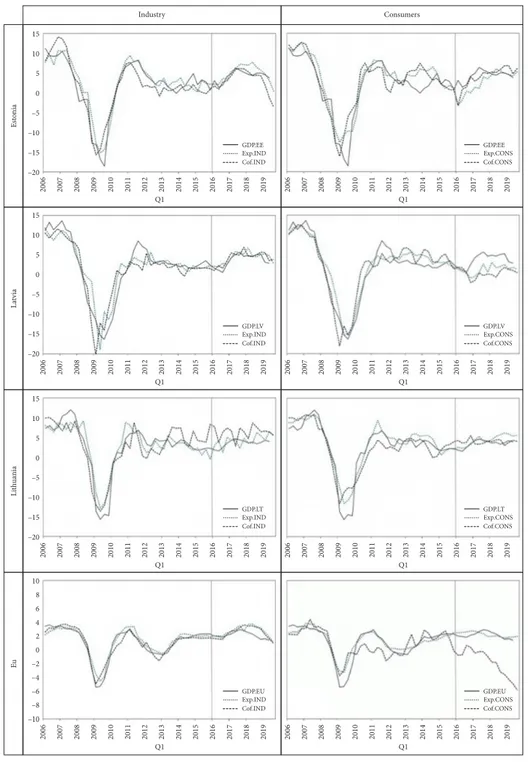
First, in Figure 3 we graph the evolution over time of the obtained expectations about eco-nomic growth of manufacturing firms and of consumers. Both expectations are generated with the evolved confidence indicators and are denoted respectively as Exp.IND and Exp. CONS. We compare them with those obtained with the EC confidence indicators conve-niently rescaled (Cof.IND and Cof.CONS).
Since the result of the evolved confidence indicators is expressed as expected annual GDP growth rates, we have regressed the GDP growth of each country on the different variables of the survey that are part of the EC confidence indicators during the in-sample period (2003. Q1 to 2015.Q4). The OLS estimates of the weights of the components of the respective con-fidence indicators of each country allow us scaling the EC concon-fidence indicators so that they are directly comparable with the evolved confidence indicators. The last fourteen quarters of the sample (2016.Q1 to 2019.Q2) are used as the out-of-sample period. The vertical line in Figure 3 marks the beginning of the out-of-sample period (2016:Q1). We can observe that both indicators move closely together with GDP over the sample period, with the only exception of the scaled consumer confidence in the EU, which shows a poor out-of-sample performance.
Next, we compute the out-of-sample root mean square forecasting error (RMSFE) ob-tained with the different confidence indicators. To test whether the reduction in accuracy is statistically significant, we additionally compute the Diebold-Mariano (DM) statistic of pre-dictive accuracy (Diebold & Mariano, 1995), applying the modification proposed by Harvey et al. (1997). Results in Table 3 show differences between the results obtained for the industry and for consumers comparing predictions of two models: evolved confidence and scaled confidence. For the industry confidence indicators, only in Lithuania the evolved indicator generates significantly lower forecast errors than the scaled confidence indicators. For the consumer confidence indicators, evolved indicators significantly outperform the scaled con-fidence indicators in all countries except Estonia.
By means of Granger causality, Dubinskas and Stungurienė (2010) showed that the im-pact of the financial crisis was greater in Latvia and Estonia than in Lithuania. To comple-ment the previous analysis, we use a Granger causality framework to measure the incremen-tal predictive power of the evolved expectations with respect to the past values of the series
Figure 3. Evolution of GDP, evolved expectations and scaled confidence indicators
Notes: The black line represents the evolution of year-on-year GDP growth rates for each country, the grey dotted line that of firms’ and consumers’ expectations obtained with the evolved indicators (Exp. IND and Exp.CONS), and the dashed black line that of the scaled EC confidence indicators (Cof.IND and Cof.CONS). The vertical line in 2016:Q1 marks the beginning of the out-of-sample period.
2006 2007 2008 2009 2010 2011 2012 2013 2014 2015 2016 2017 2018 2019 Q1 –20 –15 –10 –5 0 5 10 15 2006 2007 2008 2009 2010 2011 2012 2013 2014 2015 2016 2017 2018 2019 Q1 –20 –15 –10 –5 0 5 10 15 2006 2007 2008 2009 2010 2011 2012 2013 2014 2015 2016 2017 2018 2019 Q1 2006 2007 2008 2009 2010 2011 2012 Q12013 2014 2015 2016 2017 2018 2019 –20 –15 –10 –5 0 5 10 15 2006 2007 2008 2009 2010 2011 2012 2013 2014 2015 2016 2017 2018 2019 Q1 2006 2007 2008 2009 2010 2011 2012 Q12013 2014 2015 2016 2017 2018 2019 –10 –8 –4 –2 –6 0 2 4 6 8 10 2006 2007 2008 2009 2010 2011 2012 2013 2014 2015 2016 2017 2018 2019 Q1 2006 2007 2008 2009 2010 2011 2012 Q12013 2014 2015 2016 2017 2018 2019 GDP.EE Exp.IND Cof.IND GDP.EE Exp.CONS Cof.CONS GDP.LV Exp.IND Cof.IND GDP.LV Exp.CONS Cof.CONS GDP.LT Exp.IND Cof.IND GDP.LT Exp.CONS Cof.CONS GDP.EU Exp.IND Cof.IND GDP.EU Exp.CONS Cof.CONS Industry Consumers Esto nia La tvia Li th ua nia Eu
to be predicted. We want to note that the use of year-on-year growth rates of GDP may generate autocorrelated error terms that could bias the results of the Granger causality tests. In Table 4 we present the F-test results for four different forecast horizons (h = 1, 2, 3 and 4 quarters). Again, we observe notable differences between firms’ and consumers’ expectations. In the case of consumers’ expectations, for all forecast horizons expectations Granger-cause GDP growth for Lithuania and the EU, which implies that including past values of expecta-tions improves predicexpecta-tions of the reference series based only on their own past values. For Latvia and Estonia, this is only the case for h = 2. On the contrary, consumers’ expectations are informed by economic growth in Estonia and Latvia, but not in Lithuania and the EU. Regarding firms’ expectations, we find bidirectional causality in all countries for h = 3. For the rest of forecast horizons we find that GDP growth informs firms’ expectations in all cases, but not the other way around. These results corroborate the ones obtained in the previous out-of-sample comparison.
Table 3. Forecast accuracy – RMSFE and DM test
Industry expectations Consumer expectations
RMSFE
DM RMSFE DM
Exp.IND Cof.IND Exp.CONS Cof.CONS
Estonia 1.496 1.668 0.209 Estonia 2.931 2.133 1.278
Latvia 1.193 1.117 0.077 Latvia 2.860 3.974 –3.235
Lithuania 1.570 3.303 –6.102 Lithuania 1.223 1.237 –0.218
EU 0.855 0.761 0.505 EU 0.503 3.968 –5.513
Notes: Diebold-Mariano (DM) test statistic with Newey-West estimator. Null hypothesis: the difference between the two competing series is non-significant. A negative sign of the statistic implies that the second model has bigger forecasting errors. Critical value at the 5% level: 2.145.
Table 4. Granger causality tests
Industry expectations Exp → GDP GDP → Exp h 1 2 3 4 1 2 3 4 Estonia 0.843 0.011 0.004 0.143 0.000 0.002 0.009 0.043 Latvia 0.324 0.009 0.033 0.045 0.002 0.000 0.000 0.001 Lithuania 0.362 0.119 0.047 0.136 0.046 0.013 0.019 0.005 EU 0.362 0.002 0.001 0.005 0.007 0.001 0.008 0.016 Consumer expectations Estonia 0.172 0.004 0.008 0.056 0.047 0.005 0.006 0.172 Latvia 0.384 0.029 0.091 0.450 0.021 0.016 0.102 0.088 Lithuania 0.052 0.000 0.000 0.000 0.263 0.270 0.275 0.455 EU 0.002 0.000 0.000 0.000 0.285 0.246 0.214 0.192
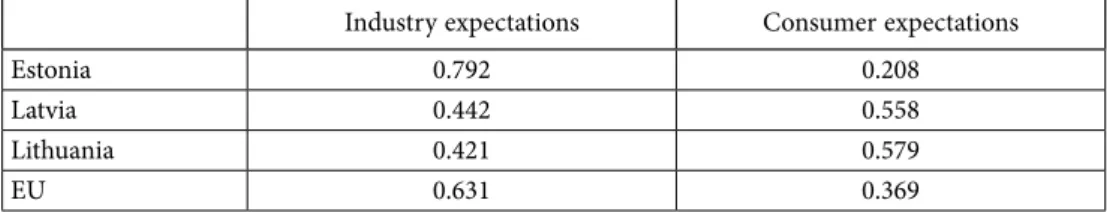
Finally, we combine the forecasts obtained by averaging the evolved expectations of firms and consumers. Gelper and Croux (2010) have shown that the ad hoc calculation of the ag-gregation weights of the components of the European Economic Sentiment Indicator (ESI) constructed by the EC allows improving its predictive capacity. In order to find the relative weights of firms’ and consumers’ evolved expectations, we use non-linear constrained opti-misation (Kwiatkowski, 1992). Specifically, we apply a generalised reduced gradient algorithm that minimises the sum of the squared forecast errors. We impose two restrictions with re-spect to the weights: that they are not negative and that the sum of both is equal to one. The obtained weights are reported in Table 5. It can be seen that while for Estonia and the EU the weights obtained for industry expectations are higher than for consumption, in Latvia and Lithuania they are quite similar.
We combine evolved firms’ and consumers’ expectations by applying the relative weights displayed in Table 5 and generate aggregate expectations of economic growth (Exp.Agg). We compare the obtained expectations to recursive AR forecasts used as a benchmark for several forecast horizons (h = 2, 4 and 8 quarters). We use the Akaike Information Criterion (AIC) for model selection, considering up to a maximum of 8 lags.
We perform a recursive forecasting exercise to evaluate the predictive performance of the evolved expectations across agents for different time horizons. In Table 6 we present the results. Given that the official GDP data is usually published with a delay of around 70 days, expectations are compared with two-quarter ahead forecast (h = 2). As the evolved sentiment indicators are not re-estimated after the last in-sample period (2015.Q4), we also include one- and two-year ahead forecasts (h = 4 and h = 8).
Table 6. Forecast accuracy – Evolved aggregate expectations vs. AR recursive forecasts
Forecast horizon h = 2 h = 4 h = 8
RMSFE RMSFE
DM RMSFE DM RMSFE DM
Exp.Agg AR(p) AR(p) AR(p)
Estonia 1.356 1.970 –1.089 3.449 –2.352 4.285 –2.412
Latvia 1.535 1.965 –1.159 3.205 –1.713 4.158 –2.820
Lithuania 1.234 1.069 0.313 1.600 –0.711 1.825 –0.930
EU 0.568 0.448 0.901 0.728 –0.451 1.023 –0.858
Notes: Exp.Agg denote the linear combination of firms’ and consumers’ evolved expectations applying index tracking. Diebold-Mariano (DM) test statistic with Newey-West estimator. Null hypothesis: the difference between the two competing series is non-significant. A negative sign of the statistic implies that the second model has bigger forecasting errors. Critical value at the 5% level: 2.145.
Table 5. Relative weights of evolved expectations
Industry expectations Consumer expectations
Estonia 0.792 0.208
Latvia 0.442 0.558
Lithuania 0.421 0.579
While for shorter horizons the evolved indicators only outperform the AR forecasts used as a benchmark in half of the countries, as h increases the evolved aggregate expectations yield lower forecast errors in all countries. These results are in line with those obtained by Gelper and Croux (2010), who found that alternative aggregation schemes of survey varia-bles improved their relative forecasting performance at longer forecast horizons. Our results provide mixed evidence about the predictive power of survey expectations, and are in line with recent research. While some authors such as Lacová and Král (2015) and Breitung and Schmeling (2013) did not find sufficient evidence regarding the informative content of survey expectations, most studies offer evidence to the contrary, both for consumption in Chile (Acuña et al., 2020) and Indonesia (Juhro & Iyke, 2020), such as for inflation in Brazil and Turkey (Altug & Çakmakli, 2016) and for GDP in the EA (Claveria et al., 2007; Girardi et al., 2015).
3.2. Discussion
In this study, the informative content of survey expectations is analysed. On the one hand, we evaluate their predictive capacity, both for companies and consumers. On the other, we examine the role that machine learning techniques can play to generate more sophisticated aggregation schemes, allowing the construction of sentiment indicators with greater pre-dictive capacity. The main contribution of the present study is threefold. First, we provide researchers with country-specific evolved confidence indicators that generate quantitative estimates of economic growth. Second, we give insight regarding the relative importance of the variables of the industry and the consumer surveys in the Baltic economies. Additionally, we provide information on the lag structure of the variables selected by the algorithm to form part of the evolved indicators. Finally, we evaluate the relative importance of the expectations of both firms and households to mirror economic growth dynamics in each country.
Some of these issues are of great importance when using qualitative survey expectations for economic analysis, and have been previously addressed by Gelper and Croux (2010). The authors used dynamic factor analysis and partial least squares to aggregate the information coming from the survey indicators that are used by the EC to construct the ESI. When com-paring the alternative aggregation schemes to the ESI, the authors found that the predictive performance of the ESI was comparable to the both alternatives, especially for short forecast horizons.
In this study, we focus on the construction of country-specific data-driven sentiment indicators making use of all available information from the industry and the consumer sur-veys. In spite of the different approach and the different methods used for the construction of sentiment indicators, we also obtain mixed evidence regarding the explanatory power of qualitative survey data on expectations, and observe differences across countries. When aggregating firms’ and consumers’ expectations, we obtain similar results in Estonia and Latvia for short forecast horizons, while in Lithuania the obtained results are closer to those obtained for the EU. Estonia and Latvia are also the countries in which aggregate expecta-tions show a major incremental predictive power when compared to autoregressive forecasts of economic growth.
Furthermore, we show the ability of GP to solve optimisation problems for economic analysis. This research links with previous works by Claveria et al. (2018), Duda and Szydło (2011) and Kotanchek et al. (2010), who made use of GP for the generation of empirical models used for the monitoring of the economic activity.
Regarding the implications for economic policy, we provide researchers and practition-ers with a set of country-specific confidence indicators. The proposed indicators are very easily implementable, and allow transforming the qualitative expectations of companies and consumers into estimates of interannual GDP growth rates. Additionally, the proposed da-ta-driven approach does not make any assumption regarding economic agents’ behaviour. The fact that the confidence indicators have been generated independently for businesses and consumers allows policy makers to obtain information on both the demand and supply sides of the economy.
Conclusions
The main objective of the paper is three-fold. First, we aim to provide researchers with an empirical modelling approach that allows generating economic sentiment indicators, which transform qualitative survey expectations into estimates of annual GDP growth. Second, we assess the predictive performance of the obtained evolved indicators, providing new evidence regarding the predictive capacity and the lag structure of each of the variables contained in the industry and the consumer surveys conducted by the European Commission (2009). Third, we evaluate the out-of-sample forecasting performance of agents’ expectations by comparing them to the official confidence indicators and to autoregressive forecasts used as a benchmark.
Firms’ and consumers’ expectations about the expected direction of change of a wide range of variables are independently evolved to derive country-specific empirical confidence indicators for the industry and consumers. The analysis is done for the three Baltic econo-mies and the European Union. The methodology is based on the application of evolutionary algorithms that search for the optimal non-linear combination of survey expectations that best tracks the evolution of economic outcomes in each economy.
In order to evaluate the information content of the different variables contained in the surveys and their optimal lag structure, we examine the relative frequency with which they are selected by the algorithm for the generation of the evolved mathematical expressions. We find that firms’ production expectations is the variable from the industry survey most fre-quently selected, both contemporaneously and lagged. We also observe that most questions of the consumer survey appear in the indicators, presenting a multi-modal distribution. The assessments and expectations about the general economic situation and the expectations of unemployment and major purchases are the variables that show the highest predictive power.
Then, we compare the out-of-sample forecast accuracy of firms’ and consumers’ evolved expectations to the scaled industry and consumer confidence indicators constructed by the European Commission. We also observe differences across countries and between industry and consumer expectations. For the former, only in Lithuania evolved industry confidence
indicators produce significantly lower forecast errors than the scaled confidence indicator, while for the consumer survey that is the case in Latvia and the European Union.
We evaluate the ability of the empirical confidence indicators to predict economic growth in each country. With this aim, we apply Granger causality tests and find that economic growth informs firms’ expectations in all cases, but not the other way around. Regarding con-sumers’ expectations, for all forecast horizons, expectations Granger-cause GDP growth in Lithuania and the European Union, which implies that including past values of expectations improves predictions of the reference series based only on their own past values.
Finally, we combine firms’ and consumers’ evolved expectations to generate aggregate expectations using a generalised reduced gradient nonlinear algorithm that computes the optimal weight in each country. We assess the out-of-sample forecasting performance of aggregate expectations by comparing their accuracy to that of recursive autoregressive fore-casts used as a benchmark. We find that the relative performance of aggregate expectations improves as the forecast horizon increases.
These findings aim to improve the forecasting potential of business and consumer survey data in the Baltic countries and the European Union and, provide new tools to construct in-dicators that anticipate future demand growth for planning purposes. While we have shown the usefulness of genetic programming for solving optimisation problems, we want to stress the empirical nature of the obtained evolved expressions. Another issue derived from the flexibility of the data-driven approach lies in the fact that there may be multicollinearity between the variables of the expressions generated by the algorithms. Accordingly, an issue left for further research is the the design and implementation of recursive experiments to check the robustness of the evolved expressions.
Funding
This work was supported by the Spanish Ministry of Science and Innovation under Grant PID2019-107579RB-I00.
Author contributions
The manuscript is a joint work of the three co-authors. All authors read and approved the final manuscript.
Disclosure statement
The authors declare that they have no competing interests.
Acknowledgements
References
Acosta-González, E., & Fernández, F. (2014). Forecasting financial failure of firms via genetic algo-rithms. Computational Economics, 43(2), 133–157. https://doi.org/10.1007/s10614-013-9392-9
Acuña, G., Echevarría, C., & Pinto-Gutiérrez, C. A. (2020). Consumer confidence and consumption: Empirical evidence from Chile. International Review of Applied Economics, 34(1), 75–93.
https://doi.org/10.1080/02692171.2019.1645816
Alexandridis, A. K., Kampouridis, M., & Cramer, S. (2017). A comparison of wavelet networks and genetic programming in the context of temperature derivatives. International Journal of Forecasting, 33(1), 21–47. https://doi.org/10.1016/j.ijforecast.2016.07.002
Altug, S., & Çakmakli, C. (2016). Forecasting inflation using survey expectations and target inflation: Evidence from Brazil and Turkey. International Journal of Forecasting, 32(1), 138–153.
https://doi.org/10.1016/j.ijforecast.2015.03.010
Álvarez-Díaz, M. (2020). Is it possible to accurately forecast the evolution of Brent crude oil prices? An answer based on parametric and nonparametric forecasting methods. Empirical Economics, 59(3), 1285–1305. https://doi.org/10.1007/s00181-019-01665-w
Álvarez-Díaz, M., & Álvarez, A. (2003). Forecasting exchange rates using genetic algorithms. Applied
Economics Letters, 10(6), 319–322. https://doi.org/10.1080/13504850210158250
Álvarez-Díaz, M., & Álvarez, A. (2005). Genetic multi-model composite forecast for non-linear predic-tion of exchange rates. Empirical Economics, 30(3), 643–663.
https://doi.org/10.1007/s00181-005-0249-5
Ardia, D., Bluteau, K., & Boudt, K. (2019). Questioning the news about economic growth: Sparse fore-casting using thousands of news-based sentiment values. International Journal of Forefore-casting, 35(4), 1370–1386. https://doi.org/10.1016/j.ijforecast.2018.10.010
Breitung, J., & Schmeling, M. (2013). Quantifying survey expectations: What’s wrong with the prob-ability approach? International Journal of Forecasting, 29(1), 142–154.
https://doi.org/10.1016/j.ijforecast.2012.07.005
Chen, X., Pang, Y., & Zheng, G. (2012). Macroeconomic forecasting using GP based vector error cor-rection model. In J. Wang (Ed.), Business intelligence in economic forecasting: technologies and
tech-niques (pp. 1–15). IGI Global. https://doi.org/10.4018/978-1-61350-456-7.ch317
Claveria, O., Monte, E., & Torra, S. (2017). Using survey data to forecast real activity with evolutionary algorithms. A cross-country analysis. Journal of Applied Economics, 20(2), 329–349.
https://doi.org/10.1016/S1514-0326(17)30015-6
Claveria, O., Monte, E., & Torra, S. (2018). A data-driven approach to construct survey-based indicators by means of evolutionary algorithms. Social Indicators Research, 135(1), 1–14.
https://doi.org/10.1007/s11205-016-1490-3
Claveria, O., Monte, E., & Torra, S. (2019). Evolutionary computation for macroeconomic forecasting.
Computational Economics, 53(2), 833–849. https://doi.org/10.1007/s10614-017-9767-4
Claveria, O., Monte, E., & Torra, S. (2020). Economic forecasting with evolved confidence indicators.
Economic Modelling, 93, 576–585. https://doi.org/10.1016/j.econmod.2020.09.015
Claveria, O., Pons, E., & Ramos, R. (2007). Business and consumer expectations and macroeconomic forecasts. International Journal of Forecasting, 23(1), 47–69.
https://doi.org/10.1016/j.ijforecast.2006.04.004
Cuevas, E., Zaldivar, D., & Perez-Cisneros, M. (2016). Applications of evolutionary computation in image processing and pattern recognition. Springer International Publishing.
de Carvalho Filho, A. O., de Sampaio, W. B., Silva, A. C., de Paiva, A. C., Nunes, R. A., & Gattass, M. (2014). Automatic detection of solitary lung nodules using quality threshold clustering, genetic algorithm and diversity index. Artificial Intelligence in Medicine, 60(3), 165–177.
https://doi.org/10.1016/j.artmed.2013.11.002
Diebold, F. X., & Mariano, R. (1995). Comparing predictive accuracy. Journal of Business and Economic
Statistics, 13(3), 253–263. https://doi.org/10.1080/07350015.1995.10524599
Doronina Koltan, N., Girdzijauskas, S., & Štreimikienė, D. (2013). Market capacity and consumer be-haviour from logistic analysis view. Technological and Economic Development of Economy, 19(3), 448–464. https://doi.org/10.3846/20294913.2013.823134
Dubinskas, P., & Stungurienė, S. (2010). Alterations in the financial markets of the Baltic countries and Russia in the period of economic downturn. Technological and Economic Development of Economy, 16(3), 502–515. https://doi.org/10.3846/tede.2010.31
Duda, J., & Szydło, S. (2011). Collective intelligence of genetic programming for macroeconomic fore-casting. In P. Jędrzejowicz, N.T. Nguyen, & K. Hoang (Eds.), Computational collective intelligence. Technologies and applications (pp. 445–454). Springer.
https://doi.org/10.1007/978-3-642-23938-0_45
Eliiyi, D. T., Korkmaz, A. G., & Çiçek, A. E. (2009). Operational variable job scheduling with eligibility constraints: A randomized constraint-graph-based approach. Technological and Economic
Develop-ment of Economy, 15(2), 245–266. https://doi.org/10.3846/1392-8619.2009.15.245-266
European Commission. (2019). Business and consumer surveys. https://ec.europa.eu/info/business-economy-euro/indicators-statistics/economic-databases/business-and-consumer-surveys_en
Eurostat. (2019). Database. http://ec.europa.eu/eurostat/web/lfs/data/database
Fernández, E., Rangel-Valdez, N., Cruz-Reyes, L., Gomez-Santillan, C., Rivera-Zarate, G., & Sanchez-Solis, P. (2019). Inferring parameters of a relational system of preferences from assignment ex-amples using an evolutionary algorithm. Technological and Economic Development of Economy,
25(4), 693–715. https://doi.org/10.3846/tede.2019.9475
Fortin, F. A., De Rainville, F. M., Gardner, M. A., Parizeau, M., & Gagné, C. (2012). DEAP: Evolutionary algorithms made easy. Journal of Machine Learning Research, 13(1), 2171–2175. http://www.jmlr. org/papers/v13/fortin12a.html
Gelper, S., & Croux, C. (2010). On the construction of the European economic sentiment indicator. Oxford Bulletin of Economics and Statistics, 72(1), 47–62.
https://doi.org/10.1111/j.1468-0084.2009.00574.x
Girardi, A., Gayer, C., & Reuter, A. (2015). The role of survey data in nowcasting euro area GDP growth. Journal of Forecasting, 35(5), 400–418. https://doi.org/10.1002/for.2383
Harvey, D. I., Leybourne, S. J., & Newbold, P. (1997). Testing the equality of prediction mean squared errors. International Journal of Forecasting, 13(2), 281–291.
https://doi.org/10.1016/S0169-2070(96)00719-4
Hastie, T., Tibshirani, R., & Friedman, J. (2017). The elements of statistical learning: Data mining, infer-ence and prediction (2nd ed). Springer Series in Statistics. https://doi.org/10.1007/978-0-387-84858-7
Ibrahim, D. (2016). An overview of soft computing. Procedia Computer Science, 102, 34–38.
https://doi.org/10.1016/j.procs.2016.09.366
Jović, S., Danesh, A. S., Younesi, E., Aničić, O., Petković, D., & Shamshirband, S. (2016). Forecasting of underactuated robotic finger contact forces by support vector regression methodology. International Journal of Pattern Recognition and Artificial Intelligence, 30(7), 1–11.
https://doi.org/10.1142/S0218001416590199
Juhro, S. M., & Iyke, B. N. (2020). Consumer confidence and consumption in Indonesia. Economic
Katebi, J., Shoaei-parchin, M., Shariati, M., Trung, N. T., & Khorami, M. (2020). Developed comparative analysis of metaheuristic optimization algorithms for optimal active control of structures.
Engineer-ing with Computers, 36, 1539–1558. https://doi.org/10.1007/s00366-019-00780-7
Kotanchek, M. E., Vladislavleva, E. Y., & Smits, G. F. (2010). Symbolic regression via genetic program-ming as a discovery engine: Insights on outliers and prototypes. In R. Riolo, U. M., O’Reilly, & T. McConaghy (Eds.), Genetic and evolutionary computation: Vol. 8. Genetic programming theory and practice VII (pp. 55–72). Springer Science+Business Media, LLC.
https://doi.org/10.1007/978-1-4419-1626-6_4
Koza, J. R. (1992). Genetic programming: On the programming of computers by means of natural selection. MIT Press. https://mitpress.mit.edu/books/genetic-programming
Kronberger, G., Fink, S., Kommenda, M., & Affenzeller, M. (2011). Macro-economic time series mod-eling and interaction networks. In C. Di Chio et al. (Eds.), Lecture notes in computer science: Vol. 6625. Applications of evolutionary computation (pp. 101–110). Springer.
https://doi.org/10.1007/978-3-642-20520-0_11
Kwiatkowski, J. W. (1992). Algorithms for index tracking. IMA Journal of Management Mathematics,
4(3), 279–299. https://doi.org/10.1093/imaman/4.3.279
Lacová, Ž., & Král, P. (2015). Measurement and characteristics of enterprise inflation expectations in Slovakia. Procedia Economics and Finance, 30, 505–512.
https://doi.org/10.1016/S2212-5671(15)01262-9
Larkin, F., & Ryan, C. (2008). Good news: Using news feeds with genetic programming to predict stock prices. In M. O’Neil et al. (Eds.), Lecture notes in computer science. Vol. 4971. Genetic programming (pp. 49–60). Springer-Verlag. https://doi.org/10.1007/978-3-540-78671-9_5
Macias-Escobar, T., Cruz-Reyes, L., Dorronsoro, B., Fraire-Huacuja, H., Rangel-Valdez, N., & Gomez-Santillan, C. (2019). Application of population evolvability in a hyper-heuristic for dynamic multi-objective optimization. Technological and Economic Development of Economy, 25(5), 951–978.
https://doi.org/10.3846/tede.2019.10291
Marković, D., Petković, D., Nikolić, V., Milovančević, M., & Petković, B. (2017). Soft computing predic-tion of economic growth based in science and technology factors. Physica A, 465, 217–220.
https://doi.org/10.1016/j.physa.2016.08.034
Nikolić, V., Mitić, V. V., Kocić, L., & Petković, D. (2017). Wind speed parameters sensitivity analysis based on fractals and neuro-fuzzy selection technique. Knowledge and Information Systems, 52, 255–265. https://doi.org/10.1007/s10115-016-1006-0
Pan, X., Uddin, M. K., Ai, B., Pan, X., & Saima, U. (2019). Influential factors of carbon emissions in-tensity in OECD countries: Evidence from symbolic regression. Journal of Cleaner Production, 220, 1194–1201. https://doi.org/10.1016/j.jclepro.2019.02.195
Petković, D., Jovic, S., Anicic, O., Nedic, B., & Pejovic, B. (2016). Analyzing of flexible gripper by com-putational intelligence approach. Mechatronics, 40, 1–16.
https://doi.org/10.1016/j.mechatronics.2016.09.001
Petković, D., Nikolić, V., Mitić, V. V., & Kocić, L. (2017). Estimation of fractal representation of wind speed fluctuation by artificial neural network with different training algorithms. Flow Measurement
and Instrumentation, 54, 172–176. https://doi.org/10.1016/j.flowmeasinst.2017.01.007
Safa, M., Sari, P. A., Shariati, M., Suhatril, M., Trung, N. T., Wakil, K., & Khorami, M. (2020). Develop-ment of neuro-fuzzy and neuro-bee predictive models for prediction of the safety factor of eco-protection slopes. Physica A: Statistical Mechanics and its Applications, 550, 124046.
https://doi.org/10.1016/j.physa.2019.124046
Shamshirband, S., Petković, D., Amini, A., Anuar, N. B., Nikolić, V., Ćojbašić, Ž., Mat Kiah, M. L., & Gani, A. (2014). Support vector regression methodology for wind turbine reaction torque predic-tion with power-split hydrostatic continuous variable transmission. Energy, 67, 623–630.
Shariati, M., Mafipour, M. S., Mehrabi, P., Wakil, K., Trung, N. T., & Toghroli, A. (2020). Prediction of concrete strength in presence of furnace slag and fly ash using hybrid ANN-GA (artificial neural network-genetic algorithm). Smart Structures and Systems, 25(2), 183–195.
https://doi.org/10.12989/sss.2020.25.2.183
Sorić, P., Lolić, I., Claveria, O., Monte, E., & Torra, S. (2019). Unemployment expectations: A socio-demographic analysis of the effect of news. Labour Economics, 60, 64–74.
https://doi.org/10.1016/j.labeco.2019.06.002
Toghroli, A., Mohammadhassani, M., Shariati, M., Suhatril, M., Ibrahim, Z., & Sulong, N. H. R. (2014). Prediction of shear capacity of channel shear connectors using the ANFIS model. Steel and Com-posite Structures, 17(5), 623–639. https://doi.org/10.12989/scs.2014.17.5.623
Vasilakis, G. A., Theofilatos, K. A., Georgopoulos, E. F., Karathanasopoulos, A., & Likothanassis, S. D. (2013). A genetic programming approach for EUR/USD exchange rate forecasting and trading.