Università degli Studi di Messina
Dipartimento di Scienze Chimiche, Biologiche, Farmaceutiche ed Ambientali Dottorato di Ricerca in ―Scienze Chimiche‖
Doctor of Philosophy in ―Chemical Sciences‖
ADVANCED CHROMATOGRAPHY AND
MASS SPECTROMETRY TECHNIQUES
FOR THE ANALYSIS OF BIOACTIVE CONSTITUENTS IN
FOOD AND CLINICAL FIELDS
Ph.D. Thesis of: Marianna Oteri Supervisor: Prof. Paola Donato
Coordinator:
Prof. Sebastiano Campagna
SSD CHIM/10 XXXI Ciclo 2015-2018
CHAPTER I General Introduction ... 1 1.1. Introduction ... 1 1.2. General trends ... 3 REFERENCES ... 4 CHAPTER II Liquid Chromatography coupled to Mass Spectrometry and Statistical Analyisis ... 7
2.1. Reuse of dairy product: evaluation of the lipid profile evolution during and after their shelf-life ... 7
2.1.1. Introduction ... 7
2.1.2. Materials and Method... ... 9
2.1.2.1. Chemicals and Materials. ... 9
2.1.2.2. Samples ... 9
2.1.2.3. Sample Preparation ... 10
2.1.2.4. Analytical Determination ... 10
2.1.2.5. Statistical Analysis ... 13
2.1.3. Results and Discussion... ... 13
2.1.4. FAMEs Analysis Optimization... ... 14
2.1.5. TAGs Analysis... ... 18
2.1.6. FAMEs and TAGs Profile Evolution... ... 23
2.1.7. Conclusions... ... 27
2.2. Chemical characterisation of old cabbage (Brassica oleracea L. var.
acephala) seed oil by liquid chromatography and different spectroscopic
detection systems ... 32
2.2.1. Introduction ... 32
2.2.2. Materials and methods... ... 33
2.2.2.1. Chemicals and reagents. ... 33
2.2.2.2. Seed material ... 34
2.2.3. Results and Discussion... ... 35
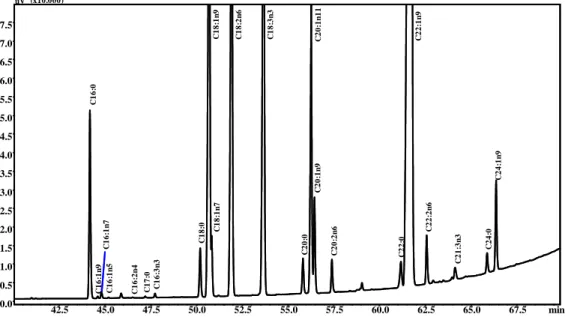
2.2.3.1. FAMEs composition by GC-FID and GC-MS. ... 35
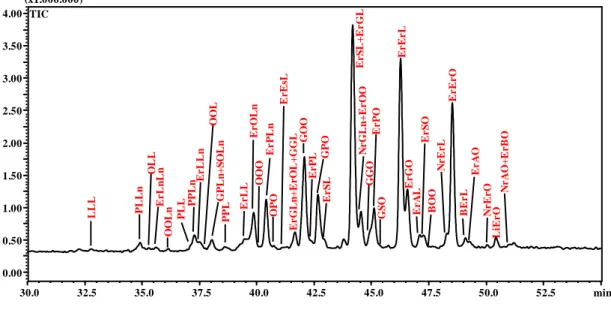
2.2.3.2. Triacylglycerol analysis by NARP-HPLC-APCI-MS. ... 37
2.2.3.3. Tocopherol analysis by NP-HPLC-RF.. ... 38
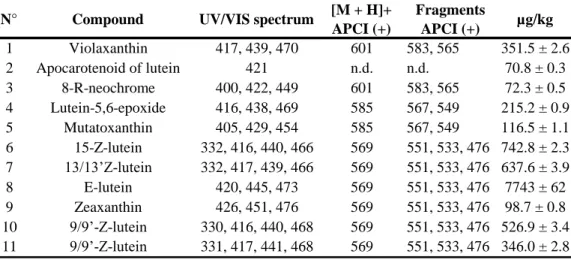
2.2.3.4. Carotenoid analysis by RP-HPLC-PDA/APCI-MS and UV–vis Spectrophotometry.. ... 40
2.2.3.5. Polyphenol analysis by RP-HPLC-PDA/ESI-MS.. ... 41
2.2.4. Conclusions... 43
REFERENCES ... 43
2.3. Analysis of lipid profile in lipid storage myopathy ... 47
2.3.1. Introduction ... 47
2.3.2. Materials and methods... ... 49
2.3.2.1. Patient selection. ... 49
2.3.2.2. FAMEs characterization ... 51
2.3.2.3. TGs characterization... ... 53
2.3.3. Results and discussion... ... 54
2.3.3.1. FAMEs profile ... 55
2.3.3.2. IMTGs profile ... 57
2.3.3.3. Statistical analysis.. ... 64
REFERENCES ... 66
2.4. Determination of amines and phenolic acids in wine with benzoylchloride derivatization and liquid chromatography–mass spectrometry ... 71
2.4.1. Introduction ... 71
2.4.2. Experimental ... ... 75
2.4.2.1. Chemicals and reagents. ... 75
2.4.2.2. Sample preparation and derivatization ... 75
2.4.2.3. Metabolite analysis by LC–MS/MS ... 76
2.4.2.4. Method evaluation... 76
2.4.2.5. Statistical analysis... 77
2.4.3. Results and Discussion... ... 77
2.4.3.1. Metabolite selection... ... 77
2.4.3.2. Figures of merit... ... 78
2.4.3.3. Wine analysis... ... 82
2.4.3.4. Comparison to current methods... ... 88
2.4.4. Conclusions... ... 89
REFERENCES ... 90
CHAPTER III Building of a Linear Retention Index System in Liquid Chromatography ... 97
3.1. Proposal of a linear retention index system for improving identification reliability of triacylglycerol profiles in lipid samples by liquid chromatography methods ... 97
3.1.1. Introduction ... 97
3.1.2. Experimental ... 101
3.1.2.2. Samples and sample preparation ... 101
3.1.2.3. UHPLC-ELSD instrumentation and analytical conditions ... 102
3.1.2.4. HPLC-ESI-MS instrumentation and analytical conditions... 103
3.1.2.5. LRI calculation and data analysis ... 104
3.1.3. Results and Discussion ... 104
3.1.3.1. Chromatographic method development ... 105
3.1.3.2. LRI database ... 108 3.1.3.3. LRI repeatability ... 113 3.1.3.4. HPLC-ESI-MS analyses ... 115 3.1.4. Conclusions ... 118 REFERENCES ... 119 CHAPTER IV Multidimensional Liquid Chromatography ... 123
4.1. Comprehensive lipid profiling in the Mediterranean mussel (Mytilus galloprovincialis) using hyphenated and multidimensional chromatography techniques coupled to mass spectrometry detection ... 123
4.1.1. Introduction ... 123
4.1.2. Materials and Methods ... 126
4.1.2.1. Solvents and Chemicals ... 126
4.1.2.2. Samples and sample preparation ... 127
4.1.2.3. Instrumentation and software ... 129
4.1.2.4. Analytical conditions ... 130
4.1.3. Results and Discussion ... 133
4.1.3.1. Online HILIC×RP-MS... 133
4.1.3.2. MS and MS/MS analyses... 141
4.1.3.3. Offline HILIC-RP-LC ... 162
4.1.4. Conclusions ... 164
REFERENCES ... 165
CHAPTER V Carbon-dioxide based techniques for the analysis of lipids and lipid-like compounds ... 171
5.1. Supercritical fluid chromatography×ultrahigh pressure liquid chromatography for red chilli pepper fingerprinting by photodiode array, quadrupole-time-of-flight and ion mobility mass spectrometry (SFC×RP-UHPLC-PDA-QToF MS-IMS) ... 171
5.1.1. Introduction ... 171
5.1.2. Materials and methods ... 175
5.1.2.1. Chemicals ... 175
5.1.2.2. Sample and sample preparation ... 175
5.1.2.3. SFC×RP-UHPLC-QToF MS-IMS instrument ... 175
5.1.2.4. Columns ... 176
5.1.2.5. SFC×RP-UHPLC-PDA-QToF MS-IMS analyses ... 176
5.1.3. Results and Discussion ... 178
5.1.4. Conclusions ... 193
REFERENCES ... 194
5.2. Triacylglycerol Fingerprinting in Edible Oils by Subcritical Solvent Chromatography ... 199
5.2.1. Introduction ... 199
5.2.2. Materials and Method ... 205
5.2.2.1. Chemicals and materials ... 205
5.2.2.2. Samples and sample preparation ... 206
5.2.2.4. Analytical conditions ... 206
5.2.3. Results and Discussion ... 207
5.2.3.1. Optimization of chromatographic conditions ... 207
5.2.3.2. Chromatographic separation and identification of triacylglycerols .... 209
5.2.3.3. IMS separation of triacylglycerols ... 216
5.2.4. Conclusions... 217
REFERENCES ... 218
CHAPTER VI Application of matrix assisted laser desorption/ionization time-of-flight mass spectrometry in lipid research ... 223
6.1. Structural analysis of triacylglycerols in vegetable oil by using high-resolution MALDI-ToF/ToF mass spectrometry ... 223
6.1.1. Introduction ... 223
6.1.2. Experimental ... 227
6.1.2.1. Samples and sample preparation ... 227
6.1.2.2. MALDI-ToF MS analyses ... 228
6.1.3. Results and Discussion ... 229
REFERENCES ... 245
APPENDIX I Supplementary materials ... 247
Chapter II ... 247
2.1. Reuse of dairy product: evaluation of the lipid profile evolution during and after their shelf-life ... 247
2.2. Chemical characterisation of old cabbage (Brassica oleracea L. var. acephala) seed oil by liquid chromatography and different spectroscopic detection systems ... 263
2.3. Analysis of lipid profile in lipid storage myopathy ... 271 2.4. Determination of amines and phenolic acids in wine with benzoylchloride
derivatization and liquid chromatography–massspectrometry ... 275
Chapter III ... 284 3.1. Proposal of a linear retention index system for improving identification
reliability of triacylglycerol profiles in lipid samples by liquid chromatography methods ... 284
Chapter IV ... 296 4.1. Comprehensive lipid profiling in the Mediterranean mussel (Mytilus
galloprovincialis) using hyphenated and multidimensional chromatography techniques coupled to mass spectrometry detection ... 296
APPENDIX II
List of publications ... 305
All figures and tables of the published papers have been reproduced with the permission of Springer Nature, Taylor & Francis, Elsevier and
General Introduction
1.1. Introduction
The complete set of lipids in an organism or a cell along with its interactions with other molecules, such as other lipids, proteins, and metabolites constitutes the lipidome. Lipidomics is the comprehensive and quantitative study of the lipidome. It involves identification and quantitation of thousands of biological pathways involving lipids and their interactions.
Lipids are the essential metabolites in human body; their main biological functions are the energy storage, endocrine actions, morphogenesis, building blocks of cellular and subcellular membranes and signaling molecules [1]. The dysregulation of lipids is related to various serious human diseases, such as cancer, Alzheimer, cardiovascular diseases, and lysosomal disorders [2].
Using lipidomics approaches, it has become easier to study the lipids species in an organism.
Lipidomics is an emerging field in the name of the ‗omics‘ for system-level analysis of lipids and their interacting partners within a cell. Lipidomics aims to define and quantitate all of the molecular lipid species present in a cell [3]. The lipid molecular species can be described by the eight known categories of lipids, numerous classes, and subclasses, such us fatty acids, glycerolipids, sphingolipids, prenols, sterols, glycerophospholipids, poliketides and saccharolipides.
Current studies related to lipid identification and determination, or lipidomics in biological samples, are one of the most important issues in modern bioanalytical chemistry. There are many articles dedicated to specific analytical strategies and to the actual analytical methodologies used in lipidomics in various kinds of biological samples. The most important methods used to
characterize the lipidomics in modern bioanalysis are:
chromatography/separation methods (thin layer chromatography (TLC), (ultra)
high-pressure liquid chromatography ((U)HPLC), gas chromatography (GC), (ultra-performance) supercritical fluid chromatography ((UHP)SFC), and capillary electrophoresis (CE)); spectroscopic methods (Raman spectroscopy (RS), Fourier transform infrared spectroscopy (FT-IR) and nuclear magnetic resonance (NMR)); mass spectrometry and also hyphenated methods
(matrix-assisted laser desorption/ionization (MALDI), hyphenated methods, which
include liquid chromatography–mass spectrometry (LC-MS), gas chromatography–mass spectrometry (GC-MS) and also multidimensional techniques). These are being used to identify and quantify all the lipid species in order to understand their function in biological systems [4].
MS technology has been proved to be highly efficient in the characterization and quantification of lipid molecular species in lipid extracts. One of the reasons behind this could be the ability of MS to characterize and separate each ionized particle according to their mass-to-charge (m/z) ratio. MS can also provide structural information by fragmenting the lipid ions which can be achieved by using tandem MS, or MS/MS.
Basically, there are two different approaches for lipidomics analysis:
- to apply some extraction protocols optimized for each lipid category, and then subject to LC to separate the present lipids molecular species optimally [5-10], then the LC eluate is coupled directly to the mass spectrometer for further analysis such as molecular fragmentation (MS/MS), ion scanning, etc.
- another approach, also known as ―shotgun lipidomics‖, involves the offline extraction of lipids followed by MS analysis without LC separation [11].
Several tools are available for lipidomics and some are emerging concerning the combination of genomics and lipidomics to identify clinically relevant biomarkers. For example, SimLipid is a high-throughput characterization tool
for lipids [12]. It analyzes lipid mass spectrometric data to profile them using LC coupled with MALDI-MS, MS/MS data, and also remove the overlapping isotopic peaks from multiple spectra in batch mode [13].
"Lipidomics" applies to studying lipid metabolism on a broad scale and it may elucidate the biochemical mechanism(s) underlying specific changes in lipid metabolism.
Advances in mass spectrometry have greatly accelerated the lipidomics field. Chemical derivatization has shown its broad use in improving analytical sensitivity and specificity in lipidomics.
Lipidomics aims to quantitatively define lipid classes, including their molecular species, in biological systems and it has experienced rapid progress, mainly because of continuous technical advances in instrumentation that are now enabling quantitative lipid analyses with an unprecedented level of sensitivity and precision. The still-growing category of lipids includes a broad diversity of chemical structures with a wide range of physicochemical properties. Reflecting this diversity, different methods and strategies are being applied to the quantification of lipids.
1.2. General trends
Since its advent, LC is being exploited by separation scientists and applied to a wider and wider range of sample matrices for the separation, identification and quantification of ever more compounds, particularly in lipidomic analysis. The unceasing progresses in column and stationary phases production, and the enormous developments in detection techniques have contributed to the outstanding success of chromatography, as an invaluable tool in analytical chemistry in many different fields including nutraceutical, food, environmental, clinical, forensic, and pharmaceutical applications. The great advantages to be gained by the use of LC are especially increased with the hyphenation to MS
(LC-MS). Recent trends in the area of LC-MS and related techniques involve: (a) the shift from conventional HPLC-MS to ultra high pressure liquid chromatography (UHPLC)-MS or other fast LC-MS techniques (core-shell particles, high-temperature LC and monolithic columns) requiring fast MS analyzers (typically time-of-flight (TOF)-based systems); (b) the use of supercritical fluid chromatography (SFC) for fast and ―green‖ separations, with reduction in solvents consumption; (c) the use of multidimensional liquid chromatography techniques (MDLC) for complex samples, and other dimension also in MS, such as ion mobility spectrometry (IMS)-MS, the coupling of two or more mass analyzer (tandem MS); (d) the shift from low-resolution to (ultra)high-low-resolution MS to allow accurate mass measurements. Each of these techniques will be described in detail in the following chapters, illustrating selected applications developed for the analysis of lipid and lipid-like molecules, as well as other bioactive compounds.
REFERENCES
[1] van Meer, G.; de Kroon, A. I. J. Cell Sci. 2011, 124, 5−8. [2] Yang, K.; Han, X. Trends Biochem. Sci. 2016, 41, 954−969.
[3] Dennis, E. A. Lipidomics joins the omics evolution. Proceedings of the National Academy of Sciences, 2009, 106, 2089-2090.
[4] Holcapek M., Liebisch G., Ekroos K. Lipidomic Analysis. Anal. Chem. 2018, 90, 4249−4257.
[5] Krank, J., Murphy, R. C., Barkley, R. M., Duchoslav, E., & McAnoy, A. Qualitative analysis and quantitative assessment of changes in neutral glycerol lipid molecular species within cells. Methods in enzymology, 2007, 432, 1-20. [6] Ivanova, P. T., Milne, S. B., Byrne, M. O., Xiang, Y., & Brown, H. A. Glycerophospholipid identification and quantitation by electrospray ionization mass spectrometry. Methods in enzymology, 2007, 432, 21-57.
[7] Deems, R., Buczynski, M. W., Bowers-Gentry, R., Harkewicz, R., & Dennis, E. A. Detection and quantitation of eicosanoids via high performance liquid chromatography-electrospray ionization-mass spectrometry. Methods in enzymology, 2007, 432, 59-82.
[8] Sullards, M. C., Allegood, J. C., Kelly, S., Wang, E., Haynes, C. A., Park, H., … & Merrill, A. H. Structure-Specific, Quantitative Methods for Analysis of Sphingolipids by Liquid Chromatography–Tandem Mass Spectrometry:―Inside-Out‖ Sphingolipidomics. Methods in enzymology, 2007, 432, 83-115.
[9] Garrett, T. A., Guan, Z., & Raetz, C. R. Analysis of Ubiquinones, Dolichols, and Dolichol Diphosphate-Oligosaccharides by Liquid Chromatography-Electrospray Ionization-Mass Spectrometry. Methods in enzymology, 2007, 432, 117-143.
[10] McDonald, J. G., Thompson, B. M., McCrum, E. C., & Russell, D. W. Extraction and analysis of sterols in biological matrices by high performance liquid chromatography electrospray ionization mass spectrometry. Methods in enzymology, 2007, 432, 145-170.
[11] Ejsing, C. S., Sampaio, J. L., Surendranath, V., Duchoslav, E., Ekroos, K., Klemm, R. W., … & Shevchenko, A. Global analysis of the yeast lipidome by quantitative shotgun mass spectrometry. Proceedings of the National Academy of Sciences, 2009, 106, 2136-2141.
[12] Wenk, M. R. Lipidomics: new tools and applications. Cell, 2010, 143, 888-895.
[13] Isaac, G., McDonald, S., & Astarita, G. (2011). Automated Lipid Identification Using UPLC/HDMSE in Combination with SimLipid. Waters Application Note 720004169en.
Liquid Chromatography coupled to Mass Spectrometry
and Statistical Analysis
2.1. Reuse of dairy product: evaluation of the lipid profile
evolution during and after their shelf-life
2.1.1. Introduction
Food waste has long been known as one of the main issue to be faced to combat hunger, reduce the environmental impact, and increase income. Food losses or waste are generally used alternatively, but a slight difference can be addressed between the two terms. ―Food losses‖ refer to the decrease in edible food mass occurring during the food supply chain steps (e.g., production, harvesting, post-harvesting, handling, processing, distribution, and consumption), while ―Food waste‖ generally refers to the final steps of the food chain, related to suppliers and consumers [1-3]. Nevertheless, a third term, ―food by-product‖ is taking place to consider the potentiality of some food losses to be reused inside the food or feed chain. An exact estimation of food loss in the world is not possible due to a lack of data related to a rather complex worldwide scenario. In 2011, the Food and Agriculture Organization (FAO) published a report with the attempt of a rough estimation of this phenomenon. It concluded that about one-third of the edible parts of food produced for human consumption gets lost or wasted (which means about 1.3 billion ton per year). It was also pinpointed that in the industrialized countries (i.e., Europe, North America, and industrialized Asia) more than 40 % of food losses occur at retailers and consumers level [1]. Among the seven commodity groups considered, the most wasted ones, at least in Europe, were roots and tubers crops (>50 %) followed by fruits and vegetables (>40 %), cereals and fish, and seafoods (>30 %), while less spoilage
occurs for oilseed and meat (about 20 %) and milk and dairy products (about 10 %). In the latter commodity most of the loss (40–65 %) occurs, for all the industrialized countries, at the consumption level. Considering such concerning numbers many efforts have been carried out in the last decade to transform ―food wastes‖ into ―by-products‖. Special attention has been paid to the possibility to recover and reuse bioactive compounds (e.g., phenols, carotenoids, phytosterols) to be added as additives (e.g., to extend shelf-life) or as an ingredient in functional foods. Concerning dairy products, lactose and proteins have been the main compounds recovered from food by-products [4,5], while little attention has been paid to the functional components, especially in the lipidic fraction, present in such nutrient food commodities. The milk fat fraction has been demonized for years due to the presence of a relatively high amount of cholesterol and saturated fatty acids, portrayed as the major risk factor for heart disease. More recently, such a fraction has been rehabilitated since many studies have proven the positive health effects of trans fatty acids of animal origin, mainly conjugated linoleic acid (CLA). The latter is a group of naturally occurring fatty acids synthesized from linoleic acid by bacteria present in alimentary tract of ruminant animals or as a result of endogenous conversion of trans-vaccenic acid by Δ9-desaturase in tissues, especially the mammary glands [6-9].
The aim of the present work is to evaluate the change occurring in the profile of the lipidic fraction of different dairy products during and after their natural shelf-life, to evaluate if worthy considering their reuse in the animal feed chain [10]. Both the total fatty acid profile, as methyl derivatives (FAMEs), and triacylglycerols (TAGs) have been considered. A preliminary work has been made to optimize faster analytical methods. Furthermore, three kinds of soft cheese were chosen as representative of perishable dairy products to investigate the effect of different formulation on the lipid profile.
2.1.2. Materials and Method
2.1.2.1. Chemicals and Materials
Ethanol, diethyl ether, sodium sulfate, acetone, sodium methoxylate, hydrochloric acid, and ammonium hydroxide solution were supplied by Sigma-Aldrich (Milan, Italy). Hexane, n-pentane, and acetonitrile (ACN) were purchased from PanReac AppliChem (Barcelona, Spain). Isopropyl alcohol (IPA) LC-grade was from Fluka (Buchs, Switzerland). Boron trifluoride in methanol was purchased from Merck (Milan, Italy).
2.1.2.2. Samples
Three different types of a typical Italian soft cheese (stracchino) of the same brand but with different formulation, namely a stracchino classic (SC), a stracchino added with yogurt (SY) and a stracchino added with probiotic (SP), were freshly collected in a local retailer. Seven food packs for each type, belonging to the same production batch, were purchased to follow the evolution of the lipidic profile every 7 days for 7 times. The sampling design is summarized in Table 1(II-2.1.).
Table 1(II-2.1.). Sampling plan.
SAMPLES Frequency of
extraction
Number of
extraction Extraction method Commercial denomination Code
Soft cheese
Stracchino classic SC every 7 days 7 SBR-mini
Stracchino with yogurt SY every 7 days 7 SBR-mini
2.1.2.3. Sample Preparation
Extraction
All the samples were extracted using a miniaturized Schmid–Bondzynski– Ratzlaff (SBR) procedure [11]. Previously, the miniaturized method (called SBR-mini) was compared with the original one (SBR) by analyzing a sample of SC three times.
SBR. Briefly, about 10 g of the sample accurately weighed and dissolved in 20 mL of hydrochloric acid and 20 mL of ethyl alcohol. The preparation was done in a volumetric flask inserted in a boiling-water bath and kept gently moved (for 30 min at 50 °C) with constant magnetic stirring until complete dissolution. Then, the flask was cooled down in running water and a mixture of 200 mL of n-hexane and ethyl ether (1:2, v/v) was added and the mixture was shaken for additional 15 min. The suspension was left to stand for 10 min to allow phase separation. The extraction protocol was repeated three times. The organic extracts were pooled, dried over anhydrous sodium sulfate, filtered, and then brought to dryness under vacuum; the final dry residue was stored at −18 °C until use.
SBR-mini. The aforementioned method was miniaturized as follow: about 1 g of the sample was dissolved in 2 mL of hydrochloric acid and 2 mL of ethyl alcohol. Then lipids were extracted with 20 mL mixture of n-hexane and ethyl ether (1:2, v/v) following the same procedure described for the original method.
2.1.2.4. Analytical Determination
After extraction, all the samples were divided to be analyzed by high performance liquid chromatography (HPLC) coupled to mass spectrometry (MS), for TAGs analysis; and by gas chromatography (GC)–MS and GC–flame ionization detector (FID) for FAMEs profile determination.
About 75 mg of each sample extract were diluted in 5 mL of acetone and then filtered through a 0.45 μm Acrodisc nylon membrane filter (Pall Life Sciences, Ann Arbor, MI, USA) prior to LC–MS analyses.
Non-aqueous reversed-phase (NARP)-HPLC with atmospheric pressure chemical ionization (APCI)-MS analyses were performed on a Shimadzu Prominence LC-20A System (Shimadzu, Milan, Italy), consisting of a CBM-20A controller, two LC-20 AD dual-plunger parallel-flow pumps, and a DGU-20A5 degasser. The LC system was coupled to an LCMS-2010 mass spectrometer through an APCI source operated in the positive ionization mode. Chromatographic separation was achieved on Ascentis Express Fused-core C18 columns, 150 mm× 4.6 mm ID, 2.7 μm d.p., kindly provided by Supelco/Sigma-Aldrich (Bellefonte, PA, USA). Mobile phases consisted of (A) ACN, and (B) IPA, under the following gradient: 0 min, 0 % B; 50 min, 70 % B (hold for 4 min); 54 min, 0 % B. The mobile phase flow rate was 1 mL/min. Injection volume: 15 μL. MS parameters were as follows: m/z range: 250–1100; scan speed: 4000 amu/s; nebulizing gas (N2) flow rate: 2.5 L/min; event time:
0.2 s; detector voltage: 1.6 kV; interface voltage: 4.5 kV; interface temperature: 470 °C; CDL temperature: 300 °C; heat block temperature: 300 °C. The LCMSsolution software (version 3.50 SP2 Shimadzu, Milan, Italy) was used for data collection and handling.
GC–FID and GC–MS Analysis
Fatty acid methyl esters were obtained according to a previously applied procedure in milk samples [12]. Conventional GC–MS analyses of FAME samples were carried out on a GCMS-QP2010 (Shimadzu, Milan, Italy) equipped with a split/splitless injector, an AOC-20i autosampler, and a quadrupole MS detector.
carrier gas at constant linear velocity, 30 cm/s. A 30 m× 0.25-mm ID, 0.25 μm
df Supelcowax-10 column (Sigma-Aldrich/Supelco, Bellefonte, USA) was used
for the separation; injection volume and mode: 0.5 μL, split ratio: 1:250. MS parameters were as follows: mass range 40–400 amu; acquisition frequency 5 Hz. Ion source temperature, 200 °C and interface temperature, 250 °C.
Fast GC–MS analyses were carried out using a Supelcowax-10 column, 10 m× 0.10 mm ID × 0.10 μm df.
Oven temperature program: 50–280 °C (hold 2 min) at 40 and 80 °C/min. Helium was used as carrier gas at constant linear velocity, 70 cm/s. Injection volume and mode: 0.5 μL, split ratio: 1:250. MS parameters were as follows: mass range 40–400 amu; acquisition frequency 10 Hz. Ion source temperature, 200 °C and interface temperature, 250 °C.
The GCMSsolution software (version 2.71 Shimadzu, Milan, Italy) was used for data collection and handling. Identification was carried out through library search into the FAMEs: Mass Spectral Database (Wiley), with the simultaneous use of linear retention indices (LRIs) [13].
Conventional GC–FID analyses were performed on a Shimadzu GC-2010 instrument equipped with a split/splitless injector and a Shimadzu autosampler AOC-20is (Shimadzu, Milan, Italy). Data acquisition was performed using Shimadzu‘s GCSolution Software. Column: Supelcowax-10, 30 m× 0.25 mm ID× 0.25 μm df. Inlet pressure: 100 KPa.
Carrier gas: He, u: 30.1 cm/s. Injection volume: 1.0 μL. Split ratio: 1:100. Detector: FID; Temperature: 280 °C. H2: 40.0 mL/ min, air flow: 400.0 mL/min. Temperature program: 50–280 °C (hold for 5 min) at 3 °C/min, with a total run time of about 80 min.
Fast GC–FID analyses were performed on the same Shimadzu instrument. Column: Supelcowax-10, 10 m× 0.10 mm ID× 0.10 μm df. Carrier gas: H2,
Split ratio: 1:50. Detector: FID H2: 50.0 mL/min, air: 400.0 mL/min. Oven temperature program: 50–280 °C (hold for 2 min) at 40 and 80 °C/min. The chromatographic runs lasted about 8 and 5 min, respectively.
Individual fatty acid methyl esters (FAMEs) are reported as the percentage of total FAMEs. Area correction was performed to correct the FID response for the short-chain fatty acids by means of theoretical relative response factors (TRF) [14]. Reliability of TRF was previously checked by means of standard mixtures analysis.
2.1.2.5. Statistical Analysis
A principal component analysis (PCA) was performed as an unsupervised method to ascertain the degree of differentiation between samples considering the FAMEs and TAGs identified as variables. PCA and three-way PCA were performed by using an R-based chemometric software (http://gruppochemiometria.it 2014).
PCA is a well-exploited technique to extract and visualize significant information from a data set. An orthogonal rotation is performed to transform the v-dimensional space of the v original variables into a c-dimensional space (with c< v) of uncorrelated variables (new axes). The coefficients of the original variables defining each Principal Component are called ―loadings‖ and the projections of the objects on the new axes are called ―scores‖. The three-way PCA takes in account the three-dimensional structure of the data set and simplify the interpretation of possible correlations.
2.1.3. Results and Discussion
The aim of the present investigation was the optimization of rapid and reliable analytical methods for dairy products characterization and the investigation of the variation of the FAMEs and TAGs profile during storage of fresh-cheese
products and after their best-by-date. This is the preliminary part of a project that has, as the final objective, the characterization of the lipidic profile of best-by-date dairy products to evaluate their nutritional value for possible reintroduction in the food or feed chain after their isolation.
Considering the relatively large number of samples that has been analyzed in the entire project, the first step of the research work was to speed up the entire analytical procedure, along with the reduction of the solvent volumes involved in the extraction step. Furthermore, a limited number of samples were chosen to investigate how the lipid profile changes over time. Three kinds of cheese (all with a fat content of 26.5% reported on the label) were selected, namely
a SC, SY, and SP.
The extraction method was simply scaled-down by ten-fold, starting from the classical SBR method. The extraction yields of the conventional and reduced SBR method were compared. The same sample was extracted three times and the two average yields were compared using a t test. No significant difference (p>0.05) was observed, with a lipid extraction yield of about 25 %.
The fresh sample of SC was extracted three times and each extraction was evaluated both in term of FAMEs and TAGs profile by injecting three times the same extract to evaluate the overall variability of the methods. The quantitative variability (expressed as CV%) for the three injections, was in average of
about 4 % for all FAMEs (with maximum values of about 10 %) and of about 6.5%for all TAGs (with maximum values of about 15 %); while the overall variability (considering the three extractions and the three injections for each extraction, n =9) was about 10 % for both FAMEs and TAGs (with maximum values of about 20 %).
2.1.4. FAMEs Analysis Optimization
Different filtering criteria were used, namely mass spectrum similarity match above 80 %, linear retention indices (LRI) in a ±10 range compared with the indices reported in the FAMEs Library (calculated based on a FAMEs mixture). Comparison with data reported in the literature for similar samples was carried out for further confirmation [12].
The FAMEs samples obtained from the extraction of the three different stracchino samples (e.g., SC, SY, and SP) were injected into a GC–FID, using conventional conditions, and two fast conditions. The conventional run, performed using a 30m× 0.25mm ID column lasted about 80 min, while using a 10 m×0.1 mm ID column, at 40 and 80 °C/min, a total run time of about 8 and 5 min was obtained, respectively. The GC–FID analyses were performed in triplicate for quantitative comparison purposes. Figure 1 (II-2.1.) shows a comparison of the three chromatograms obtained in the conventional (Figure 1a (II-2.1.), 80 min), and fast (Figure 1b (II-2.1.) and Figure 1c (II-2.1.); 8 and 5 min, respectively) conditions for the SC sample (the others comparisons, SY and SP, are reported in Supplementary Figures 1S (II-2.1.) and 2S (II-2.1.). In the boxes are reported expansions of the C18 part of each chromatogram. Such a drastic reduction in the GC run time cannot be attained without a cost, in terms of peak resolution, different degrees of partial coelution, as can be observed in the conventional and very fast chromatogram expansions, reported in Figure 1 (II-2.1.). Of the 62 identified peaks, only four compounds (three different C18:1 isomers and C18:2n6) in the 8 min run and seven (C17:1, three different C18:1 isomers, two different C18:2, and C20:1n9) in the 5 min run were coeluted.
Figure 1 (II-2.1.). GC–FID FAMEs profile of SC sample, obtained using different chromatographic conditions. a) conventional run (80 min); b) fast run (8 min); and c) faster run (5 min).
SC 5.0 10.0 15.0 20.0 25.0 30.0 35.0 40.0 45.0 50.0 55.0 60.0 65.0 0.00 0.25 0.50 0.75 1.00 1.25 1.50 1.75 2.00 2.25 (x10,000,000) C 4 :0 C 5 :0 C 6 :0 C 7 :0 C8 :0 C 9 :0 C 1 0 :0 C 1 1 :0 C 1 2 :0 C 1 2 :1 n 1 C 1 3 :0 C1 4 :0 is o C 1 4 :0 C 1 4 :1 n 5 C 1 5 :0 is o C 1 5 :0 a n te is o C 1 5 :0 C 1 6 :0 is o C 1 6 :0 C 1 6 :1 n 9 C 1 6 :1 n 7 C 1 7 :0 is o C 1 7 :0 a n te is o C 1 7 :0 C 1 7 :1 n 7 C 1 8 :0 is o C 1 8 :0 C 1 8 :1 n 9 C 1 8 :1 n 7 C 1 8 :3 n 3 C2 0 :0 C2 0 :1 n 1 1 C 2 0 :1 n 9 C 1 8 :2 n 6 C 1 0 :1 n 6 C 2 0 :3 n 6 C 2 0 :4 n 6 C 1 8 :2 n 7 (9 c ,1 1 t) C 1 9 :0 C 1 8 :1 n 3 C 2 0 :2 n 6 C 2 2 :0 C 2 0 :5 n 3 C 1 2 :1 n 1 C 1 5 :1 C 1 6 :1 n 5 C 1 6 :2 C L A C L A C 1 3 :0 is o (x1,000,000) 53.0 54.0 55.0 56.0 57.0 0.5 1.0 1.5 2.0 2.5 3.0 3.5 4.0 4.5 5.0 5.5 6.0 C 1 8 :0 C 1 8 :1 n 9 C 1 8 :1 n 7 C 1 8 :3 n 3 C 1 8 :2 n 6 C 1 8 :1 C 1 8 :1 n 3 C 1 9 :0 C 1 9 :1 C 1 8 :2 n 6 C 1 8 :2 n 6 C 1 8 :1 n 1 2 C 1 8 :1 n 3 C 1 8 :1 C 1 8 :2 C 1 8 :2 n 6 C18 :2 a) 1.0 1.5 2.0 2.5 3.0 3.5 4.0 4.5 5.0 0.0 0.5 1.0 1.5 2.0 2.5 3.0 3.5 4.0 4.5 5.0 5.5 (x1,000,000) C 4 :0 C 5 :0 C 6 :0 C 7 :0 C 8 :0 C 9 :0 C 1 0 :0 C 1 1 :0 C 1 2 :0 C 1 2 :1 n 1 C 1 3 :0 C 1 4 :0 iso C 1 4 :0 C 1 4 :1 n 5 C 1 5 :0 iso C 1 5 :0 a n te iso C 1 5 :0 C 1 6 :0 iso C 1 6 :0 C 1 6 :1 n 7 C 1 7 :0 iso C 1 7 :0 a n te iso C 1 7 :0 C 1 7 :1 n 7 C 1 8 :0 iso C 1 8 :0 C 1 8 :1 n 9 C 1 8 :1 n 7 C 1 8 :2 n 6 C 1 8 :3 n 3 C 2 0 :0 C 2 0 :1 n 1 1 C 2 0 :3 n 6 C 2 0 :4 n 6 C 2 2 :0 C 1 0 :n 6 C 1 2 :1 n 1 C 1 5 :1 C 1 8 :2 n 7 (c9 ,t 1 1 ) C 2 2 :5 n 3 C 2 0 :2 n 6 C 1 6 :1 n 5 4.4 4.5 4.6 4.7 4.8 0.1 0.2 0.3 0.4 0.5 0.6 0.7 0.8 0.9 1.0 1.1 (x1,000,000) C 1 8 :0 iso C 1 8 :0 C 1 8 :1 n 9 C 1 8 :1 n 7 C 1 8 :2 n 6 C 1 8 :3 n 3 C 1 8 :1 C 1 8 :1 n 3 C 1 8 :2 C 1 8 :2 n 6 C 1 8 :2 n 6 C 1 9 :0 C 1 9 :1 C 1 8 :2 b) C 1 3 :0 is o C 1 6 :1 n 9 C1 6 :2 C 1 8 :1 n 3 C 1 9 :0 C 2 0 :1 n 9 C L A C L A 0.75 1.00 1.25 1.50 1.75 2.00 2.25 2.50 2.75 3.00 0.0 0.5 1.0 1.5 2.0 2.5 3.0 3.5 4.0 4.5 5.0 5.5 (x1,000,000) C 4 :0 C6 :0 C 7 :0 C8:0 C 9 :0 C 1 0 :0 C 1 1 :0 C 1 2 :0 C 1 2 :1 n 1 C 1 3 :0 C 1 4 :0 is o C 1 4 :0 C 1 4 :1 n 5 C 1 5 :0 is o C 1 5 :0 a n te is o C 1 5 :0 C 1 6 :0 is o C 1 6 :0 C 1 6 :1 n 7 C 1 7 :0 is o C 1 7 :0 a n te is o C 1 7 :0 C 1 7 :1 n 7 C 1 8 :0 is o C 1 8 :0 C 1 8 :1 n 9 C 1 8 :1 n 7 C 1 8 :2 n 6 C 1 8 :3 n 3 C 2 0 :0 C 2 0 :3 n 6 C 2 0 :1 n 1 1 C 2 0 :4 n 6 C 1 0 :1 n 6 C 5 :0 C 1 6 :1 n 5 C 1 8 :2 n 7 (c 9 ,t 1 1 ) C 2 0 :2 n 6 C 2 2 :0 C 2 2 :5 n 3 C 1 2 :1 n 1 C 1 5 :1 (x1,000,000) C 1 8 :0 C 1 8 :1 n 9 0.1 0.2 0.3 0.4 0.5 0.6 0.7 0.8 0.9 1.0 1.1 2.55 2.60 2.65 2.70 2.75 C 1 8 :0 is o C 1 8 :2 n 6 C 1 8 :3 n 3 C 1 8 :1 n 7 C 1 8 :1 C 1 8 :1 n 3 C 1 8 :2 C 1 8 :2 n 6 C 1 8 :2 n 6 C 1 9 :0 C 1 9 :1 C 1 8 :2 c) C 1 3 :0 is o C 1 6 :2 C 1 6 :1 n 9 C 1 8 :1 n 3 C 1 9 :0
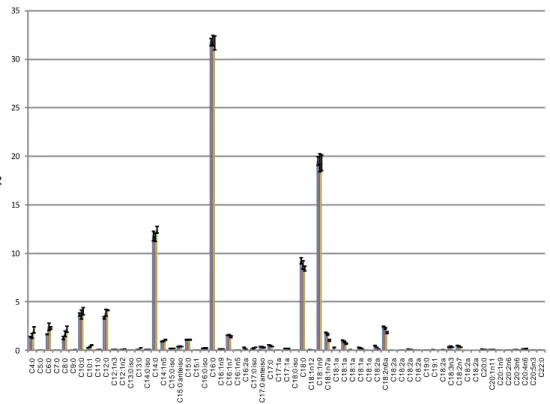
The quantitative comparison is graphically shown in Figure 2 (II-2.1.). for the SC sample (all the quantitative data of SC, SY, and SP are reported in Supplementary Table 1S (II-2.1.).
Figure 2 (II-2.1.). Quantitative comparison of FAMEs for the SC sample obtained applying the three different GC–FID conditions.
GC peak area repeatability (CV%) was determined for all the conditions tested, CV% values are reported in Supplementary Table 1S (II-2.1.) and are in average as follow: 4.6, 5.1, and 4.4 % for conventional conditions; 7.1, 8.6, and 5.6 % for fast conditions lasting about 8 min; and 6.4, 5.0, and 3.9 % for fast conditions lasting about 5 min, for SC, SP, and SY, respectively.
Considering the extremely high advantage in terms of throughput, a little resolution loss was considered more than acceptable; thus, the fast chromatographic conditions (8 min run time) were chosen for all the following
0 5 10 15 20 25 30 35 C 4 :0 C 5 :0 C 6 :0 C 7 :0 C 8 :0 C 9 :0 C 1 0 :0 C 1 0 :1 C 1 1 :0 C 1 2 :0 C 1 2 :1 n 3 C 1 2 :1 n 2 C 1 3 :0 iso C 1 3 :0 C 1 4 :0 iso C 1 4 :0 C 1 4 :1 n 5 C 1 5 :0 iso C 1 5 :0 a n te iso C 1 5 :0 C 1 5 :1 C 1 6 :0 iso C 1 6 :0 C 1 6 :1 n 9 C 1 6 :1 n 7 C 1 6 :1 n 5 C 1 6 :2 a C 1 7 :0 iso C 1 7 :0 a n te iso C 1 7 :0 C 1 7 :1 a C 1 7 :1 a C 1 8 :0 iso C 1 8 :0 C 1 8 :1 n 1 2 C 1 8 :1 n 9 C 1 8 :1 n 7 a C 1 8 :1 a C 1 8 :1 a C 1 8 :1 a C 1 8 :1 a C 1 8 :1 a C 1 8 :2 a C 1 8 :2 n 6 a C 1 8 :2 a C 1 8 :2 a C 1 8 :2 a C 1 8 :2 a C 1 9 :0 C 1 9 :1 C 1 8 :2 a C 1 8 :3 n 3 C 1 8 :2 n 7 C 1 8 :2 a C 1 8 :2 a C 2 0 :0 C 2 0 :1 n 1 1 C 2 0 :1 n 9 C 2 0 :2 n 6 C 2 0 :3 n 6 C 2 0 :4 n 6 C 2 0 :5 n 3 C 2 2 :0 %
analysis.
2.1.5. TAGs Analysis
TAGs profile of milk and dairy products is highly complex since TAGs are synthesized from a large number of fatty acids [15-17]. Consequently, the identification and quantification of individual TAGs have proved an extremely difficult and frustrating exercise with only a few species being identified. The retention of TAGs is governed by the partition number (PN), which is defined as PN=CN (carbon number)− 2 ×DB (double bond). The separation of most TAGs within one PN group is feasible under optimized chromatographic conditions [18,19] and the retention of TAGs within the same PN group increases with decreasing DB in the acyl chains. In the case of TAGs, still with the same PN but also with equal CNs and DB number, retention depends also on the combination of single FAs onto the glycerol backbone [19,20,21]. The separation of cis-/trans-isomers [22,23], DB positional isomers [24,25] or partially separated regioisomers [26] has also been reported in NARP-HPLC. The HPLC–APCI-MS method used in this work was previously used to elucidate the TAGs profile in milk and dairy samples [18]. TAGs were identified according to their HPLC–APCI-MS mass spectra considering m/z values of pseudo molecular [M+H]+ and ―diacylglycerol‖ fragment [M+H– RCOOH]+ ions. However, GC–FID/MS data were of fundamental support during the identification process of TAGs.
The APCI interface is considered the most suitable detector for TAGs analysis since it is characterized by a good linearity range and a relatively low difference in response factors among different TAGs compositions [19,27]. Furthermore, when a single quadrupole MS is employed, APCI has the added benefit of unambiguous structural identification due to a more extensive fragmentation compared to ESI. In fact, the MS spectra generated by ESI is characterized by a
sets of a protonated ions [M+X]+ (X=H; Na; NH4, etc.), but less or no fragmentation is formed. These [M+X]+ ions may correspond to a certain number of different TAGs protonated molecules, thus causing an overestimation of the real number of TAGs occurred in the investigated samples (false positives) [27]. Using APCI a more characteristic fragments are obtained, with a relative abundance (%) of the protonated [M+H]+ ions varying according to the degree of unsaturation (e.g., C18:1 > C18:1-C18:1-C16:0>C18:1-C16:0-C16:0>C16:0-C16:0-C16:0) [18,28], and informative fragments,
such as [M+H-2(RiCOOH)]+ corresponding to monoacylglycerol (MAG) fragments, which can support a most reliable assignment of isobaric compounds. Additionally, APCI-MS has the added benefit of information on regioisomers. Neutral loss of RCOOH from the equivalent side positions sn-1 and sn-3 is preferred over cleavage from the position sn-2 [19,27]. The positions sn-1 and sn-3 are considered equivalent because they cannot be distinguished by NARP-HPLC, thus, FA in sn-1 and sn-3 positions are ordered, conventionally, by decreasing molecular weight, i.e.,
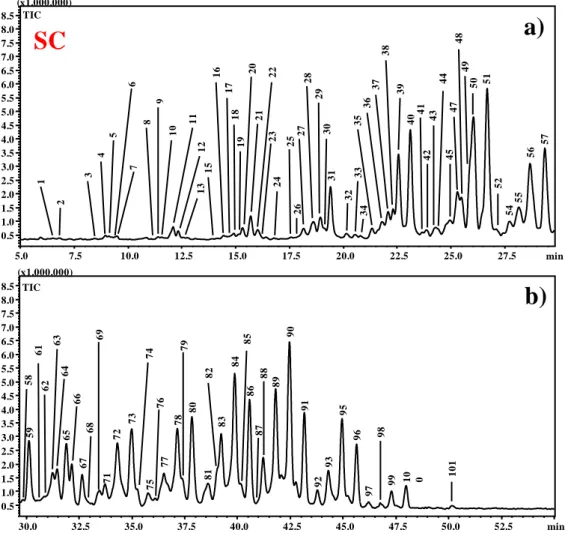
C18:0-C18:1-C16:0 (not C16:0-C18:1-C18:0). For the identification of trace peaks, the extracted ion current chromatograms of selected m/z values were used to confirm the presence or absence of compounds. Figure 3 (II-2.1.) shows the total ion current (TIC) chromatogram (two expansions), with the peaks identity corresponding to the TAGs identification reported in Table 2 (II-2.1.); while the TAGs profiles of SY and SP are reported in Supplementary Figures 3S (II-2.1.) and 4S (II-2.1.), respectively. A good separation of detected TAGs was obtained, even if a large number of coelutions were observed. Table 2 (II-2.1.) reports the number of peaks separated and the TAGs identified within each peak, for the three kinds of samples analyzed.
Figure 3 (II-2.1.) Enlargement of TIC chromatogram of SC sample by NARP-HPLC–APCI-MS. a) min 5.0–29.5; b) min 29.5–55.0.
59 58 61 62 64 65 66 67 68 69 71 72 73 74 75 76 77 79 80 63 78 81 82 83 84 86 87 85 88 89 91 92 93 95 96 97 98 10 0 101 99 90 30.0 32.5 35.0 37.5 40.0 42.5 45.0 47.5 50.0 52.5 min 0.5 1.0 1.5 2.0 2.5 3.0 3.5 4.0 4.5 5.0 5.5 6.0 6.5 7.0 7.5 8.0 8.5 (x1.000.000) TIC 1 2 3 6 11 12 13 15 16 17 18 19 20 21 22 23 24 25 27 28 29 30 31 32 33 34 35 36 37 38 39 40 41 42 43 44 45 47 49 52 54 55 56 57 26 50 51 48 5.0 7.5 10.0 12.5 15.0 17.5 20.0 22.5 25.0 27.5 0.5 1.0 1.5 2.0 2.5 3.0 3.5 4.0 4.5 5.0 5.5 6.0 6.5 7.0 7.5 8.0 8.5 (x1.000.000) TIC min
SC
a)
b)
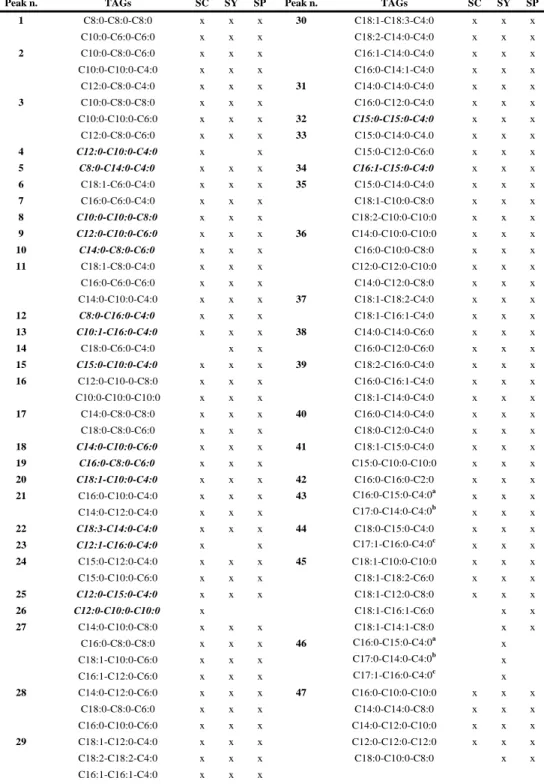
Table 2 (II-2.1.). Peak identity with TAG identification in SC, SY, and SP samples. Peak n. TAGs SC SY SP Peak n. TAGs SC SY SP
1 C8:0-C8:0-C8:0 x x x 30 C18:1-C18:3-C4:0 x x x C10:0-C6:0-C6:0 x x x C18:2-C14:0-C4:0 x x x 2 C10:0-C8:0-C6:0 x x x C16:1-C14:0-C4:0 x x x C10:0-C10:0-C4:0 x x x C16:0-C14:1-C4:0 x x x C12:0-C8:0-C4:0 x x x 31 C14:0-C14:0-C4:0 x x x 3 C10:0-C8:0-C8:0 x x x C16:0-C12:0-C4:0 x x x C10:0-C10:0-C6:0 x x x 32 C15:0-C15:0-C4:0 x x x C12:0-C8:0-C6:0 x x x 33 C15:0-C14:0-C4.0 x x x 4 C12:0-C10:0-C4:0 x x C15:0-C12:0-C6:0 x x x 5 C8:0-C14:0-C4:0 x x x 34 C16:1-C15:0-C4:0 x x x 6 C18:1-C6:0-C4:0 x x x 35 C15:0-C14:0-C4:0 x x x 7 C16:0-C6:0-C4:0 x x x C18:1-C10:0-C8:0 x x x 8 C10:0-C10:0-C8:0 x x x C18:2-C10:0-C10:0 x x x 9 C12:0-C10:0-C6:0 x x x 36 C14:0-C10:0-C10:0 x x x 10 C14:0-C8:0-C6:0 x x x C16:0-C10:0-C8:0 x x x 11 C18:1-C8:0-C4:0 x x x C12:0-C12:0-C10:0 x x x C16:0-C6:0-C6:0 x x x C14:0-C12:0-C8:0 x x x C14:0-C10:0-C4:0 x x x 37 C18:1-C18:2-C4:0 x x x 12 C8:0-C16:0-C4:0 x x x C18:1-C16:1-C4:0 x x x 13 C10:1-C16:0-C4:0 x x x 38 C14:0-C14:0-C6:0 x x x 14 C18:0-C6:0-C4:0 x x C16:0-C12:0-C6:0 x x x 15 C15:0-C10:0-C4:0 x x x 39 C18:2-C16:0-C4:0 x x x 16 C12:0-C10-0-C8:0 x x x C16:0-C16:1-C4:0 x x x C10:0-C10:0-C10:0 x x x C18:1-C14:0-C4:0 x x x 17 C14:0-C8:0-C8:0 x x x 40 C16:0-C14:0-C4:0 x x x C18:0-C8:0-C6:0 x x x C18:0-C12:0-C4:0 x x x 18 C14:0-C10:0-C6:0 x x x 41 C18:1-C15:0-C4:0 x x x 19 C16:0-C8:0-C6:0 x x x C15:0-C10:0-C10:0 x x x 20 C18:1-C10:0-C4:0 x x x 42 C16:0-C16:0-C2:0 x x x 21 C16:0-C10:0-C4:0 x x x 43 C16:0-C15:0-C4:0a x x x C14:0-C12:0-C4:0 x x x C17:0-C14:0-C4:0b x x x 22 C18:3-C14:0-C4:0 x x x 44 C18:0-C15:0-C4:0 x x x 23 C12:1-C16:0-C4:0 x x C17:1-C16:0-C4:0c x x x 24 C15:0-C12:0-C4:0 x x x 45 C18:1-C10:0-C10:0 x x x C15:0-C10:0-C6:0 x x x C18:1-C18:2-C6:0 x x x 25 C12:0-C15:0-C4:0 x x x C18:1-C12:0-C8:0 x x x 26 C12:0-C10:0-C10:0 x C18:1-C16:1-C6:0 x x 27 C14:0-C10:0-C8:0 x x x C18:1-C14:1-C8:0 x x C16:0-C8:0-C8:0 x x x 46 C16:0-C15:0-C4:0a x C18:1-C10:0-C6:0 x x x C17:0-C14:0-C4:0b x C16:1-C12:0-C6:0 x x x C17:1-C16:0-C4:0c x 28 C14:0-C12:0-C6:0 x x x 47 C16:0-C10:0-C10:0 x x x C18:0-C8:0-C6:0 x x x C14:0-C14:0-C8:0 x x x C16:0-C10:0-C6:0 x x x C14:0-C12:0-C10:0 x x x 29 C18:1-C12:0-C4:0 x x x C12:0-C12:0-C12:0 x x x C18:2-C18:2-C4:0 x x x C18:0-C10:0-C8:0 x x C16:1-C16:1-C4:0 x x x
Peak n. TAGs SC SY SP Peak n. TAGs SC SY SP 48 C18:1-C18:1-C4:0 x x x 66 C16:0-C16:0-C8:0 x x x C18:1-C14:10-C6:0 x x x C18:0-C14:0-C8:0 x x x 49 C14:0-C16:0-C6:0 x x x 67 C18:0-C16:0-C6:0 x x x 50 C18:1-C16:0-C4:0 x x x 68 C18:1-C15:0-C10:0 x x x 51 C16:0-C16:0-C4:0 x x x C17:0-C14:0-C10:0 x x x C18:0-C14:0-C4:0 x x x C17:0-C16:0-C8:0 x x x 52 C18:1-C15:0-C6:0 x x x 69 C18:0-C18:0-C4:0 x x x C18:1-C17:0-C4:0 x x x C16:0-C15:0-C10:0 x x x 53 C17:0-C17:0-C4:0 x x 70 C18:1-C12:0-C18:2 x 54 C16:0-C15:0-C6:0 x x x 71 C18:1-C18:1-C10:0 x x x C18:0-C15:0-C4:0 x x x C18:1-C16:1-C12:0 x x x C17:0-C16:0-C4:0 x x x 72 C16:1-C16:1-C14:0 x x x 55 C18:1-C18:1-C6:0 x x x C18:2-C16:0-C12:0 x x x C18:1-C18:2-C8:0 x x x C18:1-C16:0-C10:0 x x x C18:1-C12:0-C10:0 x x x C16:0-C16:1-C12:0 x x x C16:1-C16:1-C10:0 x x x C18:1-C14:0-C12:0 x x x C18:1-C14:0-C8:0 x x x C18:0-C18:1-C8:0 x x x 56 C14:0-C12:0-C12:0 x x x C18:0-C16:1-C10:0 x x x C14:0-C14:0-C10:0 x x x 73 C16:0-C14:0-C12:0 x x x C16:0-C12:0-C10 x x x C16:0-C16:0-C10:0 x x x C16:0-C14:0-C8:0 x x x C14:0-C14:0-C14:0 x x x C18:1-C16:0-C6:0 x x x C18:0-C14:0-C10:0 x x x C20:1-C14:0-C6:0 x x C18:0-C12:0-C12:0 x x x 57 C16:0-C16:0-C6:0 x x x 74 C18:0-C16:0-C8:0 x x x C18:0-C14:0-C6:0 x x x 75 C18:0-C18:0-C6:0 x x x 58 C18:0-C18:1-C4:0 x x x C18:0-C15:0-C10:0 x x x C15:0-C14:0-C10:0 x x C17:0-C16:0-C10:0 x x x 59 C18:0-C16:0-C4:0 x x x C18:1-C15:0-C12:0 x x x 60 C17:0-C16:0-C6:0 x x 76 C18:1-C18:2-C18:2 x x x C18:0-C15:0-C6:0 x x C18:1-C18:2-C16:1 x x x C15:0-C12:0-C12:0 x x 77 C18:1-C18:2-C14:0 x x x C16:0-C13:0-C10:0 x x C18:1-C16:1-C16:1 x x x C20:1-C15:0-C6:0 x x C18:1-C18:3-C16:0 x x x 61 C18:1-C18:2-C10:0 x x x C18:1-C18:1-C12:0 x x x C16:0-C15:0-C8:0 x x x C16:0-C16:1-C16:1 x x x 62 C18:1-C18:1-C8:0 x x x C18:1-C16:1-C14:0 x x x 63 C18:2-C16:0-C10:0 x x x 78 C18:2-C16:0-C14:0 x x x C18:2-C14:0-C12:0 x x x C18:1-C16:0-C12:0 x x x C18:1-C14:0-C10:0 x x x C18:0-C18:1-C10-0 x x x C16:0-C16:1-C10:0 x x x C18:1-C14:0-C14:0 x x x C18:1-C12:0-C12:0 x x x 79 C16:0-C16:1-C14:0 x x x 64 C18:1-C16:0-C8:0 x x x C16:0-C16:0-C14:1 x x x C18:1-C14:1-C12:1 x x x C18:0-C14:0-C14:1 x x x C14:0-C14:0-C14:1 x x x 80 C18:0-C16:0-C10:0 x x x 65 C18:0-C18:1-C6:0 x x x C16:0-C16:0-C12:0 x x x C14:0-C14:0-C12:0 x x x C18:0-C14:0-C12:0 x x x C16:0-C12:0-C12:0 x x x C16:0-C14:0-C14:0 x x x C16:0-C14:0-C10:0 x x x C18:0-C12:0-C10:0 x x x
TAGs in italic: most aboundant regioisomer; TAG x : same x indicates pair of TAGs with the same APCI mass spectrum, but different chromatographic retention on RP column.
2.1.6. FAMEs and TAGs Profile Evolution
The simple evaluation of the percentage profile of the three kinds of stracchino samples over time did not highlight any significant changed. Therefore, more powerful unsupervised data handling for discriminate among samples was applied. The data obtained from both the FAMEs and TAGs profiles of SC, SY, and SP was evaluated all together performing both a three-way PCA (applying the Tuker3 model and j-scaling the variables) and a traditional PCA to evaluate a general trend. The three-way PCA allows a much easier interpretation of the Peak n. TAGs SC SY SP Peak n. TAGs SC SY SP
81 C18:0-C18:0-C8:0 x x x 91 C18:1-C18:1-C17:0 x x x C16:0-C15:0-C14:0 x x x C16:0-C16:0-C16:0 x x x C17:0-C16:0-C12:0 x x x C18:0-C16:0-C14:0 x x x C18:1-C18:1-C18:2 x x x 92 C18:1-C17:0-C16:0 x x x 82 C18:1-C18:1-C16:1 x x x C18:0-C16:0-C15:0d x x x C18:1-C18:2-C16:0 x x x C17:0-C16:0-C16:0e x x x C18:0-C18:2-C16:1 x C20:1-C18:1-C18:1 x x x 83 C18:1-C18:1-C14:0 x x x 93 C18:0-C18:1-C18:1 x x x C18:0-C16:1-C16:1 x x x 94 C18:0-C18:0-C18:2 x 84 C18:1-C16:0-C16:1 x x x C18:0-C18:1-C15:0 x C16:0-C16:0-C16:1 x x x C18:0-C16:0-C15:0d x C18:2-C16:0-C16:0 x x x C17:0-C16:0-C16:0e x C18:0-C18:2-C14:0 x x x C20:1-C18:1-C16:1 x 85 C18:1-C16:0-C14:0 x x x 95 C18:0-C16:0-C18:1 x x x C18:0-C18:1-C12:1 x x x 96 C18:0-C16:0-C16:0f x x x 86 C18:0-C14:0-C14:0 x x x C18:0-C18:0-C14:0g x x x C16:0-C16:0-C14:0 x x x 97 C18:0-C18:1-C17:0h x x x C18:0-C16:0-C12:0 x x x C18:0-C17:0-C16:0i x x x 87 C18:1-C16:0-C15:0 x x x C18:0-C18:0-C15:0l x x x C18:1-C18:1-C15:0 x x x 98 C18:0-C16:0-C16:0f x x x 88 C18:1-C18:1-C18:1 x x x C18:0-C18:0-C14:0g x x x C17:0-C16:0-C14:0 x x x C18:0-C18:1-C17:0h x x x C16:0-C16:0-C15:0 x x x C18:0-C17:0-C16:0i x x x C18:0-C18:2-C15:0 x x x C18:0-C18:0-C15:0l x x x 89 C18:0-C18:0-C16:0 x x x 99 C18:0-C18:1-C18:0 x x x C18:0-C18:2-C16:0 x x x 100 C18:0-C16:0-C18:0 x x x 90 C18:1-C16:0-C16:0 x x x 101 C18:0-C18:0-C18:0 x x x C18:0-C18:1-C14:0 x x x C20:0-C16:0-C16:0 x x x
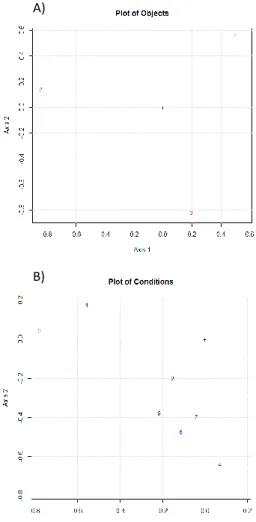
information present in the data set since it directly takes into account its three-way structure. A matrix, containing 101 TAGs peaks and 62 FAMEs, was built. The data used for such an elaboration are reported in Supplementary Table 2S (II-2.1.). Figure 4 (II-2.1.) reports the plot of object (Figure 4a (II-2.1.) and the plot of conditions (Figure 4b (II-2.1.) obtained from the three-way PCA elaboration while the plot of variables is reported in the Supplementary information (Supplementary Figure 5S (II-2.1.). As evident from the plot of objects, it was possible to clearly discriminate among the three different product types, namely SC (1), SY (2), and SP (3). Furthermore, a general trend was observed following the age of the products (plot of conditions). The products were analyzed at seven different sampling times, namely the fresh product (condition 1), at the expiring date (condition 2), and later every week for a total of five more sampling time (condition 3-7). The first sampling time (1, fresh product) was located rather far from the other conditions, except for the condition 3, which seemed to be an outlier. Performing the three-way PCA separately on the matrices obtained by the analysis of FAMEs and TAGs, it was observed that the general trend was mainly affected by the behavior of TAGs over time. While, in the elaboration of the FAMEs matrix only the sampling time 1 (t0, fresh product) was located quite far from the other conditions (data not shown). Such a general behavior can be explained by hydrolysis of the lipid components, while the occurrence of other deterioration processes on such a fraction (e.g., oxidation) during the experiment timeframe can be considered not significant.
Figure 4 (II-2.1.). a Plot of Object and b Plot of Condition obtained by performing the three-way PCA on the entire data set of FAMEs and TAGs.
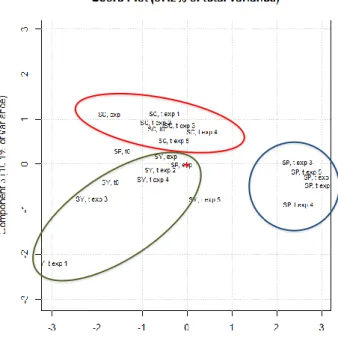
A traditional PCA was also performed on the entire matrix of data. The score plot of component 1 vs component 3 is shown in Figure 5 (II-2.1.) (57.2 % of total variance), while the loading plot is reported in Supplementary Figure 6S (II-2.1.) The results highlighted that the variability between SC and SY over storage time was far lower than the variability observed for SP after the expiring date. This behavior is probably due to the hydrolysis, along with the
A)
enzymatic activity, which mainly occurred in the SP sample, due to the presence of active microorganisms.
Differently from other lipidic products, such as vegetable oils, which undergo mainly to oxidation process of unsaturated FAMEs, in dairy products TAGs are the main fraction affected by over-storage. Such a behavior was more evident in the SP samples, probably due to the presence of particularly acid resistant Lactobacilli strains, namely L. acidophilus and L. casei (as reported in the label), which most probably remain active longer, despite the increasing acidity deriving from lactose fermentation, and caused a different product evolution compared to SC and SY. It is interesting to highlight that the sample of fresh SP (SP, t0) was not significantly different from SC and SY, while the evolution of the lipid profile of the SP samples (SP exp and SP exp 1–5) resulted very different from SC and SY. The main change on the lipid profile occurred during the shelf-life of the product, between t0 and t exp, then the overall profile remained almost the same. Many studies have reported the effect of probiotic intake in the human lipid profile, while little information has been found on the product modification related to the microbiological activity [29,30].
Figure 5 (II-2.1.). Score plot on PC1 and PC3 of FAMEs and TAGs of the SC, SY, and SP samples analyzed during the project.
2.1.7. Conclusions
In this study, the reliability of fast GC approaches for the evaluation of FAMEs profile in dairy products was proven by a qualitative and quantitative comparison. Such a rapid method for FAMEs analysis, along with a previous optimized LC–MS method for TAGs evaluation were applied to characterize the lipid profile of dairy products starting from the fresh product and following the lipid evolution after their best-by-date. Unsupervised data handling, namely PCA and three-way PCA, was applied to highlight the main differences among the three different kinds of samples analyzed and how they changed over time. Not significant differences were highlighted for SC and SY, while far more peculiar was the evolution of the lipid profile of SP, even if not further
significantly difference were highlighted after the expiring date. Such a behavior can be an interesting topic for future research. This work was the preliminary step of a larger project, devoted to the characterization of a large number of different expired dairy products to evaluate their nutritional value for possible re-introduction in the food or feed chain. The not significant change in the lipid fraction, except for particular products such as SP, will allow us to analyze the expired dairy products once delivered in our lab and consider their profile stable over a reasonable timeframe.
REFERENCES
[1] Food and Agriculture Organization of the United Nations (2011). Available at http://www.fao.org/docrep/014/mb060e/mb060e.pdf.
[2] Galanakis CM (2012) Recovery of high added-value components from food wastes: conventional, emerging technologies and commercialized applications. Trends Food Sci Technol 26:68–87.
[3] Parfitt J, Barthe M, MacNaughton S (2010) Food waste within food supply chains: quantification and potential for change to 2050. Phil Trans R Soc B 365:3065–3081.
[4] Bund RK, Pandit AB (2007) Rapid lactose recovery from paneer whey using sonocrystallization: a process optimization. Chem Eng Process 46:846– 850.
[5] El-Sayed MMH, Chase HA (2011) Trends in whey protein fractionation. Biotechnol Lett 33:1501–1511.
[6] Agatha G, Voigt A, Kauf E, Zintl F (2004) Conjugated linoleic acid modulation of cell membrane in leukemia cells. Cancer Lett 209:87–103.
[7] Kritchevsky D, Tepper SA, Wright S, Tso P, Czarnecki SK (2000) Influence of conjugated linoleic acid (CLA) on establishment and progression of atherosclerosis in rabbits. J Am Coll Nutr 19: 472S–477S.
[8] Lee KW, Lee HJ, Cho HY, Kim YJ (2005) Role of the conjugated linoleic acid in the prevention of cancer. Crit Rev Food Sci Nutr 45:135–144.
[9] Parodi PW (2004) Milk fat in human nutrition. Aust J Dairy Technol 59:3– 29.
[10] Shantha NC, Ram LN, O‘Leary J, Hicks CL, Decker EA (1995) Conjugated linoleic acid concentrations in dairy products as affected by processing and storage. J Food Sci 60:695–697
[11] IDF (1986) Cheese and processed cheese products. Determination of fat content, international standard 5B. International Dairy Federation, Brussels, Belgium.
[12] Russo M, Cichello F, Ragonese C, Donato P, Cacciola F, Dugo P, Mondello L (2013) Profiling and quantifying polar lipids in milk by hydrophilic interaction liquid chromatography coupled with evaporative light-scattering and mass spectrometry detection. Anal Bioanal Chem 405:4617–4626.
[13] Van Den Dool H, Kratz PD (1963) A generalization of the retention index system including linear temperature programmed gas–liquid partition chromatography. J Chromatogr A 11:463–471.
[14] Ackman RG (2007) In: Chow CK (ed) Fatty acids in foods and their health implications, 3rd edn., Taylor & Francis, Boca Raton.
[15] Jensen RG (2002) The composition of bovine milk lipids: January 1995 to December 2000. J Dairy Sci 85:295–350.
[16] Jensen RG, Newberg DS (1995) Milk lipids B. Bovine milk lipids. In: Jensen RG (ed) Handbook of milk composition. Academic Press, San Diego, CA, pp 543–575.
[17] Patton S, Jensen RG (1975) Lipid metabolism and membrane functions of the mammary gland. Prog Chem of Fats and other Lipids 14.
[18] Beccaria M, Sullini G, Cacciola F, Donato P, Dugo P, Mondello L (2014) High performance characterization of triacylglycerols in milk and milk-related
samples by liquid chromatography and mass spectrometry. J Chromatogr A 1360:172–187.
[19] Holčapek M, Lísa M, Jandera P, Kabátová N (2005) Quantitation of triacylglycerols in plant oils using HPLC with APCI-MS, evaporative light-scattering, and UV detection. J Sep Sci 28:1315–1333.
[20] Beccaria M, Costa R, Sullini G, Grasso E, Cacciola F, Dugo P, Mondello L (2015) Determination of the triacylglycerol fraction in fish oil by comprehensive liquid chromatography techniques with the support of gas chromatography and mass spectrometry data. Anal Bioanal Chem 407:5211– 5225.
[21] Lísa M, Holčapek M (2008) Triacylglycerols profiling in plant oils important in food industry, dietetics and cosmetics using highperformance liquid chromatography-atmospheric pressure chemical ionization mass spectrometry. J Chromatogr A 1198–1199:115–130.
[22] Lin JT, Woodruff CL, McKeon TA (1997) Non-aqueous reversed-phase high-performance liquid chromatography of synthetic triacylglycerols and diacylglycerols. J Chromatogr A 782:41–48.
[23] Mottram HR, Crossman ZM, Evershed RP (2001) Regiospecific characterisation of the triacylglycerols in animal fats using high performance liquid chromatography-atmospheric pressure chemical ionisation mass spectrometry. Analyst 126:1018–1024.
[24] Laakso P (1997) Characterization of α- and γ-linolenic acid oils by reversed-phase high-performance liquid chromatographyatmospheric pressure chemical ionization mass spectrometry. J Am Oil Chem Soc 74:1291–1300. [25] Lísa M, Holčapek M, Řezanka T, Kabátová N (2007) High-performance liquid chromatography-atmospheric pressure chemical ionization mass spectrometry and gas chromatography-flame ionization detection characterization of Δ5-polyenoic fatty acids in triacylglycerols from conifer
seed oils. J Chromatogr A 1146:67–77.
[26] Momchilova S, Tsuji K, Itabashi Y, Nikolova-Damyanova B, Kuskis A (2004) Resolution of triacylglycerol positional isomers by reversed-phase high-performance liquid chromatography. J Sep Sci 27:1033–1036.
[27] Byrdwell WC (2001) Atmospheric pressure chemical ionization mass spectrometry for analysis of lipids. Lipids 36:327–346.
[28] Holčapek M, Jandera P, Zderadička P, Hrubá L (2003) Characterization of triacylglycerol and diacylglycerol composition of plant oils using high-performance liquid chromatography-atmospheric pressure chemical ionization mass spectrometry. J Chromatogr A 1010:195–215.
[29] Marth EH, Steele JL (2001) Applied dairy microbiology, 2nd ed.,Marcel Dekker, Inc.
[30] Ogué-Bon E, Khoo C, Hoyles L,McCartney AL, Gibson GR, Rastall RA (2011) FEMS Microbiol Ecol 75:365–376.
2.2. Chemical characterisation of old cabbage (Brassica oleracea
L. var. acephala) seed oil by liquid chromatography and
different spectroscopic detection systems
2.2.1. Introduction
Recently, there has been a worldwide interest in the characterisation of yet underexploited high-quality oils. The remarkably high content of these oils in nutritionally, medicinally or industrially desirable fatty acids (FAs) make them highly valuable for various purposes [1-6].
Despite the wide range of vegetable oils sources, the world consumption is dominated by palm, soybean, rapeseed and sunflower oils. Vegetable oils with a high relative amount of minor lipid components are of great importance for human health [7] and their composition is important from the nutritional point of view. In particular, ω-3 FAs play a fundamental role in physiology, especially during foetal and infant growth and they are also important for the prevention of cardiovascular diseases as they are antithrombotic, anti-inflammatory, antiarrythmic and promote plaque stabilisation [8].
Cabbage (Brassica oleracea L.) is one of the most consumed fresh vegetables all over the world. Cabbage belongs to the Cruciferae family, which includes cauliflower, kale, broccoli and brussels sprouts. It originates from Western Europe and its different varieties are characterised by variable sizes, shapes and colours of both leaves and heads [9]. Cabbage was and is still currently used in the treatment of different diseases such as headaches, gout, diarrhoea and peptic ulcers. Several epidemiological studies indicated an inverse association between consumption of vegetables from B. oleracea and a reduced risk of cancer and cardiovascular diseases.
such as carotenes, tocopherols and glucosinolates [10,11]. It was also demonstrated that the most bioactive compounds in cabbage are phenolic compounds such as flavonoids, isoflavone, flavones, anthocyanin and catechins [12].
A particular variety of cabbage, cultivated in the Sicilian village of Rosolini (Italy), is known as ‗old cabbage‘, a particular variety named after its long life span up to 7 years mainly due to the fact that it is cultivated on the border of the stocking place of organic manure (Supplementary Figure 1S (II-2.2.).
The old cabbage belongs to the ‗acephala‘ variety and is able to survive also in dry soils. It is cultivated starting from self-production seeds and can cover up to one square metre of surface. To date, a detailed chemical characterisation of the oil extracted from the seeds of B. oleracea var. acephala grown in Rosolini is not available. In this study, we evaluate the triacylglycerol (TAG), carotenoid, tocopherol and polyphenol contents of this oil. FAs were analysed as methyl ester derivatives (FAMEs) by gas chromatography (GC) combined with flame ionisation detection (FID) and mass spectrometry (MS). TAGs were analysed by non-aqueous reversed-phase high-performance liquid chromatography (NARP-HPLC) combined with atmospheric pressure chemical ionisation mass spectrometry (APCI-MS).
Tocopherols were separated by normal-phase liquid chromatography (NP-HPLC) coupled to a fluorescence detection (RF). Finally, the polyphenolic fingerprint of the major polyphenols was achieved by RP-HPLC with photodiode array (PDA) and electrospray (ESI) MS detection.
2.2.2. Materials and methods
2.2.2.1. Chemicals and reagents
Reagent grade N,N-dimethyl-formamide (DMF), n-hexane (Hex), acetone, ethyl acetate, ethyl ether and LC-MS grade methanol (MeOH), water (H2O),
ethanol (EtOH), methyl tert-butyl ether (MTBE), acetonitrile (ACN), isopropanol (IPA) were all obtained from Sigma-Aldrich/Supelco (Milan, Italy).
α-tocopherol, γ-tocopherol and δ-tocopherol were provided by
Sigma-Aldrich/Supelco (Milan, Italy). Carotenoid standards for HPLC analysis (lutein,
β-carotene) were purchased from extrasynthese (Genay, France).
2.2.2.2. Seed material
Mature pods of B. oleracea L. var. acephala species were collected in January 2015 from Rosolini located in the South-eastern part of the Sicilian region. The seeds were collected and then hand-picked to eliminate damaged ones. The selected seeds were sun-dried for three days, carefully cleaned, weighed (5 g) and ground to powder. Press-extraction was carried out using screwless cold presses; the oil thus obtained (450 mg) was subsequently treated according to the class of analytes to investigate.
Analysis of the fatty acid content
The seed oil was dissolved in 1 mL of Hex and 1 mL of a 2 N solution of NaOH in MeOH was added, shaken for 15 s and left to stratify (about 5 min). The supernatant representing the hexane layer was then analysed by GC-MS and GC-FID system. (See supplementary materials).
Analysis of the triacylglycerol content
11.4 mg of the seed oil was weighed and dissolved in 1 mL of acetone; afterwards the sample was filtered through a 0.45-μm Acrodisc nylon membrane filter (Pall Life Sciences, Ann Arbor, MI, USA) prior to LC-MS analyses. (See supplementary materials).