U
NIVERSITY OF
N
APLES
F
EDERICO
II
D
EPARTMENT OFI
NDUSTRIALE
NGINEERING-
M
ECHANIC ANDE
NERGETICS
ECTION-
P
H
.D.
S
CHOOL IN
I
NDUSTRIAL
E
NGINEERING
–
XXX
C
YCLE
A MULTI
-
VARIABLE MULTI
-
OBJECTIVE METHODOLOGY
APPLIED TO ENERGY CONVERSION SYSTEMS
Doctoral Thesis
Ph.D. School Coordinator
prof. Michele Grassi
Tutor
prof. Alfredo Gimelli
Ph.D. Candidate
Raniero Sannino
Contents
List of figures ... iii
List of tables ... vi
Abbreviation and nomenclature ... vii
Abstract ... 1
1. World energy critical issues and Introduction ... 2
2. General multi-variable multi-objective methodology applied to energy conversion systems ... 7
2.1. Design of Experiments ... 9
2.2. Genetic algorithm MOGA-II ... 9
2.3. Energy conversion systems models: descriptions and goals ... 11
3. Case design study: Combined Heat and Power systems ... 13
3.1. Users schematization ... 14
3.2. Energy conversion system schematization ... 19
3.3. System design results ... 24
3.4. A methodology improvement: robust analysis ... 28
3.4.1. System design results: robust analysis on CHP rated power ... 33
3.4.2. System design results: robust analysis on reference scenario ... 37
3.5. Discussion ... 40
4. Case design study: Manufacturing production... 41
4.1. User schematization ... 42
4.2. Energy conversion system schematization ... 46
4.3. System design results ... 50
4.4. Discussion ... 50
5. Case experimental validation study: micro gas turbine systems ... 52
5.1. Micro gas turbine thermodynamic analysis ... 53
5.1.1. Experimental validation: Capstone C30 ... 59
5.1.2. Experimental validation: Turbec T100 ... 64
5.1.3. Discussion ... 67
5.2. Micro gas turbine one-dimensional analysis ... 69
5.2.2. Turbomachinery ... 71
5.2.3. Recuperator ... 72
5.2.4. Experimental validation: Capstone C30 ... 75
5.2.5. Discussion ... 84
6. Case experimental validation study: Pyro-gasification system ... 85
6.1. RM-09 system model ... 86
6.2. Experimental validation results ... 90
6.3. Discussion ... 94
7. Conclusions and outlook ... 95
List of figures
Figure 1: World primary energy demand ... 2
Figure 2: Global GDP, energy demand and energy-related CO2 [3] ... 3
Figure 3: Primary Energy Savings vs Electric CHP efficiency ... 5
Figure 4: Methodology flowchart ... 8
Figure 5: Annual electric demand for Ospedale San Paolo ... 15
Figure 6: Annual thermal demand for Ospedale San Paolo ... 16
Figure 7: Annual electric demand for the CROB ... 17
Figure 8: Annual thermal demand for the CROB ... 18
Figure 9: Plant and user scheme ... 19
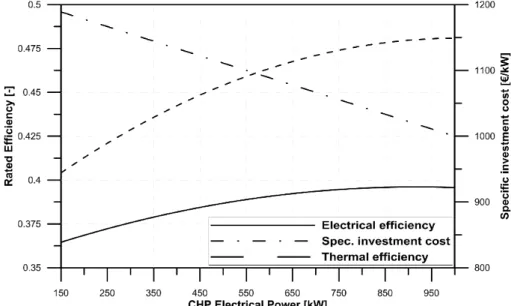
Figure 10: Thermal and electrical nominal efficiencies and specific investment cost as a function of the CHP gas engine size ... 20
Figure 11: Methodology application to hospital facilities ... 23
Figure 12: Bubble chart representing gas engine size and number for Ospedale San Paolo and the MPESM strategy. ... 24
Figure 13: Comparative analysis between MPESM and MPM management strategy for Ospedale S. Paolo 25 Figure 14: Comparative analysis: TPES as a function of TIthr for S. Paolo Hospital ... 26
Figure 15: Bubble chart representing gas engine size and number for the CROB and MPESM strategy ... 27
Figure 16: Comparative analysis between MPESM and MPM management strategies for the CROB ... 27
Figure 17: Comparative analysis: TPES as a function of TIthr for the CROB. ... 28
Figure 18: Methodology application to hospital facilities (robust analysis on CHP rated power) ... 31
Figure 19: Methodology application to hospital facilities (robust analysis on reference scenario) ... 32
Figure 20: Pareto optimal solutions from the multi-objective robust design analysis for Ospedale S. Paolo . 34 Figure 21: Pareto optimal solutions from the multi-objective robust design analysis for the CROB ... 35
Figure 22: Comparison between deterministic and stochastic approaches to multi-objective optimization for Ospedale S. Paolo ... 36
Figure 23: Comparison between deterministic and stochastic approaches to multi-objective optimization for the CROB ... 36
Figure 24: Pareto optimal solutions from the multi-objective robust design analysis for Ospedale S. Paolo . 38 Figure 25: Pareto optimal solutions from the multi-objective robust design analysis for the CROB. ... 39
Figure 26: Manufacturing user electric demand ... 43
Figure 27: Manufacturing user thermal demand (annealing oven) ... 44
Figure 28: Manufacturing user electric demand without annealing oven ... 45
Figure 29: Micro gas turbine efficiency (thermodynamic cycle without regeneration) ... 47
Figure 31: Methodology application on manufacturing industry user ... 49
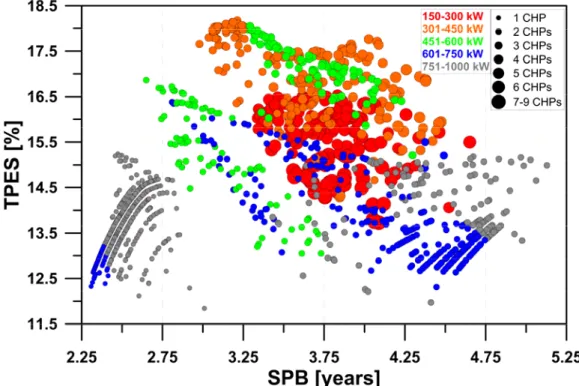
Figure 32: SPB vs TPES for CHP plants supplying taping manufacturing process ... 50
Figure 33: Micro gas turbine layout ... 53
Figure 34: Radial turbomachinery efficiency [67] ... 55
Figure 35: Methodology application on Capstone C30 thermodynamic analysis model ... 57
Figure 36: Methodology application on Turbec T100 thermodynamic analysis model ... 58
Figure 37: Capstone C30 thermodynamic analysis, multi-variable multi-objective results (G,P) ... 60
Figure 38: Capstone C30 thermodynamic analysis multi-variable multi-objective results (mfuel ∙ HHV,P) .. 61
Figure 39: Capstone C30 thermodynamic analysis multi-variable multi-objective results (G,mfuel ∙ HHV) 61 Figure 40: Capstone C30 thermodynamic analysis, multi-variable multi-objective results (T3,P and T3,G) . 62 Figure 41: Capstone C30 compressor (left) and turbine (right) performance maps ... 63
Figure 42: Turbec T100 thermodynamic analysis, multi-variable multi-objective results (G,P) ... 65
Figure 43: Turbec T100 thermodynamic analysis, multi-variable multi-objective results (T3,P) ... 65
Figure 44: Turbec T100 thermodynamic analysis, multi-variable multi-objective results (T4,P) ... 66
Figure 45: Turbec T100 thermodynamic analysis, multi-variable multi-objective results (pCC,P) ... 66
Figure 46: 1D Capstone C30 micro gas turbine model schematization ... 69
Figure 47: Capstone C30 1D model, electric generator ... 70
Figure 48: Capstone C30 annular recuperator model ... 73
Figure 49: Pressure drops in recuperator ... 73
Figure 50: Methodology application on Capstone C30 1D thermodynamic model ... 74
Figure 51: Capstone C30 1D analysis, multi-variable multi-objective results (PC, P) ... 76
Figure 52: Capstone C30 1D analysis, multi-variable multi-objective results (PT, P) ... 77
Figure 53: Capstone C30 1D analysis, multi-variable multi-objective results (PC,PT) ... 77
Figure 54: Capstone C30 1D analysis, multi-variable multi-objective results (shaft speed, mass air flow) ... 78
Figure 55: Capstone C30 1D analysis, multi-variable multi-objective results (ploss,air,ploss,gas) ... 79
Figure 56: Capstone C30 1D analysis, multi-variable multi-objective results (T3, Tstk) ... 79
Figure 57: Capstone C30 1D analysis, multi-variable multi-objective results (T2, T2R) ... 80
Figure 58: Capstone C30 1D analysis, multi-variable multi-objective results (T2, Tstk) ... 80
Figure 59: Capstone C30 1D analysis, multi-variable multi-objective results (T3, T4) ... 81
Figure 60: Capstone C30 1D analysis, multi-variable multi-objective results (T3, T2R) ... 81
Figure 61: Capstone C30 1D analysis, multi-variable multi-objective results (T4, T2R) ... 82
Figure 62: Pyro-gasification plant schematization ... 87
Figure 63: Methodology application on RM-09 pyro-gasifier ... 89
Figure 64: RM-09 thermochemical analysis, multi-variable multi-objective results (syngas volume concentration of CO,CO2, and CH4,N2,). ... 91
Figure 65: RM-09 thermochemical analysis, multi-variable multi-objective results (syngas volume concentration of C3H6,C3H8 and SO2,H2). ... 91
Figure 66: RM-09 thermochemical analysis, multi-variable multi-objective results (syngas volume
concentration of CO,O2 and CH4,C3H8) ... 92
Figure 67: RM-09 thermochemical analysis, multi-variable multi-objective results (air/fuel ratio vs CH4 in
List of tables
Table 1: Constants parameters used in design application of the methodology ... 22
Table 2: Main characteristics of the most stable solution for S. Paolo Hospital ... 34
Table 3: Main characteristics of the most stable solution for the CROB ... 35
Table 4: Stochastic decision variables used in robust design optimization ... 37
Table 5: Main characteristics of the most stable energetic and economic solution for Ospedale S. Paolo ... 38
Table 6: Main characteristics of the most stable energetic and economic solution for the CROB ... 39
Table 7: Fuel composition [66] ... 54
Table 8: Capstone C30 reference data ... 59
Table 9: Methodology setting for Capstone C30 thermodynamic analysis ... 59
Table 10: Capstone C30 preferred design ... 62
Table 11: Turbec T100 reference data [75]. ... 64
Table 12: Methodology setting for Turbec T100 thermodynamic analysis ... 64
Table 13: Turbec T100 preferred design ... 67
Table 14: Methodology application overview ... 68
Table 15: Capstone C30 1D model, pipes features [mm] ... 71
Table 16: Capstone C30 1D analysis, recuperator features ... 72
Table 17: Methodology setting for Capstone C30 one-dimensional analysis ... 75
Table 18: Capstone C30 preferred design (1D analysis) ... 83
Table 19: Pulp paper feedstock composition ... 88
Table 20: Methodology setting for RM-09 thermochemical analysis ... 90
Abbreviation and nomenclature
A Heat exchanger surface [m2]
Across Cross sectional flow area [m2] AS Heat transfer surface [m2]
CHP Combined Heat and Power
c Flow speed [m/s]
CF Fanning factor
cp Specific heat at constant pressure [J/kgK]
Deq Flow hydraulic diameter [m]
ECS Energy conversion system g Gravitational acceleration [m/s2] GDP Gross Domestic Product [$]
HIS Isentropic head
HHV Higher heating value [kJ/kg] L Characteristic linear dimension [m] LHV Lower Heating Value [kJ/kg]
m Polytropic exponent
m Mass flow rate [kg/s]
MGT Micro gas turbine
NS Specific speed
Nu Nusselt number
PE Net electric power [kW]
PC Mechanical power of compression [kW]
pCC Combustion chamber pressure
ploss Pressure drop [bar]
PM Net mechanical power [kW]
PT Mechanical power of expansion [kW]
PTH Thermal power [kW]
Pr Prandtl number
QHX Heat transfer rate [W]
Re Reynolds number
SPB Simple Pay Back period [years]
T1 Ambient air temperature / Compressor inlet temperature [K] T2 Compressor outlet temperature [K]
T3 Turbine inlet temperature [°C] , [K] T4 Turbine outlet temperature [°C] , [K]
TI Thermal Index
TIthr Thermal Index threshold
TML Logarithmic mean temperature difference [K] TSTK Temperature at stack outlet [K]
U Overall heat transfer coefficient [W/m2K]
V Volume [m3]
V Volume flow rate [m3/s]
Greek symbols
Thermal diffusivity [m2/s]
Pressure ratio
E,CHP Electric rated efficiency of CHP plant
E,ref Electric average efficiency of the national generation system TH,CHP Thermal rated efficiency of CHP plant
TH,ref Reference thermal efficiency
G Overall efficiency
IS,T Isentropic expansion efficiency P,C Polytropic compression efficiency P,T Polytropic expansion efficiency
Air index
Dynamic viscosity [kg/ms]
Kinematic viscosity [m2/s]
Density [kg/m3]
Subscripts
air Air properties
calc Calculated value
exp Experimental value
f Free stream conditions
fuel Fuel properties
gas Exhaust gas properties
nom Nominal conditions
stoich Stoichiometric conditions
Abstract
World climate change and global warming increase are two urgent and strategic issues that national and international governments have to face, and different scenarios aimed to estimate the world energy demand were realized by several research centers: each scenario distinguishes itself by energy policies over the years, and the desirable one requires many efforts to keep the temperature increase below 2°C above pre-industrial level. These efforts imply challenging targets on both primary and final energy employment, and this thesis is focused on two of them: improvement of renewable energy exploitation and reduction of final energy consumption, and energy conversion systems able to efficiently achieve these targets are cogenerated distributed plants, in particular the small scale. Nevertheless, in order to achieve significant primary energy saving, combined heat and power plants need to be designed with a substantial thermal power exploitation, as well as the design need reliable and congruent system models to evaluate the plant performances. The methodology carried out in this doctorate course was focused on the analysis of these topics and it was made by two main elements, an energy conversion system model, which describes the peculiar studied case, and a multi-variable multi-objective optimization algorithm, which depends on the specific application. In particular, two different applications of the methodology were realized, one aimed at designing the more efficient energy interaction between energy system and user and one aimed at validate thermodynamic models and experimental data congruence; the first application concerned combined heat and power plants based on internal combustion engine and gas turbine, while the second application was performed on micro gas turbines and pyro-gasification biomass plant. The methodology showed to be a potentially powerful tool about conversion energy systems analysis, due to the relevant primary energy saving related to designed cogenerated power plant and to the analysis of reliability performed on mathematical models of energy conversion systems.
1. World energy critical issues and Introduction
Nowadays, holding the increase in the global average temperature below 2 °C above pre-industrial levels [1] is one of the most relevant world challenge. Figure 1 shows primary energy demand by fuel and scenario, based on data reported in [2]: the first column represents the 2011 world total primary energy supply; the second one shows the foreseeable future primary energy supply in 2050 if the world energy politics don’t change; the third column depicts the desired so-called 450 Scenario, which was named in this way in World Energy Outlook 2008, because it involved an energy scenario where greenhouse gases in the atmosphere were limited to 450 parts per million of CO2 equivalent. Today, this scenario is expressed as realizing a 50% chance of limiting warming to a 2 °C temperature rise in 2050, that is a consistent target with the previous concentration-based definition.
Figure 1: World primary energy demand
These assessments take in account both world population growth and energy intensity, that is an indicator of the link between gross domestic product (GDP) and energy demand: in Figure 2, population growth, primary energy demand and energy-related CO2 emissions are shown for three scenarios: Current Policies, 450 and New Policies. The New Policies Scenario is based on a detailed review of policy announcements and plans already made by countries governments, and takes in account energy sectors strategies over the coming years [3].
Figure 2: Global GDP, energy demand and energy-related CO2 [3]
Concerning the energy renewable sources, as stated in [3], any solid and plausible pathway to reach climate objectives must be based on renewables; the growth noticed in recent years was driven by wind and solar photovoltaic plants, but it must be underlined that bioenergy and hydropower are the largest source of supply (Figure 1). In particular, bioenergy is employed in traditional and modern way, where traditional refers to the use of solid biomass for cooking or heating, while modern implies the use of recent technology to obtain processed biomass, liquid and gaseous biofuels. Nevertheless, bioenergy entails a sustainability issue, since there are relevant aspects such as deforestation, loss of biodiversity and land use changes: from this viewpoint, the use of residues and waste represents an advantageous exception to these aspects. The concept of “waste” illustrated in [4] is meaningful, “because it applies to any biomass-derived by-product for which supply greatly exceeds demand.” restating the abundance of bioenergy potential, which is many times greater than world demand. Two processes commonly used to obtain biofuels are gasification and pyrolysis: in general, gasification consists in the oxidation of a substance to produce gaseous fuel, using air, oxygen as oxidizing agents. Pyrolysis, in turn, is a thermochemical process of decomposition of organic matter between the temperatures of 400 and 800 °C [5].
To reach the above mentioned targets, namely renewable energy sources improvement and energy demand reduction, and the challenging goal of 2 °C limit, the most effective solutions are the adoption of the distributed generation with small scale power plants with the use of the combined heat and power (CHP) technics. International Energy Agency, in turn, highlights in [3] the key role of decarbonization and energy efficiency improvement to face the greenhouse gas emission reductions,
underlining the importance of the five-year review mechanism outlined during COP210F
1. This mechanism helps countries to observe and control, during the years, the achieving of their climate pledges. Moreover, the main topics to reach emissions reductions in power sector are a boosted deployment of renewables, a thrust for larger electrification and an expansion in clean energy research and development effort by governments and companies. One of most promising technics for primary energy saving continues to be the cogeneration [6]: combined heat and power (CHP) systems are widely studied [7]-[14] and their widespread application can lead to a significant reduction of energy demand and greenhouse gas emission [15]-[17] and can enhance power reliability [18]. In addition to these positive aspects, the growth of distributed power generation systems can provide technical and economic benefits, like reduction of energy losses and operating costs of transmission and distribution [19]-[20]. The most used technologies for distributed generation are cogeneration plants (based on micro gas turbines or internal combustion engines), wind turbines, photovoltaic plants, and mini hydro plants; the renewable sources, even if they distinguish themselves for environmental performances, have the disadvantage of uncertain availability. In fact, a hydro plant needs a reservoir, that is not always feasible, while solar radiation and wind speed anyhow depend on climate factors, even using advanced modeling approaches [21]. On the other hand, CHP systems powered by fossil fuels can ensure steady operating conditions, high efficiency, electric and thermal power supply. In order to exploit the renewable energies, in particular biomass and solar heating in CSP, that have small energy density, and to obtain the energy demand reduction it is necessary to adopt small scale distributed power plants with the adoption of the cogeneration technology. Small scale distributed power plants mean electric rated power in the interval from 0.5 kW to 3 MW. The small scale distributed generation systems modeled in cases studies are usually power plants supplied by conventional primary fossil fuels and by renewables (solid waste and solar), with combined heat and power layout.
However, some critical issues are related to the adoption of distributed generation with small scale power plants and the use of cogeneration: first, electric efficiency in most of energy systems increases along with rated power, and small distributed generation plants, ranging between 0.5 kW and 3 MW, have generally efficiency lower than 0.40. Due to this limitation, the study of the exploitation of recovered heat is a fundamental issue to identify solutions that achieve useful energy saving. In Figure 3, there are shown different curves related to different thermal power usage, on a plane with electric
1 21st Conference of the Parties since the adoption of the UN Framework on Climate Change (UNFCCC), held in Paris
efficiency of generic energy conversion system on x-axis and Primary Energy Saving (PES) on y-axis; PES is defined as:
PES 1 η 1 , η , η , η , 1.1 and η , =0.90, η , =0.46 [22].
As stated in chart legend, each curve performs the PES trend for a specific ratio of thermal power actually used on available nominal thermal power. Based on Figure 3, it must be highlighted that it is necessary to design ECS with a high value of electric efficiency, but it is mandatory to achieve high thermal power exploitation. As stated in [23], this can be accomplished through a deep analysis of user demand and ECS-user energetic interaction.
Figure 3: Primary Energy Savings vs Electric CHP efficiency
Besides this aspect, there are also other critical issues of distributed energy systems, such as energetic and economic objectives, that are often conflicting: to face this topic, optimal plant layout and management are fundamental to achieve relevant energetic and economic results; moreover, in
order to avoid an overestimation of the expected results, is useful to analyze the stability of the adopted solutions to possible changes, according to various energetic and/or economic scenarios during the plant life.
Thus, the challenging aim to face the issues related to small scale distributed power plant and CHP technology was pursued in this doctorate activities. Based on this sophisticated energy scenario, the work was focused on the development of a multi-variable multi-objective methodology applied to energy conversion systems. The methodology is substantially broken down in two main coupled elements: a model for the energy conversion system and a multi-variable multi-objective algorithm; within the algorithm, input variables and objective functions must be set, depending on the particular application. The methodology leads the calculation to find out the optimized solutions which take account of the whole objectives and constraints.
The proposed methodology was performed on two kind of applications: one aimed to achieve the more efficient plant layout designs, and one aimed to validate thermodynamic models reliability. The study shows that this methodology is a useful tool to analyze, examine and figure out the most efficient solutions in terms of total primary energy saving, suggesting power plants configurations in order to achieve the advantageous values on the PES index, as shown in Figure 3. In addition, this methodology can be used to verify consistency and reliability of the thermodynamic model and the experimental data, making it a relevant tool in designing energy systems that are capable of satisfying user demand reducing energy consumption.
The methodology and all the operating elements are described in chapter 2; chapters 3 and 4 concern two applications of the methodology on CHP plant designing coupled with two different users, hospitals (chapter 3) and manufacturing industry (chapter 4). Chapter 5 illustrates the validation application of the methodology onto two micro gas turbine plants, to verify the effectiveness of the thermodynamic model and the consistency of experimental data input and output. The last case study is in chapter 6, where an energy conversion system that combines both pyrolysis and gasification is analyzed through the proposed methodology to find the most efficient plant layout. Finally, conclusions and outlook are reported in chapter 7.
2. General multi-variable multi-objective methodology applied to energy
conversion systems
Evolutionary multi-objective optimization, in a survey announced during the 2006 World Congress on Computational Intelligence (WCCI), is considered one of the three fastest growing fields of research and application among all computational intelligence topics. A generic evolutionary optimization algorithm uses “a population based approach, where more than one solution participates in an iteration and evolves a new population of solutions in each iteration” [24]. These algorithms became popular due to several reasons, such as lack of any derivative information requirement, quite easy implementation and high flexibility that allows these methods to be applied to vast variety of fields. Inherent to any multi-objective optimization problem, there is the concept of Pareto-optimal solutions: they are a set of non-dominated solutions which need a decision making process to define a single preferred solution. This Pareto set (also called Pareto front) is very important because two or more objective functions set in the optimization can lead the calculation to a trade-off, since most optimization problems are characterized by several objectives, which are usually conflicting real functions to be maximized or minimized, and the awareness of non-dominated solutions addresses the choice of the preferred solution. A clear and accurate definition of a multi-objective optimization problem can be found in [25], as the problem of finding “a vector of decision variables which satisfies constraints and optimizes a vector function whose elements represent the objective functions. These functions form a mathematical description of performance criteria which are usually in conflict with each other. Hence, the term “optimize” means finding such a solution which would give the values of all the objective functions acceptable to the decision maker.”
The proposed methodology flowchart is reported in Figure 4 and follows these steps: the calculation starts in Design of Experiments (DoE), where several sets of input variables combinations are made using mathematical methods, such as Sobol technique [26] and an augmenting algorithm [27]; these DoE sets are the first to be used as input in the energy conversion system model. The model evaluates every DoE set, generating a results vector for each input set; these results are conveniently managed by objective functions, and are ranked by the evolutionary algorithm. Based on the specific methodology application, the objectives must be maximized or minimized and, after all the DoE sets were evaluated, new input sets were generated by a genetic algorithm called MOGA-II ([24],[28],[29]), in order to find solutions aimed to achieve the specified objective functions.
The author and his tutor’s team have already adopted this multi-objective approach ([23],[30]-[32]), demonstrating the importance of a predictive investigation conducted on a wide number of possible plant configurations to achieve optimized energetic and economic results. Similar optimization methods have been used by other authors in [33]-[35].
2.1. Design of Experiments
Design of experiments is a methodology used for guiding the choice of experiments to be performed in an efficient way [26]; DoE techniques allow one to extract as much information as possible from a limited number of test runs, and, in the cases illustrated in this thesis, DoE also provides an initial population of designs to the optimization algorithms.
Two of the DoE methodologies adopted are Sobol [26] and an augmenting algorithm: Sobol is a deterministic algorithm aimed at performing a uniform sampling of the design space. Experiments in this type of sequence are maximally avoiding of each other, filling the design space in a uniform manner; furthermore, a Sobol sequence is more resistant to high-dimensional degradation. After the first designs are generated by using the Sobol methodology, the augmenting algorithm is then used to generate a uniform distribution of points in the input space using the maximin criterion [27]. It starts from the existing points in the database and adds new points sequentially, where the minimum distance from the existing points is maximized, to fill the space in a uniform way.
2.2. Genetic algorithm MOGA-II
The evolutionary technique adopted in the methodology is MOGA-II [24],[28], an efficient multi-objective genetic algorithm (MOGA, [29]) that uses a smart multi-search elitism, aimed at preserving some excellent solutions without bringing premature convergence to local-optimal frontiers [24]. The algorithm attempts to perform a total number of evaluations that is equal to the number of points in the Design of Experiments (the initial population) multiplied by the number of generations. With reference to Figure 4, the vectors used to perform the calculation are the following:
X is a vector made by decision variables,
…
… 2.1
f is the function that operates on the input variables to obtain the vector Y as a result, namely the energy conversion system model,
…
… 2.2
Z is experimental data vector that is used in model validation cases,
…
… 2.3
more details about Z vector are in section 2.3.
In the case of multiple objectives, it is recommended to examine the concept of Pareto optimality and the correlated idea of dominance. By definition, Pareto solutions are considered optimal because there are no other designs that are superior in all objectives. Formally, the definitions are as follows: Pareto Optimal: for the purpose of maximizing all functions , a decision vector ∈ is Pareto optimal if there does not exist another decision vector ∈ such that
for all 1, … , , and
for at least one index , where is the definition domain of the function and k is the number of objectives that we want to maximize.
Dominance: A decision vector dominates another decision vector if for all 1, … , , and
for at least one index .
MOGA-II efficiency is controlled by its operators (classical crossover, directional crossover, mutation and selection) and by the use of elitism [24], which plays a crucial role in multi-objective optimization because it helps preserve the individuals that are closest to the Pareto front and the ones that have the best dispersion. At each step of the reproduction process, MOGA-II chooses one of its four operators with regard to the predefined operator probabilities.
In multi-objective optimization, each point located on the Pareto front is an optimum solution, and there is not just one best solution because no decision vector exists that can optimize all the objectives at the same time. In practice, only one of these solutions is to be chosen and, compared to single-objective optimization problems, in multi-single-objective ones, there is another important task beyond the optimization: decision-making for choosing a single most preferred solution [24]. While in design application of the methodology in was chosen a halfway solution as a preferred one, concerning the model validation application, it was identified the lowest Euclidean norm as a decision-making process: this criteria is formulated in (2.4),
∶ min 2.4
and it evaluate each objective as a minimization objective, and the preferred solution is the one identified by the value closer to zero. In other words, in the objectives space, the optimal solution is the one with the minimum distance from the ideal solution, which corresponds to the origin of the space.
2.3. Energy conversion systems models: descriptions and goals
As stated in the above sections, the methodology carried out in this thesis has been applied with two different goals: designing a more efficient ECS layout and validating an ECS model. Models and objective functions differentiate the two approaches. Design applications discussed in chapters 3 and 4, consider mathematical models of both ECS and users, since this kind of methodology employment focuses on evaluating the energetic and economic performances of ECS and, as shown in Figure 3 it is mandatory to match the energy supplied by power plant with user demand. Concerning the objective functions for these cases, they contemplate the design targets of Figure 4 and lead the optimization algorithm to find the best non-dominant solutions in term of maximizing total primary energy saving (TPES) and minimizing simple pay back (SPB). The validation applications discussed in other chapters, on the other hand, are based on thermodynamic (chap. 5) and thermochemical (chap. 6) models: in these cases, the objective functions aim to minimize the variation between calculation results and experimental data (as well as shown in Figure 4). For each calculation cycle, the resulting components of the vector Y are compared to the corresponding components of the experimental data vector Z to minimize the difference (2.5):
min min ∀ ∈ 1, 2.5
Equations (2.5) represent the objective calculation functions as reported in the logical flowchart (Figure 4), in case of model and experimental data validation. The Pareto optimal set comprises the decision vectors Xp that satisfy the following conditions:
2.6 for each ∈ 1, , and
| | 2.7 for at least one index ∈ 1, .
However, for each examined case, there are a detailed description of model, decision variables and objective functions.
3. Case design study: Combined Heat and Power systems
The strategic role of combined heat and power (CHP) generation [7] has led many research centers to study and develop micro-CHP systems based on internal combustion reciprocating engines [36],[37]. However, in addition to the energetic performance optimization of the specific cogeneration system, equally important is the study of an effective utilization of the recovered heat. This is fundamental to identify a set of CHP solutions that maximize the relevant energetic and economic objectives (e.g., primary energy saving and simple payback period) through a suitable use of the recovered thermal power and generated electricity.
To face this challenging task, several simulations and optimization tools have been adopted in recent years [38]-[41]. The most comprehensive approaches consider fluctuating energy prices, variable energy demands, part-load efficiency integration, carbon price and the possibility of selling electricity fed into the grid, as reported in [42]. A specific calculation algorithm has also been developed by the author tutor’s group [23] to conduct several analyses based on the loads of given energy users through the study of the CHP system-user interaction. In particular, to find optimum solutions (engine size and number, plant configuration and management logic) that approach the best energetic results while ensuring a reasonable profit, a multi-objective approach has been used. The developed algorithm considers several complex elements including the different pricing periods during the day (Italian time of use three tier tariff), the Italian regulatory framework, thermal and electrical nominal efficiencies (which vary depending on the CHP engine size, according to the related nominal values of some CHP reciprocating gas engines currently on the market), the specific investment costs, the possibility of selling surplus electricity to the grid at different prices according to the time band, etc.
The developed methodology was applied, in this case study, to perform a comparative analysis based on the load profiles of two specific Italian hospital facilities, thus allowing more general considerations about the potential of cogeneration within the Italian hospital sector. The case highlights how the specific load profiles of different users (even if they belong to the same sector) and the plant management strategy affect the distribution of the Pareto optimal solutions.
However, designing a CHP plant for a specific energetic, economic, regulatory or market scenario does not guarantee good performance when these scenarios change. In [43], for example, the authors said that many studies ignore uncertainties that could alter the outcome of the optimizations. For example, most of the researches considered fixed energy prices, electricity tariffs, grid carbon intensity, etc., while these quantities can vary through the plant life. Moreover, as also stated in [42], most of the proposed models do not provide real-life solutions because CHP unit sizes obtained from the numerical solution of the optimization problem could not be available in the market. Therefore,
to account for some economic and technical uncertainty, sensitivity analyses were then performed adopting multi-objective robust design optimization techniques to identify the most stable plant solutions, ensuring the highest robustness of the calculated results (section 3.4). The growing importance of robust design can be noticed especially within some specific engineering fields: for example, in [44], the robust design of structures has been formulated and solved, and the computational structural robust design problem is formulated as a multi-objective optimization problem. In [45], the authors presented specific application examples including a truss structure and an automotive inner body panel. Paper [46] addresses the robust design of a vibration absorber with mass and stiffness uncertainty in the main system. A robust optimal design method is also proposed in [47] to conduct the unit sizing of energy supply systems under uncertain energy demands, while the robust optimization of tri-generation systems is addressed in [48]. Nevertheless, while the use of robust design methods for studying energy systems is still uncommon, this analysis proposes an unconventional and effective approach to energy systems, providing two application examples. In particular, the proposed methodology, based on the multi-objective robust design approach, has been used to analyze two likely key issues: the sensitivity of the expected results to an eventual mismatch between the CHP gas engine size currently available in the market and that suggested by the numerical solution and the sensitivity of the results to certain possible changes in the reference energetic scenario and electricity market.
3.1. Users schematization
he methodology described in chapter 2 has been applied to two Italian hospital facilities, Ospedale San Paolo and Centro di Riferimento Oncologico della Basilicata (CROB). With regard to the energy consumption of Ospedale San Paolo, a detailed description of the procedure used for estimating the reference load profiles can be found in [23]: Figure 5 shows hospital’s annual electric demand while Figure 6 shows the thermal load. The electric load was also characterized on the basis of the time band of purchase, according to a three-tier pricing system to properly take into account the costs of plant operation.
The second user analyzed is the CROB, located in southern Italy. Starting from the energy consumption invoiced during the whole year of 2012 but lacking detailed monitored data, the load profiles for the CROB were estimated by properly scaling the corresponding curves obtained for Ospedale San Paolo according to the ratio between the annual thermal and electrical energy required by the two studied hospital facilities. The estimated curves obtained for the CROB are shown in Figure 7 and Figure 8.
3.2. Energy conversion system schematization
The CHP systems studied are based on reciprocating internal combustion engines fueled by natural gas, due to the dominance of this technology in small scale CHP plants applications. Starting from the load profiles of the two users (hospital facilities) described in the previous subsection, one of the goals of the current methodology application was the calculation of the potential energetic and economic benefits achievable through the whole service life of the CHP plant, which is estimated to be 10 years long. For this reason, with the goal of optimizing specific target quantities, some constrained optimization problems were solved to find optimal plant configurations (i.e., CHP engine size and number). An effective solution of these problems requires complex methods.
The energy interaction between CHP plant and user is shown in Figure 9: the plant has two energy stream, one electric and one thermal, which supply the user needs. The electric demand is easy to model and compute, unlike the thermal needs, that require a more detailed characterization because specifying the thermal power just quantitatively is not enough to define the best supplying energy system. The thermal demand has been modeled firstly by fixing the maximum and minimum required temperature; secondly, by matching this thermal quality characterization with the whole amount of needed thermal power, in order to obtain an overall thermal depiction of user needs, hour-by-hour.
Figure 9: Plant and user scheme
An ON/OFF operation has been imposed on each CHP system, with the engines ON or OFF depending on their profitability or energetic advantage, as described below. Defining the thermal efficiency as in (3.1), variations in the rated electric and thermal efficiency with the engine size have
been properly defined (Figure 10), while the thermal power really cogenerated (PTH,CHP) is calculated on the basis of the temperature level required by the users for the carrier fluid.
η P ,
m ∙ LHV 3.1
The efficiency curves in Figure 10 are based on the related nominal values of some CHP reciprocating gas engines currently on the market ([49],[50]) and cover the electric power range between 150 and 1000 kW. Assuming an ON/OFF management of the CHP gas engine in design conditions, the electric power output of the plant only depends on the engine size. Figure 10 also shows the linear regression curve used to define the specific investment cost of a single CHP unit as function of its size. To estimate the plant operating costs, the electric load profile is characterized according to the time band of purchase from the grid.
Analyses are based on the hourly average cogenerated thermal power (PTH,CHP), as calculated from thermodynamic considerations. This calculation is essential in defining the operating range of the CHP plant whether one seeks to maximize the energetic or the economic results (the total primary energy savings, TPES, as defined in equation (3.2), and SPB, or other significant quantities, respectively).
Figure 10: Thermal and electrical nominal efficiencies and specific investment cost as a function of the CHP gas engine size
TPES 1 E , η E , , ∙ p E , η , E η , ∙ p ηE , η ,E ,∙ p 3.2
The TPES in equation (3.2) is the overall primary energy saving index, which accounts of all the energy fluxes between user, CHP plant and the grid. In particular, the TPES compares the primary
energy consumption that characterize the interaction between reference user, CHP plant, auxiliary boilers and the grid in the proposed energy system to the primary energy consumption related to the separate production of the same amount of energy. This implies that possible energy integrations from the grid and auxiliary boilers are also considered. Moreover, the TPES also considers the electric energy generated by the CHP plant that exceeds the user demand, being accounted, in the separate production, with the average efficiency of thermoelectric power generation (E,ref=0.46 for the Italian power generation [22]).
In Figure 11, the optimization problem formulation is summarized: the decision variables are the nominal electric power of the CHP engine and a non-dimensional parameter called threshold thermal index (TIthr): this index is defined as the hourly ratio between the user’s thermal demand and the nominal thermal power delivered by a single CHP engine under investigation (TI=PTH/PTH,nom), and it is adopted within the developed code to quickly guide the search toward more efficient plant configurations (specifically, the number of CHP engines). It represents a threshold value imposed to the TI and has values in the range from 1 to 2. For a given CHP engine size, it is used to estimate, hour by hour, the number of CHP engines, between 1 and 9, that best meets the user’s energy demand. This variable is used within the code as follows: if a value of 1.3 is fixed for TIthr, the plant should conveniently use two CHP engines at the i-th hour of the year only if the thermal demand required by the user exceeds the maximum thermal power delivered by the first engine of over 30% (specifically, if TI=PTH/PTH,nom>1.3 and TI<1.3+1); similar considerations apply for every additional CHP engine and for every hour of the year. Thus, the obtained plant configuration (CHP engine size and number) could be conveniently oriented toward modular plant solutions characterized by an adequate exploitation of the thermal power delivered by each CHP unit, if an optimal value is set for TIthr, ensuring that clearly inefficient plant configurations should not be considered anyway.
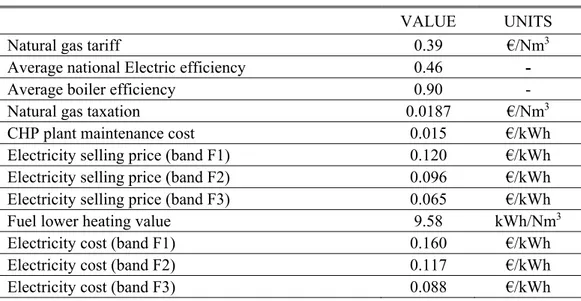
Most of the main quantities of interest are described through their respective hourly average values within the developed algorithm, offering the possibility to simulate, during a reference year, the hourly operation of the entire plant; advantages and disadvantages of this assumption are described in [23]. Others significant input constants to the algorithm and their values are shown in Table 1.
Table 1: Constants parameters used in design application of the methodology
CONSTANTS PARAMETERS FOR CHP DESIGN
VALUE UNITS
Natural gas tariff 0.39 €/Nm3
Average national Electric efficiency 0.46 -
Average boiler efficiency 0.90 -
Natural gas taxation 0.0187 €/Nm3
CHP plant maintenance cost 0.015 €/kWh Electricity selling price (band F1) 0.120 €/kWh Electricity selling price (band F2) 0.096 €/kWh Electricity selling price (band F3) 0.065 €/kWh
Fuel lower heating value 9.58 kWh/Nm3
Electricity cost (band F1) 0.160 €/kWh Electricity cost (band F2) 0.117 €/kWh Electricity cost (band F3) 0.088 €/kWh
Figure 11: Methodology application to hospital facilities
DESIGN OF EXPERIMENTS
DECISION VARIABLES
Electric rated power Thermal index threshold
MATHEMATICAL MODELS OF CHP PLANT - USER
RESULTS
OBJECTIVE FUNCTIONS Total Primary
Energy Saving
MAXIMIZE
Simple Pay Back
MINIMIZE M.O.G.A.-II START END end criteria
3.3. System design results
In order to find optimized plant configurations able to maximize energetic and economic results, the multi-objective optimization problem was solved considering both the hospital facilities and two optimized management strategies: Maximum Primary Energy Saving Management (MPESM) and Maximum Profitability Management (MPM). In MPESM strategy the CHP gas engines are ON if TPES is positive in the considered hour, while in MPM strategy the CHP gas engines are ON if there is economic profit in the considered hour. All the solutions were obtained by properly constraining the decision variable space constituted by the electric size of the single CHP unit, which varied from 150 to1000 kW, and the number of CHP units, which can vary within the range of 1-9. With reference to the two objective functions, Total Primary Energy Saving (to be maximized) and Simple Payback Period (to be minimized), the proposed approach identified over 2600 plant configurations along with the achievable energetic and economic results. Figure 12 shows the bubble chart of the distribution of the calculated solutions with reference to the two objective functions and the two decision variables: the number of engines and their nominal power output. The results refer to Ospedale San Paolo and the MPESM management strategy.
Figure 12: Bubble chart representing gas engine size and number for Ospedale San Paolo and the MPESM strategy.
Solutions from the Pareto optimal front demonstrate that plant configurations which maximize the overall energy savings increase the payback period, in agreement with results reported in literature [51],[52]. In particular, small TPES enhancements are associated with significantly worsening SPB
in this specific case. Moreover, the slope of this front, representing the trade-off between TPES and SPB, is highly affected by the regression curves of Figure 10.
As already discussed in paragraph 3.2, the number of CHP gas engines for each solution is only indirectly obtained using the threshold thermal index as a decision variable for the optimization algorithm, ensuring that clearly inefficient plant configurations should not be analyzed, even among the initialization set of points belonging to the DoE. However, the analyses demonstrate that the range of expected economic and energetic results could be wide, varying in the range of 2.9–8 years for the SPB and 6.5–17.2 for the TPES, highlighting the complex mutual interaction between economic, energetic and legal aspects.
Figure 12 also shows how multiple CHP units solutions characterized by two or three gas engines provide a good compromise between energetic and economic results. In particular, solutions in Pareto front are concentrated around values of energy savings greater than 16.5%, SPB periods of 2.9–4.6 years, 1–3 engines and rated electric power ranging from 260 to 570 kW for each engine. Moreover, among the Pareto optimal front, the minimum SPB solution consists of a single CHP engine with an electric power output of 554 kW.
To evaluate the effects of the plant management strategy on the expected results, a further multi-objective optimization using the MPM logic was performed. Figure 13 shows how the adopted strategy affects the global results, with values of the TPES that decrease by approximately 1.5% if the MPM logic is used. The Pareto optimal front ultimately collapses into a single optimal solution.
This is characterized by the use of a single 540 kW CHP engine providing values of TPES of approximately 15.8% along with an SPB of less than three years. Thus, Figure 13 demonstrates how a change in the management logic could significantly decrease the degrees of freedom available to design an optimized plant configuration.
Figure 14 shows the TPES as a function of the threshold thermal index used to define the number of CHP engines. The results clearly demonstrate that the Pareto optimal solutions are characterized by values of TIthr in the range of 1.4–1.55 for both management logics. As confirmed by the results from the CROB, this range is expected to change according to the load profile of the user, as the TPES is affected by the simultaneous demand for thermal and electric power once the energetic performance of the CHP system is fixed.
Figure 14: Comparative analysis: TPES as a function of TIthr for S. Paolo Hospital
Figure 15 shows the optimal CHP plant configurations obtained for the CROB Hospital. The Pareto optimal front shows a higher slope compared to the results in Figure 12. Therefore, it is possible to achieve the highest TPES results while accepting a reasonable worsening of the payback period. The overall energy savings reaches 18.2% (approximately 1% higher than for Ospedale S. Paolo), achieving an SPB of just over three years using three CHP engines of approximately 440 kW.
Figure 15: Bubble chart representing gas engine size and number for the CROB and MPESM strategy
Figure 16 shows how the management strategy adopted for the CHP plant influences the global results for the CROB. In particular, the values of the TPES decrease by approximately 0.5% if the MPM strategy is used, while the Pareto optimal front just shifts downwards, mostly maintaining the same trend already shown in Figure 15. However, the maximum TPES value is provided in both cases by the same plant configuration: three CHP gas engines with 440 kW of electric power output each.
Figure 17 shows the TPES as a function of the threshold thermal index, TIthr. The results of the optimization process show that the Pareto optimal solutions have values of TIthr in the range of 1.4– 2 for both of the considered management logics. This range has changed compared with Ospedale S. Paolo to match the peculiar energetic characteristics of the CHP system to the load profiles of the user under investigation. In fact, the CROB is characterized by lower hourly values of the ratio between thermal and electrical loads. The higher values of TIthr for most of the dominant solutions suggest that the rated thermal power delivered by each CHP engine must be almost completely exploited to ensure a positive contribution to the TPES together with a reasonable profit.
Figure 17: Comparative analysis: TPES as a function of TIthr for the CROB.
3.4. A methodology improvement: robust analysis
As in many engineering design problems, some input quantities may only be known to some tolerance or may change during the plant life. For this reason, optimizing a CHP plant for a specific energetic, economic or market scenario does not guarantee good performance when these scenarios change. Moreover, a calculated technical solution (i.e., CHP gas engine rated power and related nominal energetic performances) may not be matched by a corresponding product in the market. Ultimately, dominant solutions such as those calculated by solving the optimization problem expressed in chapter 2 may not include the most stable solution or may overestimate their performances. Therefore, two specific methodology application were carried out, one to estimate the
sensitivity of the results to a probable mismatch between numerical and marketed solutions, and one to consider eventual changes in the reference energetic and economic scenarios.
A robust design approach was adopted to evaluate the robustness of the calculated results by solving the problem described in 3.2-3.6. In particular, some key decision variables or economic and energetic parameters of the developed calculation algorithm were redefined using a probability distribution before the related multi-objective optimization problems were solved. A probabilistic characterization was assigned to the decision variable Xn. When a robust design optimization is performed, the investigation for the most stable region is performed by defining two different objectives for each function to optimize: both the mean value and the variance of each function are involved in the optimization process. Obviously, using probabilistic models for the input variables, the objective functions obtained as outputs of the optimization problem will also become stochastic.
The mathematical formulation of the robust design optimization problem, considering a discrete formulation for the mean value and variance as usually occurs in the engineering field, can be generally formalized as follows:
, 3.3 : ∊ 0,1 3.4 3.5 1 3.6 where: ∊ , : → is the fluctuation of the variable ,
is the probability density function is the cumulative distribution function.
When the random variable is not continuous, it is possible to define the mean and the variance starting from a series of q data using the following formula:
̅ 3.7
̅
Two probability density functions were used in this study: the uniform distribution and the normal distribution. The uniform distribution is a continuous probability density function that can be written as:
1
3.9
where ∊ ,
The mean and the variance can be easily evaluated as follows:
̅
2 3.10 12 3.11
This probability density function is suitable to describe a situation where the probability that x occurs inside a given interval is proportional to the interval width.
The normal distribution, also known as Gaussian distribution, has a symmetric bell shape function with respect to its mean value and two flex points located at ̅ . It is used to describe how the random errors of independent measurements are statistically distributed and can be written as:
1 √2 ̅ 3.12 where , ̅ ∊ , ∊
̅ and are the mean value and the standard deviation of the normal distribution, respectively. Figure 18 depicts the robust approach of the methodology related to the sensitivity analysis of CHP rated power fluctuation, while Figure 19 concerns the study of the reference scenario variation; in next analyses, the MPESM management strategy was definitively adopted because of the better results provided compared to the MPM logic.
Figure 18: Methodology application to hospital facilities (robust analysis on CHP rated power)
DESIGN OF EXPERIMENTS
DECISION VARIABLES
Electric rated power (unif) Thermal index threshold
MATHEMATICAL MODELS OF CHP PLANT - USER
RESULTS
OBJECTIVE FUNCTIONS
Total Primary Energy Saving
MAXIMIZE
Simple Pay Back
MINIMIZE M.O.G.A.-II START END end criteria
Figure 19: Methodology application to hospital facilities (robust analysis on reference scenario)
DESIGN OF EXPERIMENTS
DECISION VARIABLES
Electric rated power Thermal index threshold
MATHEMATICAL MODELS OF CHP PLANT - USER
RESULTS
OBJECTIVE FUNCTIONS
Total Primary Energy Saving
MAXIMIZE
Simple Pay Back
MINIMIZE M.O.G.A.-II START END end criteria STOCHASTIC VARIABLES
Selling price in time band F1 () Selling price in time band F2 () Selling price in time band F3 () Thermo-electric generation, reference efficiency () Selling price of the energy efficiency certificates ()
3.4.1. System design results: robust analysis on CHP rated power
As shown in previous section, a multi-variable multi-objective robust design optimization process has been carried out in order to investigate for stable economic and energetic solutions. The goal of the robust analysis was to minimize the mean values of the SPB and maximize the mean values of the TPES while obtaining low standard deviation values (referred to as std-dev in the following charts) for these quantities. The solutions that minimize the ratio / (std-dev/mean-value) for both the TPES and SPB are recognized as most robust energetic and economic results: the ratio /
accounts for the relative weight of the standard deviation of the considered objective functions over their mean value.
Referencing the objective functions TPES and SPB, a multi-objective optimization problem was solved to estimate the sensitivity of the expected results to possible difficulties in finding commercially available CHP gas engines with rated power reasonably close to the optimal numerical solutions. To pursue this aim, the CHP engine size was turned into a statistical decision variable of the optimization problem and described through a uniform distribution (see equations 3.9-3.11). In particular, CHP engine size was defined through a set of 25 sample designs distributed over a range of 60 kW and centered on the mean value currently analyzed by the genetic algorithm MOGA II.
Figure 20 shows, in the / (SPB) – / (TPES) plane, the Pareto optimal solutions obtained from the multi-objective robust design optimization for Ospedale S. Paolo. For the single objective functions, Figure 20 highlights a higher energetic stability for most of the optimal solutions because of the imposed management strategy (MPESM logic), whereas the SPB is highly affected by variations in the engine size actually available. In fact, given a value of the threshold thermal index, TIthr, a change in the available gas engine rated power could even induce variations in the number of engines adopted and the related investment costs as a consequence of the changes in the hourly values of the ratio PTH/PTH,nom. For this reason, the results indicates that the economic sensitivity is often higher than the energetic sensitivity, with standard deviation accounting up to 7% of its mean value for the SPB, whereas the ratio of / for the TPES is always under 3%. This representation also enables ranking these solutions according to the equal-stability curves, depicted by dashed lines in Figure 20. Consistently with the notion of multi-objective analysis, these curves are defined as arcs of circumference in the reference plane. The most stable plant design is shown in red, and its main features are summarized in Table 2.
Figure 20: Pareto optimal solutions from the multi-objective robust design analysis for Ospedale S. Paolo
Table 2: Main characteristics of the most stable solution for S. Paolo Hospital
S. PAOLO HOSPITAL: THE MOST STABLE PLANT DESIGN
VALUE UNITS
CHP units 1 -
Electric power (mean value) 482.19 kW
TPES min 14.32 % TPES mean 14.87 % TPES max 15.23 % SPB min 2.91 years SPB mean 2.98 years SPB max 3.05 years
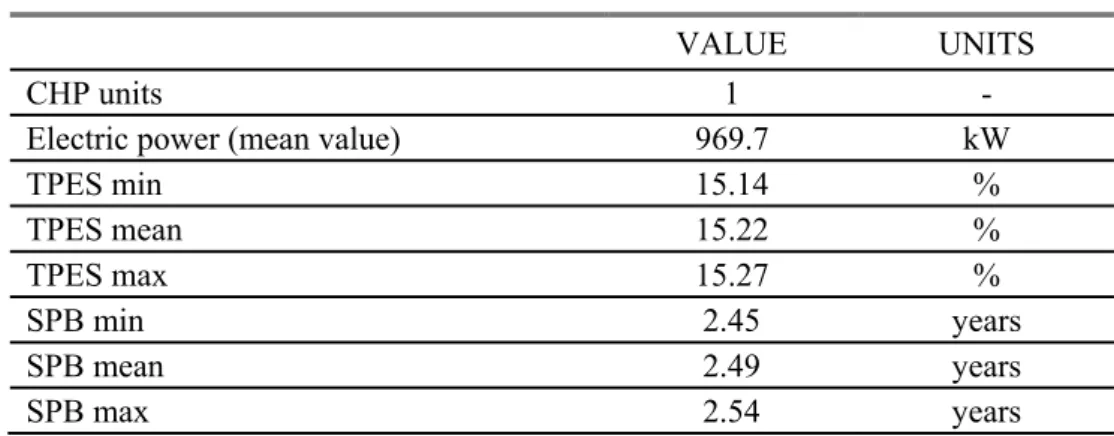
The Pareto optimal solutions obtained for the CROB are shown in Figure 21, with most of the optimal solutions characterized by even higher energetic stability if compared to the S. Paolo Hospital (the ratio of / for the TPES is mostly under 2%). The most stable plant design for the CROB is shown in red, and its main characteristics are summarized in Table 3.
Figure 21: Pareto optimal solutions from the multi-objective robust design analysis for the CROB
Table 3: Main characteristics of the most stable solution for the CROB
CROB: THE MOST STABLE PLANT DESIGN
VALUE UNITS
CHP units 1 -
Electric power (mean value) 969.7 kW
TPES min 15.14 % TPES mean 15.22 % TPES max 15.27 % SPB min 2.45 years SPB mean 2.49 years SPB max 2.54 years
Figure 22 and Figure 23 show how the expected results obtained through a deterministic definition of the input decision variables within the multi-objective optimization can overestimate the objective functions compared to the robust design approach. Specifically, the red circles represent the maximum TPES solutions obtained in section 3.3 for the two studied hospital facilities. The blue crosses represent the 25 sample designs belonging to the same robust design solution and therefore
to the same statistical distribution for the engine size. In particular, the mean value of this distribution is equal to the engine size of the red solution. Figure 22 shows that SPB can range from 4.3 to 5.3 years and that the TPES can range from 16.7 to 17.1 if the robust design approach is used, according to the actual commercial availability of the target engine size. Figure 23 shows similar energetic and economic variations for the objective functions and the CROB. The significantly higher value of the SPB for the solution on the right hand of Figure 23 is due to having one CHP engine more than the other solutions, according to the current values of the threshold thermal index and CHP engine size.
Figure 22: Comparison between deterministic and stochastic approaches to multi-objective optimization for Ospedale S. Paolo
3.4.2. System design results: robust analysis on reference scenario
To estimate the fluctuations induced in the expected results due to possible changes in the reference energetic and economic scenarios, a second multi-objective robust design optimization was performed with reference to the TPES and SPB objective functions. In particular, the selling price of the electricity in different time bands, the reference efficiency of the Italian thermoelectric generation and the selling price of the energy efficiency certificates recognized by the Italian legislation to cogeneration plants were set as stochastic variables and were described by normal probability distributions (Table 4). The threshold thermal index and the gas engine size were the two decision variables. Figure 24 summarizes, in the / (SPB) – / (TPES) plane, the energetic and economic stability of the Pareto optimal solutions for Ospedale S. Paolo. In particular, the standard deviation for the SPB is always under 3.5% of its mean value. This percentage, which gives an estimation of the fluctuations of the objective functions within the plant life cycle, reaches 7% for the TPES. The most stable plant design is shown in red, and its characteristics are reported in Table 5.
Table 4: Stochastic decision variables used in robust design optimization
ROBUST DESIGN OPTIMIZATION: STOCHASTIC VARIABLES
INPUT DECISION VARIABLE RANGE UNIT DISTRIB. STD. DEV. Selling price in time band F1 0.10–0.14 €/kWh Normal 0.003 Selling price in time band F2 0.076–0.116 €/kWh Normal 0.003 Selling price in time band F3 0.045–0.085 €/kWh Normal 0.003 Electric average national efficiency 43.5–48.5 % Normal 1 Selling price of the energy efficiency certificates 90–110 €/cert. Normal 3
Figure 24: Pareto optimal solutions from the multi-objective robust design analysis for Ospedale S. Paolo
Table 5: Main characteristics of the most stable energetic and economic solution for Ospedale S. Paolo
OSPEDALE SAN PAOLO: THE MOST STABLE PLANT DESIGN
VALUE UNITS CHP units 3 - Electric power 331 kW TPES min 17.12 % TPES mean 17.69 % TPES max 19.25 % SPB min 4.45 years SPB mean 4.58 years SPB max 4.79 years
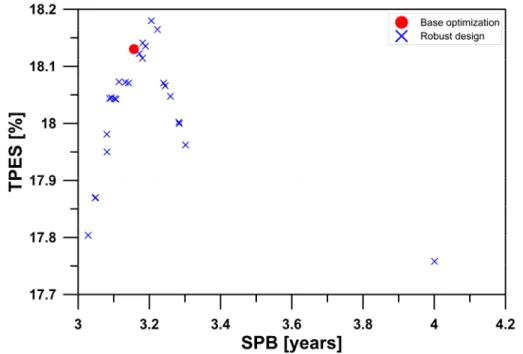
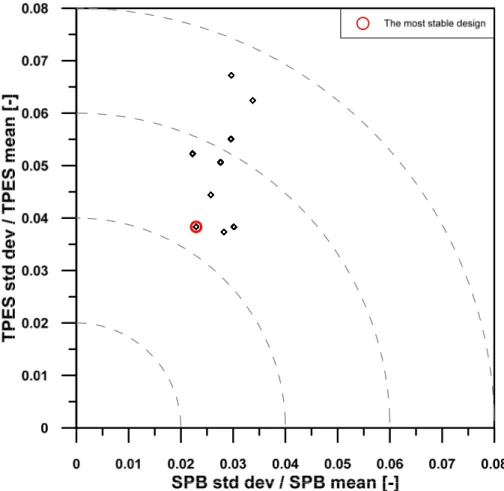
The same multi-objective robust design analysis was conducted for the CROB. The energetic and economic stability of the dominant solutions for the CROB is shown in Figure 25 in the / (SPB) – / (TPES) plane. The standard deviation for the SPB is always under 2.5% of its mean value. This percentage increases to 6% for the TPES. The most stable plant design is shown in red, and its characteristics are reported in Table 6.
Figure 25: Pareto optimal solutions from the multi-objective robust design analysis for the CROB.
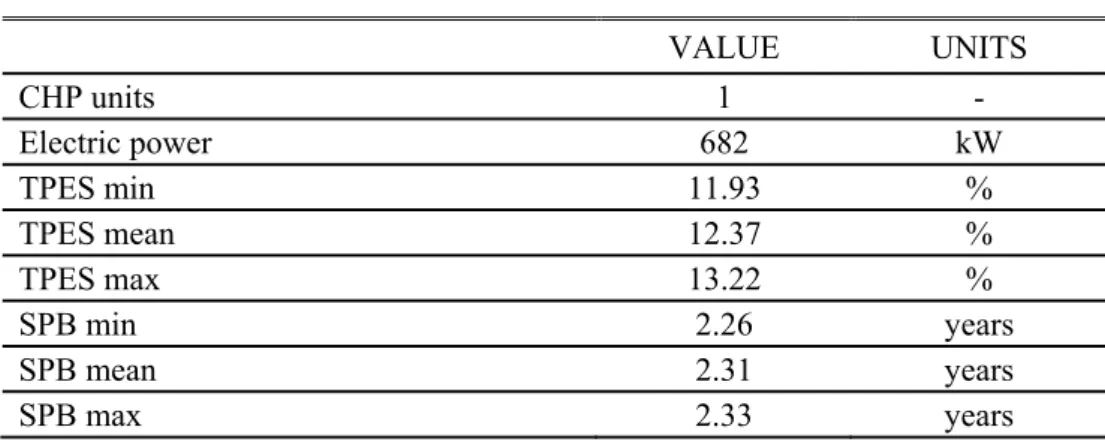
Table 6: Main characteristics of the most stable energetic and economic solution for the CROB
CROB: THE MOST STABLE PLANT DESIGN
VALUE UNITS CHP units 1 - Electric power 682 kW TPES min 11.93 % TPES mean 12.37 % TPES max 13.22 % SPB min 2.26 years SPB mean 2.31 years SPB max 2.33 years
3.5. Discussion
The application of the studied methodology to design an efficient energy conversion system forecasting the CHP system-user interaction, led to determine optimized plant configurations with primary energy savings of over 17%, along with SPBs under 4.6 years. In particular, the Pareto dominant solutions for Ospedale S. Paolo are concentrated around energy savings greater than 16.5%, SPBs in the range of 2.9 to 4.6 years, 1–3 engines and electric rated power ranging between 260 and 570 kW for each unit. For the CROB, the overall energy saving reaches the maximum value of 18.2% when the SPB is just over three years for a plant configuration consisting of three CHP gas engines with 440 kW of electric rated power output each; the same plant solutions that maximize the TPES provide a reduction of carbon dioxide emissions ranging from 20 to 22% [30].
Furthermore, a multi-objective robust design optimization has been carried out to find most stable economic and energetic solutions, based on minimizing the ratio / (standard-deviation/mean-value) for both the TPES and SPB. This ratio / , accounts for the relative weight of the standard
deviation of the considered objective functions over their mean value. A first multi-objective optimization problem was solved to estimate the sensitivity of the expected results to possible difficulties in finding commercially available CHP gas engines with sizes reasonably close to the optimal numerical solutions. The results indicate, for Ospedale S. Paolo, that the economic sensitivity is often higher than the energetic sensitivity for most of the optimal solutions, with standard deviation accounting up to 7% of its mean value for the SPB, whereas the ratio of / for the TPES is always under 3%. Similar considerations can be conducted for the CROB. The case study also highlights how the expected results obtained through a deterministic definition of the input decision variables within the multi-objective optimization could be overestimated compared to the robust design approach. A second multi-objective robust design optimization has been performed to estimate the fluctuations of the expected results due to possible changes in the reference energetic and economic scenarios. In particular, the selling price of the electricity in different time bands, the reference efficiency of the Italian thermo-electric generation and the selling price of the energy efficiency certificates recognized by the Italian legislation to cogeneration plants have been set as stochastic decision variables. The research highlights how Pareto optimal solutions for the S. Paolo Hospital indicate that the standard deviation for the SPB is always less than 3.5% of its mean value, while this percentage reaches 7% for the TPES. Pareto optimal solutions for the CROB are characterized by standard deviation for the SPB that is always less than 2.5% of its mean value. This percentage increases to 6% for the TPES.