Ambient Air Pollution and Cancer Mortality in the Cancer Prevention Study II
Michelle C. Turner,1,2,3,4Daniel Krewski,1,5W. Ryan Diver,6C. Arden Pope III,7Richard T. Burnett,8Michael Jerrett,9 Julian D. Marshall,10and Susan M. Gapstur6
1
McLaughlin Centre for Population Health Risk Assessment, University of Ottawa, Ottawa, Canada
2Barcelona Institute for Global Health (ISGlobal), Barcelona, Spain 3
Universitat Pompeu Fabra (UPF), Barcelona, Spain
4CIBER Epidemiología y Salud Pública (CIBERESP), Madrid, Spain 5
School of Epidemiology and Public Health, Faculty of Medicine, University of Ottawa, Ottawa, Canada
6Epidemiology Research Program, American Cancer Society, Atlanta, Georgia, USA 7
Department of Economics, Brigham Young University, Provo, Utah, USA
8Population Studies Division, Health Canada, Ottawa, Canada 9
Department of Environmental Health Sciences, Fielding School of Public Health, University of California Los Angeles, Los Angeles, California, USA
10Department of Civil and Environmental Engineering, University of Washington, Seattle, Washington, USA
BACKGROUND:The International Agency for Research on Cancer classified both outdoor air pollution and airborne particulate matter as carcinogenic to humans (Group 1) for lung cancer. There may be associations with cancer at other sites; however, the epidemiological evidence is limited. OBJECTIVE:The aim of this study was to clarify whether ambient air pollution is associated with specific types of cancer other than lung cancer by examining associations of ambient air pollution with nonlung cancer death in the Cancer Prevention Study II (CPS-II).
METHODS:Analysis included 623,048 CPS-II participants who were followed for 22 y (1982–2004). Modeled estimates of particulate matter with aer-odynamic diameter <2:5 lm (PM2:5) (1999–2004), nitrogen dioxide (NO2) (2006), and ozone (O3) (2002–2004) concentrations were linked to the
participant residence at enrollment. Cox proportional hazards models were used to estimate associations per eachfifth percentile–mean increment with cancer mortality at 29 anatomic sites, adjusted for individual and ecological covariates.
RESULTS:We observed 43,320 nonlung cancer deaths. PM2:5was significantly positively associated with death from cancers of the kidney {adjusted hazard ratio (HR) per 4:4 lg=m3= 1:14 [95% confidence interval (CI): 1.03, 1.27]} and bladder [HR = 1:13 (95% CI: 1.03, 1.23)]. NO
2was positively
associated with colorectal cancer mortality [HR per 6:5 ppb = 1:06 (95% CI: 1.02, 1.10). The results were similar in two-pollutant models including PM2:5and NO2 and in three-pollutant models with O3. We observed no statistically significant positive associations with death from other types of
cancer based on results from adjusted models.
CONCLUSIONS:The results from this large prospective study suggest that ambient air pollution was not associated with death from most nonlung can-cers, but associations with kidney, bladder, and colorectal cancer death warrant further investigation.https://doi.org/10.1289/EHP1249
Introduction
The International Agency for Research on Cancer (IARC) classi-fied outdoor air pollution and airborne particulate matter as carcino-genic to humans (Group 1) for lung cancer based onfindings from observational and experimental studies as well as from strong mech-anistic evidence (IARC 2013). Recent meta-analyses reported posi-tive associations of particulate matter with aerodynamic diameter
<2:5 lm (PM2:5 {relative risk (RR) per 10lg=m3= 1:09 [95%
confidence interval (CI): 1.04, 1.14]} and nitrogen dioxide (NO2)
[RR per 10lg=m3= 1:04 (95% CI: 1.01, 1.08) with lung cancer
risk (Hamra et al. 2014,2015). Similarfindings were reported in other recent reviews (Cui et al. 2015;Yang et al. 2016).
Ambient air pollution represents a complex mixture of a broad range of carcinogenic and mutagenic substances that may play a role in chronic systemic inflammation, oxidative stress, and DNA damage in tissues other than the lung (Brook et al. 2010;Crouse et al. 2010;IARC 2012,2013;Newby et al. 2015). As such, there may also be associations between ambient air pol-lution and other types of cancer; however, the epidemiological evidence for these associations is limited (IARC 2013).
Some previous studies reported positive associations of ambi-ent air pollution with fatal bladder cancer (Liu et al. 2009), pancre-atic cancer (Ancona et al. 2015), upper digestive tract, digestive accessory organs, and breast cancer (Wong et al. 2016), and with incident brain and cervical cancer (Raaschou-Nielsen et al. 2011), breast cancer (Crouse et al. 2010;Reding et al. 2015), hepatocellu-lar carcinoma (Pan et al. 2015), and prostate cancer (Parent et al. 2013). Results from other studies of fatal brain cancer ( McKean-Cowdin et al. 2009), incident brain tumors (Poulsen et al. 2016), and incident leukemia (Winters et al. 2015) were mixed or null. Previous studies are difficult to compare given variation in the spe-cific cancers studied; whether outcomes were incident versus fatal cancers; and differences in study design, sample size, exposure assessment, and the availability of data on potential confounders.
We previously reported positive associations between long-term ambient air pollution exposure and lung cancer mortality in the American Cancer Society (ACS) Cancer Prevention Study II (CPS-II) (Jerrett et al. 2013;Krewski et al. 2000,2009;Turner et al. 2011, 2014, 2016). For example, we estimated that a 10-lg=m3increase in PM
2:5concentrations was associated with a
Address correspondence to M.C. Turner, McLaughlin Centre for Population Health Risk Assessment, University of Ottawa, 600 Peter Morand Cres., Room 216, Ottawa, Ontario, Canada K1G 3Z7. Telephone: 613-562-5381. Email:[email protected]
Supplemental Material is available online (https://doi.org/10.1289/EHP1249). M.C.T. reports personal fees from ICF Incorporated, LLC, outside this work. D.K. reports serving as Chief Risk Scientist and CEO at Risk Sciences International (http://www.risksciences.com), a Canadian company established in 2006 in partnership with the University of Ottawa conducting work in air quality risk assessment for both public and private sector clients. D.K. also holds an Industrial Research Chair in Risk Science under a peer-reviewed uni-versity–industry partnership program administered by the Natural Sciences and Engineering Research Council of Canada, which involves methodological research in air pollution risk assessment. D.K. also recently served as Chair of the U.S. Health Effects Institute Diesel Epidemiology Panel, which conducted an evaluation of recent epidemiological evidence on quantitative risk assess-ment of diesel emissions and lung cancer.
All other authors declare they have no actual or potential competing financial interests.
Received 18 October 2016; Revised 31 March 2017; Accepted 31 March 2017; Published 21 August 2017.
Note to readers with disabilities:EHP strives to ensure that all journal content is accessible to all readers. However, somefigures and Supplemental Material published in EHP articles may not conform to508 standardsdue to the complexity of the information being presented. If you need assistance accessing journal content, please [email protected]. Our staff will work with you to assess and meet your accessibility needs within 3 working days.
A Section 508–conformant HTML version of this article is available athttps://doi.org/10.1289/EHP1249.
9% (95% CI: 3, 16%) increase in lung cancer mortality (Turner et al. 2016, Table E4). The CPS-II is a large-scale prospective cohort in which the human health effects of ambient air pollution have been extensively investigated. The objective of this work was to clarify whether ambient air pollution is associated with specific types of cancer other than lung cancer by examining associations of ambient air pollution with nonlung cancer death among 623,048 CPS-II participants who were followed for 22 y.
Methods
Study Population
Approximately 1.2 million CPS-II participants were enrolled by 77,000 volunteers in 1982 throughout the entire United States, Washington, DC, and Puerto Rico. Participants, largely friends and family members of volunteers, were≥30 y old with a family member ≥45 y old. A detailed self-administered questionnaire was completed at enrollment to obtain demographic, medical, and behavioral information (CPS-II questionnaires are available at https://www.cancer.org/research/we-conduct-cancer-research/ epidemiology/cancer-prevention-questionnaires.html). Informed consent was implied by completion and return of the enrollment questionnaire. The Emory University School of Medicine Human Investigations Committee has approved all aspects of the CPS-II.
Volunteers ascertained the vital status of participants they had enrolled in 1984, 1986, and 1988, and death certificates, coded by trained nosologists, were used to determine the underlying cause of death, that is,“the disease or injury which initiated the train of morbid events leading directly to death” (WHO 1992). Since 1989, the National Death Index (NDI) has been used to determine vital status and underlying cause of death (Calle and Terrell 1993). Underlying cause of death was categorized accord-ing to the International Classification of Diseases (ICD) revisions 9 and 10 (WHO 1977,1992). More than 99% of known deaths were assigned a cause.
Ambient Air Pollution Concentrations
PM2:5concentrations were assigned to the geocoded participant res-idence at enrollment based on a national-level hybrid land use regression (LUR) and Bayesian maximum entropy (BME) inter-polation model (Beckerman et al. 2013) used in previous work (Jerrett et al. 2016;Pope et al. 2015;Turner et al. 2014;2016). Details on the geocoding of participant residences are presented elsewhere (Pope et al. 2015). A total of 104,172 observations were collected monthly from 1,464 monitoring sites between 1999 and 2008. Approximately 10% of observations were re-served for cross-validation. PM2:5concentrations were predicted in a base LUR model that included traffic within 1 km (based on modeled traffic counts) and the cube of green space within 100 m. A BME interpolation model was then used to account for
residual spatiotemporal variation in PM2:5 concentrations, and the two estimates were combined. The cross-validation R2 was
0.79, suggesting good spatiotemporal model prediction at loca-tions other than those used to calibrate the model. Mean PM2:5
concentrations at the enrollment residence for the period 1999– 2004 were used in the present analysis to coincide with the cohort follow-up period.
NO2 concentrations were assigned at the census block group
level to each participant enrollment residence. A national LUR model was used that incorporated both hourly monitoring data from 423 monitors and ∼ 4 million satellite-based measurements in an approximate 10 km × 10 km grid scale, including additional data on population density, land use, and distance to roadways for the year 2006 (model R2= 0:78) (Novotny et al. 2011;Turner
et al. 2016).
Ozone (O3) concentrations were obtained from the U.S.
Environmental Protection Agency (EPA) and Centers for Disease Control and Prevention (CDC) Environmental Public Health Tracking Network Hierarchical Bayesian space time model (HBM) combining data from national air monitoring stations/ state and local air monitoring stations (NAMS/SLAMS) and the Models-3/Community Multiscale Air Quality (CMAQ) photo-chemical model (U.S. EPA 2011). Daily 8-h maximum concen-trations at a 36 km × 36 km grid scale for the years 2002–2004 were assigned to each participant enrollment residence (Turner et al. 2016).
Statistical Methods
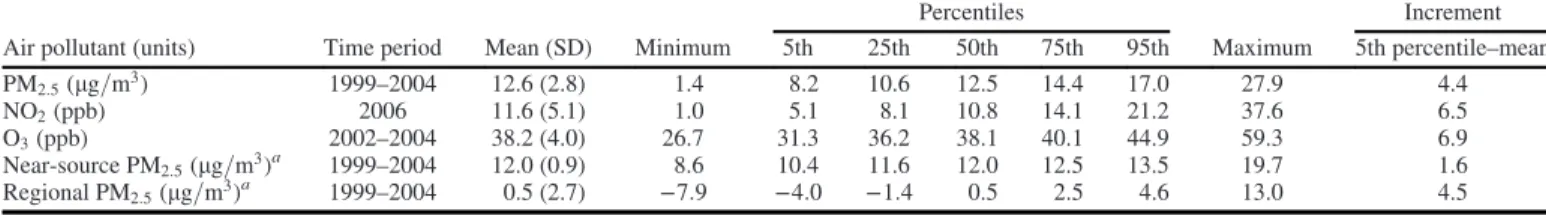
Both single- and multipollutant Cox proportional hazards regres-sion models were used to estimate associations of ambient PM2:5, NO2, and O3concentrations with death from 29 specific types of
cancer according to an increment of the mean minus thefifth per-centile for each pollutant (4:4 lg=m3for PM2:5, 6:5 ppb for NO2,
and 6:9 ppb for O3) (Table 1). The fifth percentile–mean
incre-ment was used for comparability of results across pollutants and with previous work (Turner et al. 2016).
Models were stratified by 1-y age categories, gender, and race/ethnicity (white, black, other) to allow for separate baseline hazards according to these characteristics. In addition, in the mul-tivariate model, we also adjusted for baseline values of education (<high school, high school, >high school); marital status (single, married, other); body mass index (BMI); BMI squared; smoking status (never cigarettes, pipes, or cigars; current cigarette smoker only; former cigarette smoker only; ever pipe/cigar); cigarettes per day and cigarettes per day squared (current and former ciga-rette smokers); years smoked and years smoked squared (current and former cigarette smokers); started smoking <18 y old (yes/ no) (current and former cigarette smokers); passive smoking (hours per day exposed to cigarette smoke of others at home, work, or other areas); usual dietary intake of vegetables, fruit, and fiber (combined, in quintiles) and fat (quintiles), plus a
Table 1.Distribution of air pollution concentrations, CPS-II cohort, United States (n = 623,048).
Air pollutant (units) Time period Mean (SD) Minimum
Percentiles Maximum Increment 5th 25th 50th 75th 95th 5th percentile–mean PM2:5(lg=m3) 1999–2004 12.6 (2.8) 1.4 8.2 10.6 12.5 14.4 17.0 27.9 4.4 NO2(ppb) 2006 11.6 (5.1) 1.0 5.1 8.1 10.8 14.1 21.2 37.6 6.5 O3(ppb) 2002–2004 38.2 (4.0) 26.7 31.3 36.2 38.1 40.1 44.9 59.3 6.9 Near-source PM2:5(lg=m3)a 1999–2004 12.0 (0.9) 8.6 10.4 11.6 12.0 12.5 13.5 19.7 1.6 Regional PM2:5(lg=m3)a 1999–2004 0.5 (2.7) −7:9 −4:0 −1:4 0.5 2.5 4.6 13.0 4.5
Note: CPS-II, Cancer Prevention Study II; NO2, nitrogen dioxide; O3, ozone; PM2:5, particulate matter with aerodynamic diameter <2:5 lm.
aThe land use regression Bayesian maximum entropy (LURBME) PM
2:5model was created in three main steps: a) A base LUR model predicted PM2:5concentrations based on traffic within 1 km (based on modeled traffic counts) and the cube of green space within 100 m; b) A BME interpolation model was then used to interpolate residual spatiotem-poral variation in PM2:5concentrations; c) The two estimates were then combined. Regional PM2:5concentrations therefore represent a residual with some observations less than zero.
category for missing/bad dietary intake data; usual consumption of beer (yes, no, missing), wine (yes, no, missing), and liquor (yes, no, missing); occupational exposures (ever regular exposure to asbestos, chemicals/acids/solvents, coal or stone dusts, coal tar/pitch/asphalt, formaldehyde, or diesel engine exhaust) (yes/ no); and an occupational dirtiness index to characterize workplace PM2:5 exposure based on main lifetime occupation (six categories of exposure vs. a referent category, or missing) (Siemiatycki et al. 2003). In addition, we used 1990 census data to derive the following socioecomonic covariates defined at the ZIP-code level for each participant’s residence at enrollment: median household income, percentage of African American residents, percentage of Hispanic residents, percentage of adults with post-secondary education, per-centage of unemployed residents≥16 y old, and percentage of resi-dents with household incomes <125% of the poverty level. For each characteristic, we modeled the value for the ZIP code of resi-dence and for a second variable indicating the difference between that value and the county-level mean (Jerrett et al. 2016;Pope et al. 2015;Turner et al. 2016;U.S. Department of Commerce Bureau of the Census 1993). The time axis was follow-up time in days. Participants lost to follow-up or who were alive at the end of follow-up were censored.
For analysis of death from cancers of the uterus, cervix, or ovary, participants were excluded if they reported a previous hys-terectomy or an artificial (vs. a natural) menopause (n = 108,956). An additional 7,143 participants were also excluded from analysis of ovarian cancer mortality if they reported having undergone an ovarian surgery because no information was available to distin-guish partial from total oophorectomy.
A sensitivity analysis was performed to examine the influence of including additional baseline variables in the model including usual physical exercise (none, slight, moderate, heavy, missing), aspirin use in the past month (yes/no), and usual dietary intake of red meat (quintiles) for analysis of all cancer sites, as well as self-reported physician-diagnosed diabetes (yes/no). Detailed reproductive and hormonal variables, including age at menarche (<12 y old, 12–13 y old, ≥14 y old, missing), parity (0, 1, 2, 3, ≥4, missing), age at first birth (none, <20 y old, 20–29 y old, ≥30 y old, missing), ever oral contraceptive use (yes, no, miss-ing), ever postmenopausal hormone use (yes, no, missmiss-ing), and postmenopausal status (yes, no, missing) were also included in models for sensitivity analysis of female reproductive cancers. Additional analyses were also performed in postmenopausal women only.
Further, we decomposed PM2:5 concentrations into near-source and regional fractions to determine whether associations might vary for PM2:5from different air pollution sources (Turner et al. 2016). Near-source PM2:5concentrations were PM2:5 con-centrations predicted at each monitoring station based on land-use and traffic count data using the LUR model created in the first stage of the LURBME modeling process. Regional PM2:5 was derived by subtracting the near-source PM2:5concentration from the total PM2:5concentrations from the LURBME model, thereby
capturing spatial variation in PM2:5concentrations between
mon-itoring stations.
Finally, where there were statistically significant positive associations observed, potential effect modification by gender, education (<high school, high school, >high school), and smok-ing status (never cigarettes, pipes, or cigars; current cigarette smoker only; former cigarette smoker only) was assessed on a multiplicative scale. Two-sided p-values were calculated accord-ing to the likelihood ratio statistic to compare models with and without multiplicative interaction terms between air pollutants and the potential modifiers. The proportional hazards assumption was tested by including interaction terms between ambient air
pollution and follow-up time in the multivariate proportional haz-ards models. A p-value <0:05 was used to define statistical sig-nificance throughout this work.
SAS (version 9.2; SAS Institute Inc.) was used to conduct all analyses. Ethics approval for analysis was obtained from the Ottawa Hospital Research Ethics Board.
Results
From 1982 through 2004 there were a total of 743,543 (62.8%) participants who were alive and 438,123 (37.0%) who had died. Participants were excluded from analysis because of missing or invalid residence information (n = 385,422) or selected base-line covariate data (n = 130,119) (Jerrett et al. 2016;Pope et al. 2015; Turner et al. 2016) or having a prevalent cancer (except nonmelanoma skin cancer) at enrollment (n = 45,998). Follow-up was censored in September 1988 for 2,921 (0.2%) of participants who had insufficient information to link to the NDI. The present analysis is based on 623,048 CPS-II participants among whom 43,320 nonlung cancer deaths were observed during 11,936,799 person-years of follow-up. Follow-up ranged from 0.01 y to 22.5 y with a mean (SD) of 19.2 (5.6) y.
Mean (SD) PM2:5, NO2, and O3concentrations at the participant
residence at enrollment were 12:6 ð2:8Þ lg=m3, 11:6 ð5:1Þ ppb, and
38:2 ð4:0Þ ppb, respectively (Table 1). Correlations between these air pollutants ranged from a weak inverse correlation between NO2 and O3 (r = − 0:09) to a moderate positive correlation
between PM2:5and NO2(r = 0:40) (see Table S1).
Participant characteristics are presented inTable 2and Table S2. The majority of participants were 40 y old to 69 y old at enrollment, 94.5% of participants were white, 55.3% were female, and 57.4% had a greater than high school education. A total of 44.7% of study participants were never smokers.
There was little variation in ambient air pollution concentra-tions by participant characteristics, although somewhat higher PM2:5 and NO2 concentrations were observed in the younger and
older age groups and among participants who were black or“other” race/ethnicity (Table 2). O3 concentrations were slightly higher in
older participants, in those with a low BMI (<18:5 kg=m2), and
among never smokers.
The results from single-pollutant models per each fifth per-centile–mean increment are presented in Table S3 according to the minimally adjusted model and in Table 3 according to the fully adjusted model. In the minimally adjusted model, there were several significant positive associations of PM2:5 and
colo-rectal, breast, cervical, and bladder cancer mortality and of NO2
and stomach, colorectal, pancreatic, breast, and bladder cancer mortality as well as some significant inverse associations largely with O3. Fewer significant findings were observed in the fully
adjusted models, with significant positive associations of PM2:5
and mortality from kidney [HR per 4:4 lg=m3= 1:14 (95% CI:
1.03, 1.27)] and bladder [HR = 1:13 (95% CI: 1.03, 1.23)] cancer observed (Table 3) [or equivalently per each 10lg=m3, HRs =
1:36 (95% CI: 1.06, 1.73) and 1.32 (95% CI: 1.07, 1.61), respec-tively]. There was a positive HR for colorectal cancer mortality [HR = 1:04 (95% CI: 1.00, 1.08)] of borderline significance (p = 0:08). The largest HR was observed for mortality from cervi-cal cancer [HR = 1:34 (95% CI: 0.98, 1.83)], although this result was no longer significant and was based on a small number of deaths (n = 115). For NO2, there was a weak positive association
with mortality from colorectal cancer [HR per 6:5 ppb = 1:06 (95% CI: 1.02, 1.10)] [or equivalently HR = 1:09 (95% CI: 1.03, 1.16) per 10 ppb]. For O3, HRs were generally <1, with
statisti-cally significant inverse associations with mortality from stomach cancer [HR per 6:9 ppb = 0:90 (95% CI: 0.81, 0.99)], pancreatic
Table 2.Distribution of selected participant characteristics at enrollment (1982) and air pollution concentrations, CPS-II cohort, United States (n = 623,048). Characteristic % PM2:5(lg=m3) Mean (SD) NO2(ppb) Mean (SD) O3(ppb) Mean (SD) Age (years) <40 4.6 12.8 (2.9) 12.4 (5.7) 38.0 (3.9) 40–49 21.2 12.5 (2.8) 11.4 (5.1) 38.0 (3.8) 50–59 37.1 12.6 (2.8) 11.5 (5.0) 38.1 (3.9) 60–69 26.0 12.6 (2.9) 11.6 (5.1) 38.3 (4.1) 70–79 9.4 12.6 (2.9) 11.8 (5.0) 38.4 (4.2) ≥80 1.7 12.7 (2.9) 12.2 (5.1) 38.3 (4.2) Race/ethnicity White 94.5 12.5 (2.8) 11.5 (5.0) 38.2 (3.9) Black 3.9 13.7 (2.5) 13.3 (5.2) 38.1 (3.3) Other 1.6 12.9 (4.3) 15.6 (6.4) 38.3 (5.8) Gender Male 44.7 12.5 (2.8) 11.5 (5.1) 38.2 (4.0) Female 55.3 12.6 (2.8) 11.7 (5.1) 38.2 (3.9) Education <High school 11.6 12.8 (2.8) 11.6 (5.3) 38.1 (3.8) High school 31.1 12.6 (2.7) 11.4 (5.1) 38.1 (3.7) >High school 57.4 12.5 (2.9) 11.7 (5.0) 38.2 (4.1) Marital status Single 3.3 13.0 (2.8) 13.1 (5.5) 37.5 (3.8) Married 84.8 12.5 (2.8) 11.5 (5.0) 38.2 (3.9) Other 11.9 12.9 (2.9) 12.4 (5.3) 38.1 (4.0) BMI (kg=m2) <18:5 1.7 12.6 (2.9) 11.7 (5.0) 38.5 (4.0) 18.5–24.9 50.3 12.5 (2.9) 11.6 (5.1) 38.2 (4.0) 25–29.9 36.5 12.6 (2.8) 11.5 (5.1) 38.1 (3.9) ≥30 11.5 12.8 (2.8) 11.7 (5.2) 38.1 (3.8) Smoking status Never 44.7 12.6 (2.9) 11.5 (5.1) 38.4 (4.0)
Current cigarette smoker 19.6 12.7 (2.8) 11.8 (5.1) 38.0 (3.8)
Former cigarette smoker 25.6 12.5 (2.9) 11.7 (5.1) 38.0 (4.0)
Ever pipe/cigar 10.2 12.5 (2.8) 11.5 (5.0) 38.0 (3.8)
Cigarettes per day Current cigarette smoker
<15 4.9 12.7 (2.9) 12.0 (5.3) 37.9 (3.8)
15–19 1.5 12.7 (2.8) 11.8 (5.1) 37.9 (3.9)
20–29 7.2 12.6 (2.8) 11.6 (5.0) 38.0 (3.7)
≥30 6.0 12.7 (2.8) 11.7 (5.1) 38.0 (3.8)
Former cigarette smoker
<10 4.9 12.6 (2.9) 11.8 (5.1) 37.9 (4.0)
10–19 5.1 12.5 (2.9) 11.7 (5.1) 38.0 (4.1)
20–29 8.5 12.5 (2.9) 11.6 (5.1) 38.1 (4.0)
≥30 7.0 12.5 (2.9) 11.8 (5.2) 38.0 (4.0)
Duration of smoking (years) Current cigarette smoker
<26 4.5 12.8 (2.8) 11.9 (5.3) 38.0 (3.7)
<26 4.7 12.7 (2.8) 11.7 (5.1) 37.9 (3.7)
26–32 4.7 12.7 (2.8) 11.7 (5.1) 38.0 (3.7)
33–39 5.6 12.6 (2.9) 11.8 (5.1) 38.1 (3.9)
≥40 6.1 12.5 (2.9) 11.6 (5.1) 38.0 (4.1)
Former cigarette smoker
<12 6.7 12.5 (2.8) 11.7 (5.1) 38.0 (4.0)
21–29 5.5 12.5 (2.9) 11.8 (5.1) 37.9 (4.0)
12–20 7.3 12.5 (2.9) 11.8 (5.2) 38.0 (4.0)
≥30
Age started smoking <18 y old
Current cigarette smoker 7.9 12.7 (2.8) 12.0 (5.3) 37.9 (3.8)
Former cigarette smoker 9.8 12.5 (2.8) 11.9 (5.3) 37.9 (4.0)
Passive smoke exposure (hours)
0 35.5 12.5 (2.9) 11.5 (5.1) 38.4 (4.2) >0–3 33.8 12.5 (2.8) 11.6 (5.1) 38.0 (3.9) >3 30.8 12.7 (2.8) 11.8 (5.2) 38.0 (3.7) Beer consumption Yes 24.9 12.6 (2.9) 11.8 (5.2) 38.3 (4.1) No 16.3 12.5 (2.8) 11.6 (5.0) 37.9 (3.8) Missing 58.8 12.6 (2.8) 11.6 (5.1) 38.1 (3.9) Wine consumption Yes 22.5 12.6 (2.8) 11.5 (5.1) 38.4 (3.9) No 18.3 12.4 (3.0) 12.3 (5.2) 37.7 (4.3) Missing 59.3 12.6 (2.8) 11.5 (5.0) 38.2 (3.8)
cancer [HR = 0:91 (95% CI: 0.86, 0.97)], and leukemia [HR = 0:92 (95% CI: 0.85, 0.99)].
The results were similar with further adjustment for physical exercise, aspirin use, and red meat intake for all cancer sites as well as with additional reproductive and hormonal variables for female reproductive cancers (see Tables S4 and S5). The results for female reproductive cancers were also similar upon restriction
to postmenopausal women only. The results were similar in two-pollutant models including PM2:5and NO2(see Table S6) and in
three-pollutant models with O3(see Table S7).
Upon decomposition of total PM2:5, there were statistically significant positive associations of both bladder and kidney can-cer mortality per fifth percentile–mean increment with regional PM2:5[HRs per 4:5 lg=m3= 1:14 (95% CI: 1.04, 1.25) and 1.15
Table 2.(Continued.) Characteristic % PM2:5(lg=m3) Mean (SD) NO2(ppb) Mean (SD) O3(ppb) Mean (SD) Liquor consumption Yes 23.6 12.7 (2.9) 11.7 (5.2) 38.4 (4.0) No 19.7 12.3 (2.9) 11.6 (5.0) 37.8 (4.0) Missing 56.8 12.6 (2.8) 11.6 (5.1) 38.2 (3.9) Vegetable/fruit/fiber consumption 1st quintile 17.2 12.8 (2.8) 11.6 (5.2) 38.1 (3.7) 2nd quintile 18.8 12.6 (2.8) 11.6 (5.1) 38.1 (3.8) 3rd quintile 18.1 12.5 (2.8) 11.6 (5.1) 38.1 (3.9) 4th quintile 18.9 12.4 (2.9) 11.6 (5.0) 38.1 (4.0) 5th quintile 18.9 12.4 (2.9) 11.6 (5.0) 38.2 (4.2) Fat consumption 1st quintile 17.3 12.8 (2.9) 12.2 (5.3) 38.1 (4.0) 2nd quintile 18.3 12.6 (2.9) 11.8 (5.2) 38.0 (4.0) 3rd quintile 18.6 12.5 (2.8) 11.6 (5.1) 38.1 (4.0) 4th quintile 18.8 12.5 (2.8) 11.4 (5.0) 38.2 (3.9) 5th quintile 18.8 12.5 (2.8) 11.0 (4.8) 38.4 (3.8)
Missing/bad nutrition data 8.2 12.7 (2.9) 11.8 (5.2) 38.3 (4.0)
Industrial exposures
Yes 19.7 12.5 (2.9) 11.5 (5.1) 38.1 (4.0)
No 80.3 12.6 (2.8) 11.6 (5.1) 38.2 (3.9)
Occupational dirtiness index
Level 0 49.9 12.6 (2.8) 11.8 (5.1) 38.1 (4.0) Level 1 13.7 12.5 (2.8) 11.4 (5.1) 38.2 (3.9) Level 2 11.6 12.5 (2.9) 11.5 (4.9) 38.3 (4.0) Level 3 4.8 12.5 (2.9) 11.6 (5.1) 38.2 (4.0) Level 4 6.2 12.4 (2.7) 10.5 (5.0) 38.2 (3.8) Level 5 4.3 12.5 (2.8) 11.4 (5.1) 38.2 (4.0) Level 6 1.1 12.9 (2.9) 11.4 (4.8) 38.2 (4.0) Missing 8.4 12.8 (2.9) 12.1 (5.3) 38.0 (3.9)
Median household income (thousands, USD)
<25 25.0 12.2 (2.8) 9.7 (4.2) 39.0 (3.3)
25–31 24.9 12.5 (2.8) 10.9 (4.4) 38.6 (3.8)
32–40 25.1 12.8 (3.0) 12.1 (4.9) 37.9 (4.2)
≥41 25.0 12.9 (2.8) 13.8 (5.8) 37.0 (4.2)
African American residents (%)
<0:7 25.0 11.6 (2.7) 10.0 (5.1) 37.7 (3.9) 0.7–2.4 25.0 12.3 (3.0) 12.4 (5.0) 38.1 (4.5) 2.5–8.8 24.5 13.0 (2.9) 12.5 (5.1) 38.5 (4.1) ≥8:9 25.5 13.4 (2.3) 11.6 (4.8) 38.3 (3.2) Hispanic residents (%) <0:8 25.0 13.2 (2.3) 9.1 (3.6) 38.5 (2.0) 0.8–1.7 25.0 12.7 (2.2) 10.4 (3.7) 37.9 (2.7) 1.8–5.8 24.6 11.9 (2.5) 12.5 (5.3) 37.1 (4.4) ≥5:9 25.4 12.5 (3.9) 14.5 (5.7) 39.1 (5.4) Post-secondary education (%) <28:2 25.0 13.1 (2.6) 10.1 (4.8) 38.8 (3.1) 28.2–37.0 25.0 12.5 (2.8) 11.3 (5.1) 38.0 (3.8) 37.1–48.1 25.0 12.3 (2.9) 12.3 (5.3) 38.1 (4.2) ≥48:2 25.0 12.5 (3.0) 12.8 (4.8) 37.7 (4.5) Unemployment (%) <3:6 25.0 12.7 (2.6) 11.8 (4.7) 37.2 (3.7) 3.6–4.9 25.0 12.5 (2.8) 12.1 (5.3) 38.1 (3.9) 5.0–6.6 25.0 12.3 (2.9) 11.2 (5.0) 38.7 (4.1) ≥6:7 25.0 12.8 (3.0) 11.3 (5.3) 38.7 (3.9) Poverty (%) <4:6 25.0 12.8 (2.4) 13.0 (5.3) 36.9 (3.5) 4.6–8.5 25.0 12.6 (3.0) 12.1 (5.0) 38.0 (4.4) 8.6–13.9 25.0 12.3 (2.9) 10.7 (4.7) 38.6 (3.9) ≥14:0 25.0 12.6 (3.0) 10.6 (4.9) 39.0 (3.7)
Note: BMI, body mass index; CPS-II, Cancer Prevention Study II; NO2, nitrogen dioxide; O3, ozone; PM2:5, particulate matter with aerodynamic diameter <2:5 lm; USD, U.S. dollar.
(95% CI: 1.02, 1.29), respectively] of similar magnitude per unit increment to those of total PM2:5but not with near-source PM2:5
[HRs per 1:6 lg=m3= 1:02 (95% CI: 0.92, 1.13) and 1.05 (95%
CI: 0.92, 1.13), respectively] (see Table S8). There were also sig-nificant positive associations of near-source PM2:5and mortality
from cancer of the stomach [HR per 1:6 lg=m3= 1:13 (95% CI:
1.02, 1.26)] and colorectum [HR = 1:09 (95% CI: 1.04, 1.15)] but not with regional PM2:5 [HRs per 4:5 lg=m3= 0:97 (95% CI:
0.88, 1.06) and 1.02 (95% CI: 0.97, 1.07), respectively]. There was also a positive HR for pancreatic cancer mortality with near-source PM2:5[HR = 1:06 (95% CI: 1.00, 1.13)] of borderline sig-nificance (p = 0:06), but not with regional PM2:5 [HR = 0:96 (95% CI: 0.90, 1.01)].
In stratified analyses of associations of PM2:5with kidney and
bladder cancer mortality and of NO2with colorectal cancer
mor-tality, associations of PM2:5with kidney and bladder cancer mor-tality appeared to be limited to men [HR = 1:23 (95% CI: 1.08, 1.40) and HR = 1:16 (95% CI: 1.05, 1.29), respectively], with lit-tle or no evidence of associations in women [HR = 1:00 (95% CI: 0.83, 1.20) and HR = 1:03 (95% CI: 0.86, 1.23), respectively], although differences between men and women were not signifi-cant (interaction p-values of 0.13 and 0.25, respectively) (see Table S9). There was no clear evidence of effect modification according to categories of smoking status (interaction p-values ≥0:30). Associations of NO2 with colorectal cancer mortality
were somewhat stronger among those with a <high school or high school level of education [HR = 1:12 (95% CI: 1.01, 1.24)
and HR = 1:15 (95% CI: 1.07, 1.23), respectively] compared with a >high school level of education [HR = 0:99 (95% CI: 0.94, 1.05); p for interaction = 0:03]. There was no evidence that the proportional hazards assumption was violated for associations at these sites (p > 0:05) (data not shown).
Discussion
Ambient air pollution was not associated with death from most nonlung cancers in our large prospective study population. However, there were statistically significant positive associations between PM2:5and death from bladder and kidney cancer, rang-ing from 13–14% increases in risk per each fifth percentile–mean increment (4:4 lg=m3). For NO2, there was a statistically signi
fi-cant positive association with colorectal cancer mortality of 6% per 6:5 ppb. The results were similar in two-pollutant models including both PM2:5and NO2as well as in three-pollutant
mod-els with O3. The magnitudes of the associations here were
some-what stronger than, although compatible with, those of PM2:5and
lung cancer mortality observed in previous work [9% (95% CI: 3, 16%) per 10lg=m3 or equivalently, 4% (95% CI: 1, 7%) per
4:4 lg=m3] (Turner et al. 2016).
A small but growing body of literature has examined associa-tions between ambient air pollution and nonlung cancer risk; however, the evidence for such associations is limited. For blad-der cancer, a Spanish hospital-based case–control study including 1,219 incident cases and 1,271 controls reported that living
Table 3.Adjusted HRs (95% CIs)afor nonlung cancer mortality per each fifth percentile–mean increment in air pollutant concentrations, single-pollutant mod-els, CPS-II cohort, United States (1982–2004) (n = 623,048).
Cancer cause of death ICD 9; ICD10 Number of deaths
PM2:5 NO2 O3
Per 4:4 lg=m3 Per 6:5 ppb Per 6:9 ppb
HR 95% CI HR 95% CI HR 95% CI
Tongue and mouth 141, 143–145; C01–C06 262 1.03 0.84, 1.26 0.98 0.80, 1.19 0.93 0.74, 1.18
Salivary gland 142; C07–C08 58 0.93 0.61, 1.44 1.00 0.67, 1.48 1.44 0.91, 2.30 Pharynx 146–149; C09–C14 243 0.88 0.70, 1.10 0.86 0.69, 1.08 1.11 0.86, 1.43 Esophagus 150; C15 1,180 1.02 0.93, 1.13 1.02 0.92, 1.12 0.97 0.87, 1.08 Stomach 151; C16 1,340 1.00 0.91, 1.09 1.05 0.96, 1.15 0.90 0.81, 0.99 Colorectal 153–154; C18–C21 6,475 1.04 1.00, 1.08 1.06 1.02, 1.10 0.95 0.91, 1.00 Liver 155; C22 1,003 1.05 0.94, 1.16 1.03 0.93, 1.14 0.98 0.87, 1.10 Gallbladder 156; C23–C24 403 1.03 0.87, 1.22 1.00 0.85, 1.17 0.95 0.78, 1.14 Pancreas 157; C25 3,812 0.98 0.92, 1.03 1.04 0.98, 1.09 0.91 0.86, 0.97 Nose 160; C30–C31 46 0.65 0.37, 1.16 0.82 0.47, 1.42 1.18 0.69, 2.04 Larynx 161; C32 223 1.04 0.84, 1.30 1.07 0.86, 1.32 0.96 0.74, 1.24 Bone 170; C40–C41 81 0.81 0.55, 1.20 0.97 0.68, 1.38 0.95 0.63, 1.43 Connective tissue 171; C47, C49 377 1.06 0.89, 1.26 1.04 0.88, 1.22 0.89 0.74, 1.08 Melanoma 172; C43 862 1.05 0.94, 1.17 0.97 0.87, 1.08 1.02 0.90, 1.15 Other skin 173; C44, C46 195 1.10 0.88, 1.38 0.90 0.72, 1.14 0.97 0.75, 1.24 Breast (female)b 174–175; C50 3,844 1.03 0.97, 1.08 1.03 0.97, 1.08 0.99 0.93, 1.05 Uterusb,c 179, 182; C54–C55 611 1.04 0.91, 1.19 1.07 0.94, 1.22 0.98 0.84, 1.14 Cervixb,c 180; C53 115 1.34 0.98, 1.83 1.23 0.91, 1.66 1.01 0.69, 1.48 Ovaryb,c,d 183; C56 987 1.03 0.93, 1.15 1.03 0.93, 1.14 1.01 0.90, 1.14 Prostateb 185; C61 1,068 0.96 0.86, 1.06 1.01 0.92, 1.12 1.03 0.92, 1.15 Bladder 188; C67 1,324 1.13 1.03, 1.23 1.03 0.94, 1.12 1.03 0.93, 1.14 Kidney 189; C64–C66, C68 927 1.14 1.03, 1.27 0.99 0.89, 1.10 0.97 0.86, 1.09 Eye 190; C69 26 1.30 0.66, 2.53 1.14 0.57, 2.28 0.76 0.38, 1.53 Brain 191; C71 1,591 1.04 0.96, 1.14 0.99 0.92, 1.08 0.98 0.89, 1.08 Thyroid 193; C73 41 0.62 0.34, 1.12 1.24 0.75, 2.05 0.96 0.54, 1.71 Non-Hodgkin’s lymphoma 200, 202; C82–C85 2,840 1.00 0.94, 1.07 1.05 0.99, 1.12 0.98 0.92, 1.05 Hodgkin’s disease 201; C81 125 1.12 0.82, 1.54 1.16 0.87, 1.53 1.08 0.76, 1.53 Multiple myeloma 203; C88, C90 1,421 0.97 0.89, 1.07 1.00 0.92, 1.09 0.99 0.90, 1.09 Leukemia 204–208; C91–C95 2,584 1.01 0.94, 1.07 1.00 0.94, 1.07 0.92 0.85, 0.99
Note: CI, confidence interval; CPS-II, Cancer Prevention Study II; HR, hazard ratio; ICD-9, The International Classification of Diseases, 9th Revision; ICD-10, International Statistical Classification of Diseases and Related Health Problems, 10th Revision; NO2, nitrogen dioxide; O3, ozone; PM2:5, particulate matter with aerodynamic diameter <2:5 lm.
aAge, race/ethnicity, gender stratified and adjusted for baseline values of education; marital status; body mass index; body mass index squared; smoking status; cigarettes per day;
ciga-rettes per day squared; duration of smoking; duration of smoking squared; age started smoking; passive smoking, vegetable/fruit/fiber consumption; fat consumption; beer, wine, liquor consumption; industrial exposures; occupation dirtiness index; and 1990 ecological covariates.
bAs above but not gender stratified. Analysis limited to 344,593 women for analysis of breast cancer mortality, 235,637 women for analysis of uterine or cervical cancer mortality, and
228,494 women for analysis of ovarian cancer mortality. Analysis limited to 278,455 men for analysis of prostate cancer mortality.
c
Women reporting a previous hysterectomy or an artificial menopause excluded here (n = 108,956).
d
>40 y in a city of >100,000 inhabitants was associated with a significantly higher risk of the disease [odds ratio ðORÞ = 1:30 (95% CI: 1.04, 1.63)] (Castaño-Vinyals et al. 2008). In a death certificate–based case–control study in Taiwan, including 680 bladder cancer deaths and 680 matched noncancer or nongeni-tourinary death controls, there were significant positive trends with increasing tertiles of particulate matter with aerodynamic di-ameter <10lm (PM10), NO2, and sulfur dioxide (SO2), but not
with carbon monoxide (CO) or O3 concentrations (Liu et al.
2009). There was a positive, nonsignificant association between nitrogen oxides (NOx) concentrations and bladder cancer
inci-dence (n = 221) [inciinci-dence rate ratio (IRR) per 100 lg= m3= 1:32 (95% CI: 0.80, 2.19)] in an analysis of 54,304
partici-pants in the Danish Diet Cancer and Health cohort ( Raaschou-Nielsen et al. 2011). In a retrospective cohort study of 85,559 individuals in Malagrotta (Rome, Italy), there was a positive association between hydrogen sulfide (H2S) concentrations from
a municipal waste landfill and bladder cancer mortality in women [HR per 0:043 lg=m3= 1:35 (95% CI: 1.00, 1.82), n = 12], but not in men [HR = 0:88 (95% CI: 0.51, 1.52), n = 61] (Ancona et al. 2015). Taken together, the results from our study and those from most previous studies are generally consistent with the recent IARC evaluation noting a positive association in studies of outdoor air pollution and bladder cancer risk (IARC 2013).
There was no association [HR per 10lg=m3= 0:98 (95% CI:
0.58, 1.64)] between PM2:5and urinary cancer mortality (includ-ing 155 bladder and kidney cancer deaths combined) in a cohort of 66,820 elderly Hong Kong residents (Wong et al. 2016). The Danish Diet Cancer and Health cohort reported a positive, although imprecise, association of NOxwith kidney cancer incidence [IRR =
1:73 (95% CI: 0.89, 3.73) per 100 lg=m3 (Raaschou-Nielsen et al. 2011). A total of 95 kidney cancer cases were observed in that study.
Few studies of colorectal cancer have been reported to date. Although our study showed a significant positive association between NO2and death from colorectal cancer and a borderline
association with PM2:5, a Hong Kong cohort reported no associa-tion [HR per 10lg=m3= 1:01 (95% CI: 0.79, 1.30)] between
PM2:5 concentrations and mortality from cancers of the lower digestive tract (n = 719) (Wong et al. 2016). There were nonsigni-ficant inverse associations in men and women for PM10
concentra-tions from a waste incinerator and colorectal cancer mortality (n = 149 deaths in men and 95 deaths in women) in Malagrotta (Ancona et al. 2015). There were also nonsignificant inverse associ-ations for NOxconcentrations and both colon and rectal cancer
inci-dence in Denmark (n = 414 and 246 cases, respectively) ( Raaschou-Nielsen et al. 2011). The number of included colorectal cancer deaths (>6,000) in CPS-II here is substantially larger than the num-bers of cases/deaths in previous studies.
When PM2:5 concentrations were decomposed into near-source and regional components, there were stronger associations for near-source PM2:5with colorectal (and stomach) cancer mor-tality, supporting similar findings for NO2, and for regional
PM2:5 with both bladder and kidney cancer mortality. Little is
known regarding the role of different air pollution sources or components in cancer, including at sites other than the lung. We have not specifically examined what PM2:5sources were further related to this decomposition.
Studies of occupational exposure to diesel engine exhaust and polycyclic aromatic hydrocarbons (PAHs), which are formed dur-ing incomplete combustion processes, have suggested positive associations with both bladder and kidney cancer (Brown et al. 2012;IARC 2005;Siemiatycki et al. 2004). Recent population-based case–control studies of men in Canada reported positive associations between any exposure to high concentrations of
occupational diesel exhaust and both bladder [OR = 1:64 (95% CI: 0.87, 3.08), n = 658 cases and 1,360 controls] and rectal [OR = 1:98 (95% CI: 1.09, 3.60), n = 840 cases and 1,360 con-trols] cancer incidence, which increased among those with >10 years of exposure (Kachuri et al. 2016; Latifovic et al. 2015). Studies of workers in dusty occupations (e.g., mineral dust, wood dust), as well as in steel and iron processing, have also noted positive associations with colorectal and stomach can-cer (Kreuzer et al. 2012; Oddone et al. 2014; Raj et al. 2003; Santibañez et al. 2012).
The largest HR was for PM2:5in relation to death from
cervi-cal cancer, although thefindings were based on only 115 deaths and were not statistically significant. The positive association with NO2 was weaker. In the Danish Diet Cancer and Health
study, the strongest association was between NOx and cervical
cancer incidence [i.e., IRR = 2:45 (95% CI: 1.01, 5.93) per 100lg=m3], but it was based on only 35 cases ( Raaschou-Nielsen et al. 2011). In both studies, there were no data on human papillomavirus (HPV) infection (or on other potentially relevant infections for cancer mortality at other sites, e.g., Helicobacter pylori for stomach cancer or hepatitis B or C for liver cancer), and confounding cannot be ruled out. There was also no informa-tion on access to or compliance with cervical cancer screening programs, which may differ in areas with differing levels of ambi-ent air pollution. However, we adjusted our models for a range of area-level socioecomonic covariates and screening rates in a sub-set of CPS-II participants for both breast (>90%) and colorectal (>65%) cancer were high (Patel et al. 2003;Stevens et al. 2011). A recent cross-sectional study of women from a clinical trial of cervical disease diagnostic techniques in Texas reported a posi-tive association of cervical dysplasia with residential census-tract level estimates of ambient benzene, diesel particulate matter, and PAH concentrations (Scheurer et al. 2014).
Although we found no significant associations with death from breast cancer based on fully adjusted models, other studies reported positive associations between ambient air pollution and breast cancer incidence (Crouse et al. 2010;Mordukhovich et al. 2016;Reding et al. 2015). Crouse et al. (2010) reported a positive association between NO2 concentrations and postmenopausal
breast cancer incidence [OR per 5 ppb = 1:31 (95% CI: 1.00, 1.71)] in a hospital-based case–control study including 383 case and 416 control participants. The prospective U.S. Sister Study reported no association between PM10, PM2:5, or NO2 concentrations and
incident breast cancer overall in an analysis of 47,591 partici-pants including 1,749 breast cancer cases, but a positive associa-tion was reported between NO2 and estrogen receptorðERÞ + =
progesterone receptorðPRÞ + disease [HR per 5:8 ppb = 1:10 (95% CI: 1.02, 1.19)] (Reding et al. 2015). In our mortality-based study, no information on ER or PR status was available.
There was no positive association of any ambient air pollutant and total leukemia mortality in the present study. There was a positive association of NO2 concentrations at the residence with
incident adult acute myeloid leukemia [OR per 10 mg=m3= 1:31
(95% CI: 1.02, 1.65), n = 531] but not with other leukemia sub-types in a Danish case-control study (Raaschou-Nielsen et al. 2016). There was no positive association of PM2:5with total incident
leu-kemia or with chronic lymphocytic leuleu-kemia in a Canadian case– control study of 1,064 total case and 5,039 control participants (Winters et al. 2015). There was no information on leukemia sub-type in CPS-II.
There was no association of any ambient air pollutant with total brain cancer mortality in this analysis, which included 1,591 brain cancer deaths. The Danish Diet Cancer and Health cohort reported a positive association of NOxwith incident brain tumor risk [IRR per
100lg=m3NO
et al. 2011), although there were few brain tumor cases (n = 95). A subsequent national case–control study in Denmark with a larger number of incident brain tumor cases (n = 4,183) reported a signifi-cant positive association of NOxconcentrations ≥100 lg=m3 with
nongliomas [OR = 2:30 (95% CI: 1.15, 4.59)] but not with gliomas [OR = 0:89 (95% CI: 0.44, 1.77)] (Poulsen et al. 2016). There was no information on tumor histology or cranial location in CPS-II.
In the present study, there were no clear positive, and some cases there were significant inverse, associations observed with O3 in both single- and multipollutant models possibly owing to
broader spatial patterns in ambient air pollution concentrations, to negative correlations with other air pollutants, and to the larger spatial scale of O3 concentrations, which were unable to capture
fine-scale variation and scavenging effects in urban areas (Williams et al. 2014). O3 is thought to increase DNA damage (U.S. EPA
2013), which plays a role in several types of cancer. However, in previous studies of the CPS-II cohort, O3was not associated with
lung cancer death (Jerrett et al. 2013;Krewski et al. 2009; Pope et al. 2002;Turner et al. 2016). A positive association between am-bient O3 and incident male lung cancer was reported in the
Adventist Health Study on Smog (AHSMOG), although few lung cancers were observed (n = 16) (Beeson et al. 1998).
Strengths of this study include a large-scale, well-established cohort design with large numbers of nonlung cancer deaths observed at many cancer sites. Air pollution exposures were esti-mated at each participant’s residence using national-level expo-sure surfaces that have previously been used to examine mortality associations in CPS-II (Jerrett et al. 2016;Pope et al. 2015;Turner et al. 2014;2016). Detailed data were collected at enrollment on a variety of cancer risk factors including cigarette smoking, occupation, diet, and various hormonal and reproduc-tive factors.
The main limitation of this study is the use of cancer mortality rather than cancer incidence end points, with inferences of associ-ations of ambient air pollution here reflecting both disease inci-dence and survival following diagnosis. Because lung cancer is rapidly fatal, with 5-y survival rates ranging from ∼ 13–18% for the periods 1987–1989 and 2005–2011 respectively, the use of mortality data reasonably approximates disease incidence (American Cancer Society 2016). Other rapidly fatal cancer sites include the pancreas (5-year survival = 4–8%), the liver and intra-hepatic bile duct (5–18%), the esophagus (10–20%), the stomach (20–30%), and the brain and other nervous system sites (29–35%) (American Cancer Society 2016). In contrast, survival is greater for cancer at other sites, including the urinary bladder, the kidney and renal pelvis, and the colorectum, of interest here (5-y survival ranging from 57–79%), with survival from disease playing an increasing role in associations with ambient air pollution observed here (American Cancer Society 2016).
There is little research on whether ambient air pollution may be related to cancer progression or survival. One recent study of >350,000 California lung cancer patients reported that higher residential ambient air pollution concentrations (NO2, PM2:5,
PM10) were associated with poorer survival, particularly among
patients diagnosed in earlier disease states (i.e., with localized disease) (Eckel et al. 2016). Mean ambient air pollution concen-trations were also somewhat higher among those diagnosed with more advanced disease and among those with an unknown stage at diagnosis (i.e., either patients who were dying before stage in-formation was obtained or who had limited workup performed), possibly reflecting differences in access to medical care, which may vary by levels of ambient air pollution. Little is known regarding possible impacts at other cancer sites, although reduced breast cancer survival was associated with higher PM2:5 and
PM10 concentrations in another study (Hu et al. 2013). Further
studies of nonlung cancer incidence are needed to disentangle the observed associations with ambient air pollution.
Covariate data were only available at enrollment and were not updated over the follow-up period in CPS-II. It is unlikely that CPS-II participants would begin smoking cigarettes over the follow-up time, given the mean age of >55 years at enrollment, although participants may increasingly become former smokers. There were also limited data on occupational exposure history. Participant residence data were also only available at enrollment. Changes in participant residence after enrollment as well as changes in coding of the underlying cause of death over the follow-up period would likely be nondifferential and would result in attenuation of the magnitude of the associations observed. A Canadian study observed little impact of accounting for residen-tial mobility on PM2:5 or O3 mortality associations; however,
associations with more spatially resolved NO2 strengthened
somewhat (Crouse et al. 2015).
There is also a lack of historical ambient air pollution data, although correlations between PM2:5 and O3 concentrations
assigned to CPS-II participants over recent decades were moder-ately strong, ranging from approximmoder-ately 0.6 to >0:8, indicating that the use of more recent ambient air pollution estimates may be reflective of longer-term exposure patterns (Krewski et al. 2009;Pope et al. 2002;Turner et al. 2016). The rank ordering of U.S. cities was also similar over time in the context of generally declining ambient air pollution concentrations. The use of recent ambient air pollution estimates may result in somewhat inflated HRs because increments of recent concentrations represent greater contrasts of historically higher concentrations (Krewski et al. 2009;Pope et al. 2002;Turner et al. 2016). Little is known regarding potential latency periods for cancer development in relation with ambient air pollution concentrations, which may also differ from those of lung cancer.
Correlations among pollutants were generally weak. Ambient air pollution concentrations were estimated using different approaches at different time periods and different geographic units of scale, possibly complicating interpretation of the correlation structure among pollutants. The LURBME model outperformed a range of other geostatistical and remote sensing PM2:5 models in the CPS-II (Jerrett et al. 2016). Similar positive cardiorespiratory mortality–O3 associations were observed in recent work with O3
concentrations estimated at either 12 km × 12 km or 36 km × 36 km scales in the Eastern United States (Turner et al. 2016).
Owing to multiple testing and to the large number of cancer sites evaluated (n = 29), it is possible that some of the significant associations observed may be due to chance. As such, the results of this study should be replicated in other studies, particularly in studies of cancer incidence. Finally, our findings may not be entirely generalizable because CPS-II participants are of gener-ally higher socioeconomic status and more limited racial/ethnic composition than the broader U.S. population.
Potential mechanisms through which ambient air pollution may be associated with other nonlung cancers remain to be fully elucidated; however, ambient air pollution represents a complex mixture of exposure to a broad range of carcinogenic and mu-tagenic substances, including PAHs and other aromatic hydrocar-bons, benzene, metals, and xenoestrogens, which may be trans-ported and metabolized in the body (Crouse et al. 2010;IARC 2012,2013). Populations exposed to outdoor air pollutants and to diesel engine exhaust have elevated urinary 1-hydroxypyrene and hemoglobin adducts of nitro-PAHs and low-molecular-weight alkenes (Ciarrocca et al. 2014; Duan et al. 2016; IARC 2012, 2013). A recent study of 23,820 participants in Taiwan, including 464 incident hepatocellular carcinoma (HCC) cases, reported a positive association of PM2:5 with HCC incidence, which may
have been mediated by alanine transaminase levels, suggesting that PM2:5exposure may lead to HCC via chronic inflammation
(Pan et al. 2015).
Active cigarette smoking has also been associated with a range of other nonlung cancers, including cancers in various uri-nary and digestive sites such as the bladder, the kidney, and the colorectum, among others (Carter et al. 2015; IARC 2009). However, levels of exposure to PM2:5from ambient air pollution are substantially lower and of differing chemical composition and toxicity compared with those from active cigarette smoking or occupational exposure (Pope et al. 2011).
Patients with a history of diabetes, which has also been linked with ambient air pollution (Eze et al. 2015; Pope et al. 2015), have also been observed to be at increased risk for bladder, kid-ney, and colorectal cancers, although it is unclear whether this is due to shared underlying risk factors (such as obesity) or to other metabolic features of the disease (such as hyperinsulinemia, hyperglycemia, or chronic inflammation) (Campbell et al. 2012; Giovannucci et al. 2010). The results herein were virtually unchanged with further adjustment for prevalent diabetes at enrollment (not shown).
Conclusion
The results from this large prospective study suggest that ambient air pollution was not associated with most nonlung cancer causes of death. Nonetheless, observed associations with mortality from kidney, bladder, and colorectal cancer merit further research, par-ticularly in studies of cancer incidence.
Acknowledgments
The authors thank Y. Shi for programming assistance.
M.C.T. was funded by a Canadian Institutes of Health Research Fellowship. D.K. is the McLaughlin Chair in Risk Science at the University of Ottawa. Health Canada, the Centers for Disease Control and Prevention, grant 200-2010-37394, and the National Institutes of Health, grant 5R01ES019573-04, funded the development of the PM2:5 exposure model. The American Cancer Society funded the creation, maintenance, and follow-up of the Cancer Prevention Study II cohort.
References
American Cancer Society. 2016. Cancer Facts & Figures 2016. Atlanta, GA: American Cancer Society.
Ancona C, Badaloni C, Mataloni F, Bolignano A, Bucci S, Cesaroni G, et al. 2015. Mortality and morbidity in a population exposed to multiple sources of air pol-lution: a retrospective cohort study using air dispersion models. Environ Res 137:467–474, PMID:25701728,https://doi.org/10.1016/j.envres.2014.10.036. Beckerman BS, Jerrett M, Serre M, Martin RV, Lee SJ, van Donkelaar A, et al.
2013. A hybrid approach to estimating national scale spatiotemporal variability of PM2.5in the contiguous United States. Environ Sci Technol 47(13):7233–7241,
PMID:23701364,https://doi.org/10.1021/es400039u.
Beeson WL, Abbey DE, Knutsen SF. 1998. Long-term concentrations of ambient air pollutants and incident lung cancer in California adults: results from the AHSMOG study. Adventist Health Study on Smog. Environ Health Perspect 106(12):813–822, PMID:9831542.
Brook RD, Rajagopalan S, Pope CA III, Brook JR, Bhatnagar A, Diez-Roux AV, et al. 2010. Particulate matter air pollution and cardiovascular disease: an update to the Scientific Statement from the American Heart Association. Circulation 121(21):2331– 2378, PMID:20458016,https://doi.org/10.1161/CIR.0b013e3181dbece1.
Brown T, Slack R, Rushton L. British Occupational Cancer Burden Study Group, 2012. Occupational cancer in Britain. Urinary tract cancers: bladder and kid-ney. Br J Cancer 107(Suppl 1):S76–S84, PMID:22710682,https://doi.org/10.1038/ bjc.2012.121.
Calle E, Terrell D. 1993. Utility of the National Death Index for ascertainment of mortal-ity among Cancer Prevention Study II participants. Am J Epidemiol 137(2):235–241, PMID:8452128,https://doi.org/10.1093/oxfordjournals.aje.a116664.
Campbell PT, Newton CC, Patel AV, Jacobs EJ, Gapstur SM. 2012. Diabetes and cause-specific mortality in a prospective cohort of one million U.S. adults. Diabetes Care 35(9):1835–1844, PMID:22699290,https://doi.org/10.2337/dc12-0002. Carter BD, Abnet CC, Feskanich D, Freedman ND, Hartge P, Lewis CE, et al. 2015.
Smoking and mortality–beyond established causes. N Engl J Med 372(7):631– 640, PMID:25671255,https://doi.org/10.1056/NEJMsa1407211.
Castaño-Vinyals G, Cantor KP, Tardon A, Garcia-Closas R, Serra C, Carrato A, et al. 2008. Air pollution and risk of urinary bladder cancer in a case-control study in Spain. Occup Environ Med 65(1):56–60, PMID:17634245,https://doi.org/10.1136/ oem.2007.034348.
Ciarrocca M, Rosati MV, Tomei F, Capozzella A, Andreozzi G, Tomei G, et al. 2014. Is urinary 1-hydroxypyrene a valid biomarker for exposure to air pollution in outdoor workers? A meta-analysis. J Expo Sci Environ Epidemiol 24(1):17–26, PMID:23299300,https://doi.org/10.1038/jes.2012.111.
Crouse DL, Goldberg MS, Ross NA, Chen H, Labrèche F. 2010. Postmenopausal breast cancer is associated with exposure to traffic-related air pollution in Montreal, Canada: a case–control study. Environ Health Perspect 118(11):1578–1583, PMID: 20923746,https://doi.org/10.1289/ehp.1002221.
Crouse DL, Peters PA, Hystad P, Brook JR, van Donkelaar A, Martin RV, et al. 2015. Ambient PM2.5, O3, and NO2exposures and associations with mortality
over 16 years of follow-up in the Canadian Census Health and Environment Cohort (CanCHEC). Environ Health Perspect 123(11):1180–1186, PMID: 26528712,https://doi.org/10.1289/ehp.1409276.
Cui P, Huang Y, Han J, Song F, Chen K. 2015. Ambient particulate matter and lung can-cer incidence and mortality: a meta-analysis of prospective studies. Eur J Public Health 25(2):324–329, PMID:25201901,https://doi.org/10.1093/eurpub/cku145. Duan H, Jia X, Zhai Q, Ma L, Wang S, Huang C, et al. 2016. Long-term exposure to
diesel engine exhaust induces primary DNA damage: a population-based study. Occup Environ Med 73(2):83–90, PMID:26491144,https://doi.org/10.1136/ oemed-2015-102919.
Eckel SP, Cockburn M, Shu YH, Deng H, Lurmann FW, Liu L, et al. 2016. Air pollution affects lung cancer survival. Thorax 71(10):891–898, PMID:27491839,https://doi.org/ 10.1136/thoraxjnl-2015-207927.
Eze IC, Hemkens LG, Bucher HC, Hoffmann B, Schindler C, Kunzli N, et al. 2015. Association between ambient air pollution and diabetes mellitus in Europe and North America: systematic review and meta-analysis. Environ Health Perspect 123(5):381–389, PMID:25625876,https://doi.org/10.1289/ehp.1307823.
Giovannucci E, Harlan DM, Archer MC, Bergenstal RM, Gapstur SM, Habel LA, et al. 2010. Diabetes and cancer: a consensus report. Diabetes Care 33(7):1674–1685, PMID:20587728,https://doi.org/10.2337/dc10-0666.
Hamra GB, Guha N, Cohen A, Laden F, Raaschou-Nielsen O, Samet JM, et al. 2014. Outdoor particulate matter exposure and lung cancer: a systematic review and meta-analysis. Environ Health Perspect 122(9):906–911, PMID: 24911630,https://doi.org/10.1289/ehp.1408092.
Hamra GB, Laden F, Cohen AJ, Raaschou-Nielsen O, Brauer M, Loomis D. 2015. Lung cancer and exposure to nitrogen dioxide and traffic: a systematic review and meta-analysis. Environ Health Perspect 123(11):1107–1112, PMID:25870974,https://doi.org/10.1289/ehp.1408882.
Hu H, Dailey AB, Kan H, Xu X. 2013. The effect of atmospheric particulate matter on sur-vival of breast cancer among US females. Breast Cancer Res Treat 139(1):217–226, PMID:23592372,https://doi.org/10.1007/s10549-013-2527-9.
IARC (International Agency for Research on Cancer). 2005. Some non-heterocyclic polycyclic aromatic hydrocarbons and some related exposures. IARC Monogr Eval Carcinog Risk Hum 92:1–868.https://monographs.iarc.fr/ENG/Monographs/ vol92/mono92.pdf[accessed 18 October 2016].
IARC. 2009. A review of human carcinogens. Part E: Personal habits and indoor combustions. IARC Monogr Eval Carcinog Risk Hum 100E:1–598. http:// monographs.iarc.fr/ENG/Monographs/vol100E/mono100E.pdf[accessed 6 August 2016].
IARC. 2012. Diesel and gasoline engine exhausts and some nitroarenes. IARC Monogr Eval Carcinog Risk Hum 105:1–714. https://monographs.iarc.fr/ENG/ Monographs/vol105/mono105.pdf[accessed 4 June 2016].
IARC. 2013. Outdoor air pollution. IARC Monogr Eval Carcinog Risk Hum 109: 1–454. https://monographs.iarc.fr/ENG/Monographs/vol109/mono109-F01.pdf[accessed 19 March 2016].
Jerrett M, Burnett RT, Beckerman B, Turner MC, Krewski D, Thurston G, et al. 2013. Spatial analysis of air pollution and mortality in California. Am J Respir Crit Care Med 188(5):593–599, PMID: 23805824, https://doi.org/10.1164/rccm. 201303-0609OC.
Jerrett M, Turner MC, Beckerman BS, Pope CA, van Dondelaar A, Martin RV, et al. 2017. Comparing the health effects of ambient particulate matter esti-mated using ground-based versus remote sensing exposure estimates. Environ Health Perspect 125(4):552–559, PMID:27611476, https://doi.org/10. 1289/EHP575.
Kachuri L, Villeneuve PJ, Parent MÉ, Johnson KC, Canadian Cancer Registries Epidemiology Research Group, Harris SA. 2016. Workplace exposure to diesel and
gasoline engine exhausts and the risk of colorectal cancer in Canadian men. Environ Health 15:4, PMID:26762540,https://doi.org/10.1186/s12940-016-0088-1. Kreuzer M, Straif K, Marsh JW, Dufey F, Grosche B, Nosske D, et al. 2012.
Occupational dust and radiation exposure and mortality from stomach cancer among German uranium miners, 1946–2003. Occup Environ Med 69(3):217–223, PMID:22172952,https://doi.org/10.1136/oemed-2011-100051.
Krewski D, Burnett RT, Goldberg MS, Hoover K, Siemiatycki J, Jerrett M, et al. 2000. Reanalysis of the Harvard Six Cities Study and the American Cancer Society Study of Particulate Air Pollution and Mortality: Special Report. Cambridge, MA:Health Effects Institute.
Krewski D, Jerrett M, Burnett RT, MA R, Hughes E, Shi Y, et al. 2009. Extended follow-up and spatial analysis of the American Cancer Society study linking particulate air pollution and mortality. Res Rep Health Eff Inst 140:5–114, PMID: 19627030.
Latifovic L, Villeneuve PJ, Parent MÉ, Johnson KC, Kachuri L, Canadian Cancer Registries Epidemiology Group, et al. 2015. Bladder cancer and occupational exposure to diesel and gasoline engine emissions among Canadian men. Cancer Med 4(12):1948–1962, PMID:26511593,https://doi.org/10.1002/cam4.544. Liu CC, Tsai SS, Chiu HF, Wu TN, Chen CC, Yang CY. 2009. Ambient exposure to
cri-teria air pollutants and risk of death from bladder cancer in Taiwan. Inhal Toxicol 21(1):48–54, PMID:18923949,https://doi.org/10.1080/08958370802207326. McKean-Cowdin R, Calle EE, Peters JM, Henley J, Hannan L, Thurston GD, et al. 2009. Ambient air pollution and brain cancer mortality. Cancer Causes Control 20(9):1645–1651, PMID:19685148,https://doi.org/10.1007/s10552-009-9412-1. Mordukhovich I, Beyea J, Herring AH, Hatch M, Stellman SD, Teitelbaum SL, et al.
2016. Vehicular traffic-related polycyclic aromatic hydrocarbon exposure and breast cancer incidence: The Long Island Breast Cancer Study Project (LIBCSP). Environ Health Perspect 124(1):30–38, PMID:26008800,https://doi.org/ 10.1289/ehp.1307736.
Newby DE, Mannucci PM, Tell GS, Baccarelli AA, Brook RD, Donaldson K, et al. 2015. Expert position paper on air pollution and cardiovascular disease. Eur Heart J 36(2):83–93b, PMID:25492627,https://doi.org/10.1093/eurheartj/ehu458. Novotny EV, Bechle MJ, Millet DB, Marshall JD. 2011. National satellite-based
land-use regression: NO2in the United States. Environ Sci Technol 45(10):4407–4414,
PMID:21520942,https://doi.org/10.1021/es103578x.
Oddone E, Modonesi C, Gatta G. 2014. Occupational exposures and colorectal can-cers: a quantitative overview of epidemiological evidence. World J Gastroenterol 20(35):12431–12444, PMID:25253943,https://doi.org/10.3748/wjg.v20.i35.12431. Pan WC, Wu CD, Chen MJ, Huang YT, Chen CJ, Su HJ, et al. 2015. Fine particle
pollu-tion, alanine transaminase, and liver cancer: a Taiwanese prospective cohort study (REVEAL-HBV). J Natl Cancer Inst 108(3):djv341, PMID:26561636,https://doi.org/10. 1093/jnci/djv341.
Patel AV, Calle EE, Bernstein L, Wu AH, Thun MJ. 2003. Recreational physical ac-tivity and risk of postmenopausal breast cancer in a large cohort of US women. Cancer Causes Control 14(6):519–529, PMID:12948283,https://doi.org/10.1023/ A:1024895613663.
Parent MÉ, Goldberg MS, Crouse DL, Ross NA, Chen H, Valois MF, et al. 2013. Traffic-related air pollution and prostate cancer risk: a case-control study in Montreal, Canada. Occup Environ Med 70(7):511–518, PMID:23531743, https://doi.org/10.1136/oemed-2012-101211.
Pope CA III, Turner MC, Burnett RT, Jerrett M, Gapstur SM, Diver WR, et al. 2015. Relationships between fine particulate air pollution, cardiometabolic disorders, and cardiovascular mortality. Circ Res 116(1):108–115, PMID: 25348167, https://doi.org/10.1161/CIRCRESAHA.116.305060.
Pope CA III, Burnett RT, Thun MJ, Calle EE, Krewski D, Ito K, et al. 2002. Lung cancer, cardiopulmonary mortality, and long-term exposure to fine particulate air pollution. JAMA 287(9):1132–1141, PMID:11879110,https://doi.org/10.1001/jama.287.9.1132. Pope CA III, Burnett RT, Turner MC, Cohen A, Krewski D, Jerrett M, et al. 2011. Lung
cancer and cardiovascular disease mortality associated with ambient air pollution and cigarette smoke: shape of the exposure-response relationships. Environ Health Perspect 119(11):1616–1621, PMID:21768054,https://doi.org/10.1289/ehp.1103639. Poulsen AH, Sørensen M, Andersen ZJ, Ketzel M, Raaschou-Nielsen O. 2016. Air
pollution from traffic and risk for brain tumors: a nationwide study in Denmark. Cancer Causes Control 27(4):473–480, PMID:26892605,https://doi.org/10.1007/ s10552-016-0721-x.
Raaschou-Nielsen O et al. 2011. Air pollution from traffic and cancer incidence: a Danish cohort study. Environ Health 10:67, PMID:21771295,https://doi.org/10. 1186/1476-069X-10-67.
Raaschou-Nielsen O, Ketzel M, Harbo Poulsen A, Sørensen M. 2016. Traffic-related air pollution and risk for leukaemia of an adult population. Int J Cancer 138(5):1111– 1117, PMID:26415047,https://doi.org/10.1002/ijc.29867.
Raj A, Mayberry JF, Podas T. 2003. Occupation and gastric cancer. Postgrad Med J 79(931):252–258, PMID:12782770,https://doi.org/10.1136/pmj.79.931.252. Reding KW, Young MT, Szpiro AA, Han CJ, DeRoo LA, Weinberg C, et al. 2015. Breast
cancer risk in relation to ambient air pollution exposure at residences in the Sister Study Cohort. Cancer Epidemiol Biomarkers Prev 24(12):1907–1909, PMID: 26464427,https://doi.org/10.1158/1055-9965.EPI-15-0787.
Santibañez M, Alguacil J, de la Hera MG, Navarrete-Muñoz EM, Llorca J, Aragonés N, et al. 2012. Occupational exposures and risk of stomach cancer by histologi-cal type. Occup Environ Med 69(4):268–275, PMID:22068174,https://doi.org/10. 1136/oemed-2011-100071.
Scheurer ME, Danysh HE, Follen M, Lupo PJ. 2014. Association of traffic-related hazard-ous air pollutants and cervical dysplasia in an urban multiethnic population: a cross-sectional study. Environ Health 13(1):52, PMID:24924773,https://doi.org/10. 1186/1476-069X-13-52.
Siemiatycki J, Krewski D, Shi Y, Goldberg MS, Nadon L, Lakhani R. 2003. Controlling for potential confounding by occupational exposures. J Toxicol Environ Health Part A 66(16–19):1591–1603, PMID:12959831,https://doi.org/10. 1080/15287390306428.
Siemiatycki J, Richardson L, Straif K, Latreille B, Lakhani R, Campbell S, et al. 2004. Listing occupational carcinogens. Environ Health Perspect 112(15):1447–1459, PMID:15531427,https://doi.org/10.1289/ehp.7047.
Stevens VL, McCullough ML, Sun J, Jacobs EJ, Campbell PT, Gapstur SM. 2011. High levels of folate from supplements and fortification are not associated with increased risk of colorectal cancer. Gastroenterology 141(1):98–105, PMID: 21586288,https://doi.org/10.1053/j.gastro.2011.04.004.
Turner MC, Cohen A, Jerrett M, Gapstur SM, Diver WR, Pope CA 3rd, et al. 2014. Interactions between cigarette smoking and fine particulate matter in the risk of lung cancer mortality in Cancer Prevention Study II. Am J Epidemiol 180(12):1145– 1149, PMID:25395026,https://doi.org/10.1093/aje/kwu275.
Turner MC, Jerrett M, Pope CA 3rd, Krewski D, Gapstur SM, Diver WR, et al. 2016. Long-term ozone exposure and mortality in a large prospective study. Am J Respir Crit Care Med 193(10):1134–1142, PMID:26680605, https://doi.org/10. 1164/rccm.201508-1633OC.
Turner MC, Krewski D, Pope CA, III, Chen Y, Gapstur SM, Thun MJ. 2011. Long-term ambient fine particulate matter air pollution and lung cancer in a large cohort of never-smokers. Am J Respir Crit Care Med 184(12):1374–1381, PMID: 21980033,https://doi.org/10.1164/rccm.201106-1011OC.
U.S. Census Bureau. 1993. Census of Population and Housing, 1990 (United States): Summary Tape File 3B. ICPSR Version. Ann Arbor, MI:Institute for Social Research, University of Michigan.
U.S. EPA (U.S. Environmental Protection Agency). 2011. Air quality data for the CDC National Environmental Public Health Tracking Network.http://www.epa.gov/ heasd/research/cdc.html. [accessed 13 October 2011].
U.S. EPA. 2013. “Final Report: Integrated Science Assessment of Ozone and Related Photochemical Oxidants”. EPA/600/R-10/076F. https://cfpub.epa.gov/ ncea/isa/recordisplay.cfm?deid=247492[accessed 18 October 2016]. Williams ML, Atkinson RW, Anderson HR, Kelly FJ. 2014. Associations between
daily mortality in London and combined oxidant capacity, ozone and nitrogen dioxide. Air Qual Atmos Health 7(4):407–414, PMID:25431629,https://doi.org/10. 1007/s11869-014-0249-8.
Winters N, Goldberg MS, Hystad P, Villeneuve PJ, Johnson KC. Canadian Cancer Registries Epidemiology Group, 2015. Exposure to ambient air pollution in Canada and the risk of adult leukemia. Sci Total Environ 526:153–176, PMID: 25955692,https://doi.org/10.1016/j.scitotenv.2015.03.149.
Wong CM, Tsang H, Lai HK, Thomas GN, Lam KB, Chan KP, et al. 2016. Cancer mortality risks from long-term exposure to ambient fine particle. Cancer Epidemiol Biomarkers Prev 25(5):839–845, PMID:27197138,https://doi.org/10.1158/1055-9965.EPI-15-0626. WHO (World Health Organization). 1977. The International Classification of
Diseases, 9th Revision. Geneva, Switzerland:World Health Organization. WHO. 1992. International Statistical Classification of Diseases and Related Health
Problems, 10th revision. Geneva, Switzerland:World Health Organization. Yang WS, Zhao H, Wang X, Deng Q, Fan WY, Wang L. 2016. An evidence-based
assessment for the association between long-term exposure to outdoor air pollution and the risk of lung cancer. Eur J Cancer Prev 25(3):163–172, PMID: 25757194,https://doi.org/10.1097/CEJ.0000000000000158.