POLITECNICO DI MILANO
School of Industrial and Information Engineering
Master of Science in Chemical Engineering
Department of Chemistry, Material and Chemical
Engineering “Giulio Natta”
Computer-Aided Preliminary Design and
Optimization of Distillation Column in
OPP's (O-phenylphenol) New Production
Process
Supervisor: Prof. Giovanni Dotelli
Candidate: Jishu Sun Matr. 872036
contents
Abstract ... III Estratto ... V 1 Introduction ... 1 1.1 Overview of o-phenylphenol ... 1 1.2 Application of o-phenylphenol ... 11.3 Existing mainstream production process and market conditions of o-phenylphenol... 2
1.4 Introduction of New Production Technology ... 3
1.5 Problem Statement ... 4
2 Concepts ... 6
2.1 Vapor–liquid equilibrium (VLE) ... 6
2.2 Bubble point and dew point temperature ... 6
2.3 Newton's method ... 7
2.4 Key components in multicomponent distillation ... 8
2.5 FUG method ... 8
3 Methodology ... 11
3.1 Newton's method ... 11
3.2 Calculation of phase equilibrium constant Ki ... 13
3.3 Bubble point calculation ... 14
3.4 Dew point calculation... 16
3.5 FUG method ... 17
3.6 Hypothesis and limitations of FUG method ... 25
4 Case Studies and Results ... 26
4.1 Fitting of Antoni Equation Parameters ... 26
4.2 Distillation column feed condition calculation ... 31
4.3 FUG method by Matlab ... 32
4.4 Design of Aspen RadFrac Simulated Distillation Column ... 35
4.5 Summary and Check ... 38
5 Optimization Design of Distillation Case Studies and Results ... 40
5.1 Sensitivity Analysis of Tray Number ... 40
5.2 Sensitivity Analysis of Feed Tray Position ... 42
5.3 Sensitivity Analysis of Reflux Ratio ... 44
5.4 Sensitivity Analysis of Feed Pressure ... 46
6 Concluding Remarks ... 49
Abstract
At present, the OPP production scale of China's chemical enterprises is small, and there is no obvious competitive advantage in cost, unit consumption and so on. The newly developed new OPP production process has made up for the shortcomings of other processes. The paper is on the preliminary design and optimization of the distillation column in this production process. The distillation column which meets the actual industrial production needs is designed by computer aided calculation.
The problem of missing physical data of Dibenzofuran was solved by using origin pro data fitting. The Newton iteration method was used to calculate the bubble and dew point temperatures involved in the design of distillation column with Matlab.
The whole design process is divided into three parts. Firstly, the FUG method is used to calculate the theoretical tray number, minimum reflux ratio, relative volatility and feed position of the distillation column. Then, using the above data, using Aspen simulation software to simulate the distillation column design. Finally, the sensitivity analysis of plate number, feed pressure, feed position and reflux ratio are used to optimize the design of distillation column, which can meet the separation requirements and save operation costs. The optimum design of distillation column is achieved.
The calculation method of bubble point and dew point in this study can be applied to the practical application of separation engineering. After obtaining reliable parameters of Antoni equation, the Newton iteration method can be used to calculate the bubble point and dew point temperature in multi-component system. It provides a reliable method for the calculation of vapor-liquid equilibrium.
Estratto
Attualmente, la scala di produzione OPP delle imprese chimiche cinesi è piccola e non vi è un evidente vantaggio competitivo in termini di costi, consumo unitario e così via.Il nuovo processo di produzione OPP recentemente sviluppato ha colmato le lacune di altri processi.Il foglio è sulla progettazione preliminare e l'ottimizzazione della colonna di distillazione in questo processo di produzione.La colonna di distillazione che risponde alle reali esigenze di produzione industriale è progettata mediante calcolo computerizzato.
Il problema dei dati fisici mancanti di Dibenzofuran è stato risolto utilizzando l'installazione di dati pro di origine.Il metodo di iterazione di Newton è stato utilizzato per calcolare le temperature di bolla e di punto di rugiada coinvolte nella progettazione della colonna di distillazione con Matlab.
L'intero processo di progettazione è diviso in tre parti.In primo luogo, il metodo FUG viene utilizzato per calcolare il numero teorico del vassoio, il rapporto minimo di riflusso, la relativa volatilità e la posizione dei mangimi della colonna di distillazione.Poi, utilizzando i dati di cui sopra, utilizzando software di simulazione Aspen per simulare il disegno della colonna di distillazione.Infine, l'analisi di sensibilità del numero di piastra, della pressione dei mangimi, della posizione dei mangimi e del riflusso sono utilizzati per ottimizzare la progettazione della colonna di distillazione, che può soddisfare i requisiti di separazione e risparmiare i costi di funzionamento.La struttura ottimale della colonna di distillazione è ottenuta.
Il metodo di calcolo del punto di bolla e del punto di rugiada di questo studio può essere applicato all'applicazione pratica dell'ingegneria di separazione.Dopo aver ottenuto parametri affidabili dell'equazione Antoni, il metodo di iterazione Newton può essere utilizzato per calcolare il punto di bolla e la temperatura del punto di rugiada nel sistema multi -componente.Fornisce un metodo affidabile per il calcolo dell'equilibrio vapor -liquido.
Chapter 1 Introduction
1 Introduction
1.1 Overview of o-phenylphenol
O-phenylphenol (OPP), CAS No. 90-43-7, the formula is C12H10O, the molecular weight is 170.21. Chemical structure formula:
O-phenylphenol is a white flake crystal with a special odor. The purity of o-phenylphenol is 98%. Its relative density is 1.2130, melting point is 56-59 C, boiling point is 283-286 C, flash point is 127 C. It is slightly soluble in water, easily soluble in organic solvents such as ethanol, propanol, benzene, toluene, trichloroethylene and alkali solution.
1.2 Application of o-phenylphenol
O-phenylphenol is an important new type of fine chemical products and organic intermediates. It is widely used in sterilization, anti-corrosion, printing and dyeing auxiliaries and surfactants, in the synthesis of new plastics, resins and polymer materials stabilizers and flame retardants. In recent years, the actual demand for o-phenylphenol in the global market has increased year by year, and it has also promoted the further research
and development of o-phenylphenol, and its application field will be further broadened.
1.3 Existing mainstream production process and market conditions of o-phenylphenol
The companies that produce OPP in the world are mainly concentrated in Japan, the United States and Germany. The largest manufacturer of products is Bayer AG. OPP's global production is about 20,000 tons/year, with an average annual growth rate of 7%. OPP's market price is about 5,000 euros / ton, the market size is about 800 million, and the rapid development of environmentally friendly flame retardant materials is expected to drive the rapid increase of OPP demand.
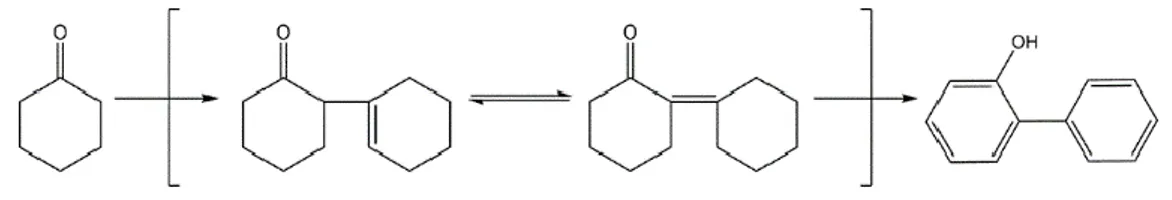
The current main process method is cyclohexanone condensation dehydrogenation method: cyclohexanone liquid phase condensation synthesis dimer, dimer gas phase catalytic dehydrogenation into OPP, and then distillation, recrystallization to obtain pure OPP. Synthesis process:
Chapter 1 Introduction
1.4 Introduction of New Production Technology
At present, the OPP production scale of China's chemical enterprises is small, and there is no obvious competitive advantage in cost, unit consumption and so on. There are a lot of wastewater problems in the existing production process, and the pressure of environmental protection is high. But at the same time, the imbalance between supply and demand caused by this situation also brings market opportunities. Sinochem International Group has developed a new OPP production process, and the process has been optimized. While paying attention to environmental protection, the value of by-products in production process has been improved to cope with price changes flexibly and capture market share.
The new production process uses fluorene oxide (DBF) extracted from coal tar and washing oil as raw material to produce OPP.
Which follows:
Figure 1.4.1 OPP synthesis
successfully completed. The process uses readily available toluene as a solvent. The reaction is carried out in a fixed-bed reactor. The conversion and yield of the reaction meet the needs of industrial production. The reaction products of the reaction are oxonium, biphenyl, OPP, toluene and phenol. Oxonium is the main reactant, toluene is the solvent, OPP is the target product, and biphenyl is obtained as an important by-product. After the reaction is completed, the reaction product is sent to a distillation column to separate the desired product, after which the by-product is purified by a crystallization process and the solvent is recycled to the reactor. It should be noted that the boiling point of fluorene oxide and OPP is close and there is an azeotropic phenomenon, which will affect the separation efficiency of distillation column.
This paper focuses on the preliminary design and optimization of the distillation column in this production process. The distillation column which meets the actual industrial production needs is designed by computer aided calculation.
1.5 Problem Statement
When designing and optimizing the distillation column, simulation software such as Aspen Plus and Hysys is usually used to design and
Chapter 1 Introduction
simulate the operation of the tower equipment. However, simulation software usually relies heavily on its material database for simulation calculation, so once the database lacks the important reactant parameters, it will cause great design errors. This is not allowed.
As described in this paper, the Aspen Plus software is used for the distillation column design, but all the physical parameters of the oxygen oxime are not available in the database, then the subsequent calculation can only be performed by the physical property parameter simulated function of the Aspen Plus.
Therefore, in the process of designing the distillation column, it is necessary to fit the parameters of reactants (especially the parameters of Antoni equation, which are used to calculate the bubble and dew points of multi-components) and to compare and verify the accuracy of the simulation results of the Aspen Plus by matlab. Finally, the design optimization is carried out by Aspen Plus to achieve the goal. To the optimal distillation column. Then, Aspen Plus is used to optimize the design to achieve the optimal distillation column design.
2 Concepts
2.1 Vapor–liquid equilibrium (VLE)
For the calculation of the distillation column, the first concern is to solve the vapor-liquid equilibrium problem. The vapor–liquid equilibrium (VLE) describes the distribution of a chemical species between the vapor phase and a liquid phase. The equilibrium vapor pressure of a liquid is in general strongly dependent on temperature. Such vapor–liquid equilibrium information is useful in designing columns for distillation. Solving the vapor–liquid equilibrium problem is to calculate the bubble point and dew point temperature and the composition of the vapor–liquid phase.
2.2 Bubble point and dew point temperature
The liquid of a certain composition is heated under a constant pressure, and the temperature when the first bubble appears in the liquid phase is called the bubble point temperature. On the other hand, if a certain composition of the gas is cooled under a constant pressure, the temperature at which the first droplet appears is called the dew point temperature. Calculating the bubble point and dew point temperature is the most basic step in solving the separation process.
Chapter 2 Concepts
2.3 Newton's method
In numerical analysis, Newton's method, also known as the Newton-Raphson method, named after Isaac Newton and Joseph Raphson, is a root-seeking algorithm that continuously produces an approximation of the root (or zero) closer to the real-valued function. Newton's iteration method is one of the most important methods to find the root of the equation. Its greatest advantage is that it has a square convergence near the single root of the equation f(x)=0, and it can also be used to find the multiple and complex roots of the equation. In addition, this method is widely used in computer programming.
The idea is to start with an initial guess which is reasonably close to the true root, then to approximate the function by its tangent line using calculus, and finally to compute the x-intercept of this tangent line by elementary algebra. This x-intercept will typically be a better approximation to the original function's root than the first guess, and the method can be iterated.
The convergence criteria of the Newton iteration method applicable in this paper is set to 0.0001 to ensure the accuracy of calculation of bubble point and dew point temperature.
2.4 Key components in multicomponent distillation
The component separated are called the light key, which is the more volatile. The components more volatile than the light key are called light components and will be present in the bottoms in small amounts. The components less volatile than the heavy keys are called heavy
components and are present in the distillate in small amounts. The two keys components are present in significant amount in both the distillate and bottoms.
2.5 FUG method
Fenske equation
The Fenske equation in continuous fractional distillation is an equation used for calculating the minimum number of theoretical trays required for the separation of a multicomponent feed stream by a distillation column that is being operated at total reflux (i.e., which means that no overhead product distillate is being withdrawn from the column). The equation was derived in 1932 by Merrell Fenske.
When designing large-scale, continuous industrial distillation columns, it is very useful to first calculate the minimum number of theoretical trays required to obtain the desired overhead product composition.
Chapter 2 Concepts
Underwood methods
The method is applied to all the i-components of a distillation, under the column’s condition of minimum reflux. Minimum reflux is estimated using the Underwood method. The Underwood method assumes constant molar overflow and relatively constant relative volatilities. If these do not apply, caution is necessary when applying the results.
It also should be noted that this method uses Underwood constant,θ. The determination of the value of Underwood Constant will affect the calculation results of Minimum reflux.
Gilliland methods
Gillilands (1940) method, which is developed into an equation by Molokanov (1972), is an empirical correction considered as an
approximation method. It is utilized at the operating reflux ratio R (for flow rates at the column top) is correlated with the minimum reflux ratio obtained using the Underwood method, the minimum number of stages obtained by the Fenske method, and the number of stages N at the operating R
widely method used short cut method for determining number of equilibrium stages for multicomponent distillation.
Chapter 3 Methodology
3 Methodology
3.1 Newton's method
Newton's method, also known as Newton-Raphson method, is a method proposed by Newton in the 17th century to approximate the solution of equations in real and complex fields.
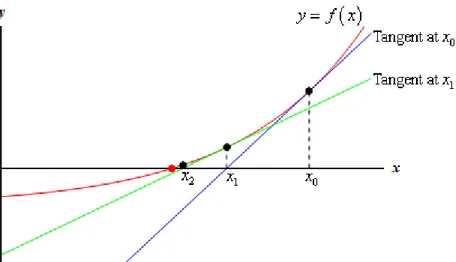
Figure 3.1.1 Newton-Raphson method curves
Let r be the root of f(x)=0, select x0 as the initial approximation of r, and cross point (x0,f(x0)) as the tangent L of curve y=f(x) , 𝐿: 𝑦 = 𝑓(𝑥0) + 𝑓′(𝑥0)(𝑥 − 𝑥0) , then the abscissa 𝑥1 = 𝑥0 − 𝑓(𝑥0)
𝑓′(𝑥
0) at the intersection
of L and axis x is called the first approximation of r. The crossing point (x1,f(x1)) makes the tangent of curve y=f(x) , and obtains the abscissa 𝑥2 = 𝑥1 − 𝑓(𝑥1)
𝑓′(𝑥
1) of the intersection of the tangent and the x-axis, which
is called the quadratic approximation of r. Repeat the above process to get the approximation sequence of r , where a is called a sub-approximation
of 𝑥𝑛+1 = 𝑥𝑛− 𝑓(𝑥𝑛) 𝑓′(𝑥
𝑛) , and the upper formula is called Newton's
iteration formula.
The Newton iteration method is an approximate method to solve the non-linear equation, which linearizes the non-linear equation f(x)=0 . Expand of f(x) in a neighborhood of point x0 into Taylor series
𝑓(𝑥) = 𝑓(𝑥0) + 𝑓′(𝑥 0)(𝑥 − 𝑥0) + 𝑓′′(𝑥0)(𝑥 − 𝑥0)2 2! + ⋯ +𝑓 (𝑛)(𝑥 0)(𝑥 − 𝑥0)𝑛 𝑛! + 𝑅𝑛(𝑥)
Take its linear part (the first two terms of Taylor expansion), and make it equal to 0, then 𝑓(𝑥0) + 𝑓′(𝑥
0)(𝑥 − 𝑥0) = 0. Using it as an
approximate equation for the nonlinear equation f(x)=0 . if 𝑓′(𝑥0) ≠ 0, Then the solution is 𝑥1 = 𝑥0− 𝑓(𝑥0)
𝑓′(𝑥
0) , thus an iteration formula of
Newton's iteration method is obtained: 𝑥𝑛+1 = 𝑥𝑛 − 𝑓(𝑥𝑛) 𝑓′(𝑥
𝑛) .
It has been shown that if it is continuous and the zero to be sought is isolated, there is an area around the zero point, and as long as the initial value is within this neighborhood, the Newton method must converge. Also, if not 0, then Newton's method will have square convergence performance. Roughly speaking, this means that for each iteration, the effective number of Newton's method results will double.
Chapter 3 Methodology
It is worth noting that in the iterative calculation of bubble point and dew point, the selection of the appropriate iteration initial value x0 will affect the accuracy of the calculation results of bubble point and dew point. Therefore, it is necessary to estimate an appropriate initial value of the iteration in advance.
3.2 Calculation of phase equilibrium constant Ki
According to the definition of ideal system, the saturated vapor phase composition y should conform to Dalton's law of partial pressure in equilibrium state: PVi=PYi. The vapor phase composition conforms to Raoul's law: PLi=𝑝𝑖0𝑥𝑖. In the case of two-phase equilibrium: PVi= PLi. In the above formulae, the subscript i represents the component, the subscript V represents the vapor phase, and the subscript L represents the liquid phase.
In a multi-component equilibrium system, the ratio of the mole fraction of the i component in the vapor-liquid two phase is called the vapor-liquid equilibrium constant or the partition coefficient 𝐾𝑖 = 𝑌𝑖
𝑋𝑖
. The
mathematical expression in the ideal system is 𝐾𝑖 = 𝑃𝑖0
𝑃. Where P𝑖
0 is the saturated vapor pressure of pure component i at system temperature, and
P is the system pressure. The saturated vapor pressure of pure components can be calculated by the Antoine equation. The Antoine equation: 𝑙𝑛 𝑃𝑖0 = 𝐴𝑖 − 𝐵𝑖
𝐶𝑖+𝑇. Ai, Bi, and Ci are the three atoine constants
of component i, respectively. The Antoine formula applies only to low pressure systems (less than 0.2 MPa)
The known conditions of the process are the component number M, the composition of the material Xi (Yi) and the system pressure P. It is
necessary to calculate bubble point and dew point temperature and vapor phase (liquid phase) composition Yi(Xi) of phase equilibrium.
3.3 Bubble point calculation
A vapor-liquid equilibrium system with M components has 2M+2 independent equations:
The phase equilibrium equation of component I is 𝐾𝑖 = 𝑌𝑖 𝑋𝑖 Thermodynamic equation is 𝐾𝑖 =𝑃𝑖0 𝑃 = 1 𝑃𝑒𝑥𝑝 (𝐴𝑖 − 𝐵𝑖 𝐶𝑖+𝑇) Normalized equation is ∑𝑌𝑖 = 1
It is assumed here that the Antoine equation applies. There are M
equations for calculating the phase equilibrium constant. The variables of the system are 3M+2, i.e. system temperature T, pressure P and Xi, Yi and Ki of M components. When the liquid phase composition of the system
Chapter 3 Methodology
and the pressure of the system are determined, the temperature that
satisfies the above three sets of equations is the bubble point temperature.
When calculating the bubble point temperature, the phase equilibrium equation and thermodynamic equation are substituted into the normalized equation, and the temperature T is derived by the Newton method until the objective function is satisfied: 𝐹(𝑇) = ∑ 𝑌𝑖 − 1 = 0.
Introduce the Antoine equation and derive the temperature T:
d𝐹(𝑇) d𝑇 = 1 𝑃∑ 𝑋𝑖 𝑒𝑥𝑝 [𝐴𝑖 − 𝐵𝑖 𝐶𝑖 + 𝑇] 𝑖 ⋅ 𝐵𝑖 (𝐶𝑖 + 𝑇)2 d𝐹(𝑇) d𝑇 = ∑ 𝑌𝑖 𝐵𝑖 (𝐶𝑖 + 𝑇)2 𝑖
Firstly, the initial temperature T is set and the equilibrium constant K is obtained, then the vapor phase composition Yi of the phase equilibrium can be obtained, which can be distinguished by the normalized equation. If the accuracy requirement is not met, the Newton iteration method can be used to iterate until the accuracy requirement is met.
The calculation process of bubble point temperature using matlab program is as follows.
3.4 Dew point calculation
The procedure for calculating the dew point temperature is similar to calculating the bubble point temperature. When the vapor phase
composition of the system and the pressure of the system are determined, the temperature that satisfies the above three sets of equations is the dew point temperature.
The phase equilibrium equation of component I is 𝐾𝑖 = 𝑌𝑖
𝑋𝑖 Thermodynamic equation is 𝐾𝑖 =𝑃𝑖0 𝑃 = 1 𝑃𝑒𝑥𝑝 (𝐴𝑖 − 𝐵𝑖 𝐶𝑖+𝑇) M, P, T, Physical parameters Set T 𝐾𝑂(𝑖) = 𝐸𝑋𝑃(𝐴𝑁(𝑖) − 𝐵𝑁(𝑖)/(𝐶𝑁(𝑖) + 𝑇)/𝑃 Y(i)=KO(i)*XF(i) 𝐹(𝑇) = ∑ Y(i) − 1 𝐹(𝑇) = ∑(Y(i) ∗ BN(i)/(CN(i) + T)^2) Abs(FT/FD)<=EPS Print T, Xi, Yi T=T-(FT/FD) NO
Chapter 3 Methodology Normalized equation is ∑𝑋𝑖 = 1 Then 𝐹(𝑇) = ∑ 𝑋𝑖 − 1 = ∑ 𝑃𝑌𝑖𝑒𝑥𝑝 [𝐴𝑖 − 𝐵𝑖 𝐶𝑖+𝑇] −1 𝑖 − 1 = 0.
Introduce the Antoine equation and derive the temperature T:
d𝐹(𝑇) d𝑇 = 𝑃 ∑(−𝑌𝑖𝑒𝑥𝑝 [𝐴𝑖 − 𝐵𝑖 𝐶𝑖 + 𝑇] −2 𝑒𝑥𝑝 [𝐴𝑖 − 𝐵𝑖 𝐶𝑖 + 𝑇] 𝐵𝑖 (𝐶𝑖 + 𝑇)^2) 𝑖
Similarly, Newton iteration method is used to iterate until the accuracy requirement is satisfied, and the dew point temperature is obtained.
3.5 FUG method
The flow chart is as follows:
Start Specify 1. Feed rate 2. Operating pressure 3. Feed state 4. Reflux ratio
5. Feed components and composition 6. Key composition
Estimate top and bottom composition
Compute
1. Dew point for the top 2. Bubble point for the bottom
Equilibrium in the multicomponent distillation
Raoult's law can be used to determine the composition of vapor in
equilibrium with the composition of liquid for a multicomponent system that can be considered ideal.
pi=Pixi
Where pi is the partial pressure of component i in the vapour in Pa (atm). pi is the vapour pressure of pure i in Pa (atm) and xi is the mole fraction of i in the liquid. In hydrocarbon systems, because of non-idealities, the equilibrium data are often represented by:
yi=Kixi
Where Ki is the vapor-liquid equilibrium constant It should be noted that for ideal system:
𝐾𝑖 = 𝑃𝑖 0 𝑃
The relative volatility 𝛼𝑖 for each individual component in a
multicomponent mixture can be defined in a manner similar to that for a binary mixture. If component C in a mixture of A, B, C, D and E is selected as the base component
1. Minimum number of stages at total reflux ratio using Fenske
2. Minimum reflux ratio using Underwood
3. Theoretical numbers of stages at operating reflux ratio using Gilliland
Chapter 3 Methodology 𝛼𝑖 = 𝑘𝑖 𝑘𝑐, 𝛼𝐴 = 𝑘𝐴 𝑘𝐶, 𝛼𝐵 = 𝑘𝐵 𝑘𝐶 , 𝛼𝐶 = 𝑘𝐶 𝑘𝐶 = 1.0, 𝛼𝐷 = 𝑘𝐷 𝑘𝐶 , 𝛼𝐸 = 𝑘𝐸 𝑘𝐶
Boiling point and dew point calculation
For the calculation of bubble point and dew point temperature, Newton iteration can be performed on the composition and temperature of the components by matlab to calculate the exact bubble point and dew point temperature.
Data fitting
However, it is worth noting that since the feed components in the
distillition column case contains substances that are not commonly used in the industry: fluorene and o-phenylphenol. It requires to find the exact Antoine equation parameters for the feed components to calculate the bubble point and dew point temperature. In this case, the data fitting method was performed by Origin data processing software to determine the Antoine parameters of each component.
Due to the lack of physical data of fluorene in Aspen's database, the Antony equation parameters of fluorene are selected, which are provided by DDB (Dortmund Data Bank), in the form of three parameters. The parameters of the other four components can be obtained by searching Aspen's database of PLXANT-1 physical parameters. The extended Antoine vapor pressure model is applicable in Aspen.
ln pi∗,l = C1i + Cx
T + C3i + C4iT + C5iln T + C6iT
Cπ for C
8i ≤ T ≤ C9i Therefore, it is necessary to fit the data into three-parameter Antony equation model.
Minimum number of stages at total reflux ratio using Fenske equation The Fenske equation is applicable to any two components in a
multi-component system. When applied to HK and LK 𝑁𝑚 = 𝑙𝑜𝑔|(𝑥𝐿𝐷𝐷/𝑥𝐻𝐷𝐷)(𝑥𝐻𝑊𝑊/𝑥𝐿𝑊𝑊)|
𝑙𝑜𝑔(𝛼𝐿,𝑎𝑣)
Where 𝑥𝐿𝐷𝐷 = mole fraction of light key in distillate. 𝑥𝐿𝑊= Mole fraction of the light component in bottoms. 𝑥𝐻𝐷= Mole fraction of heavy component in bottoms.
The average value 𝛼𝐿,𝑎𝑣 ( is the relative volatility) of the light key is calculated form the 𝛼𝐿D at the top temperature (dew point) of the tower and 𝛼𝐿w at the bottoms temperature(bubble point):
𝛼𝐿,𝑎𝑣 = √𝛼𝐿𝐷𝛼𝐿𝑊
We can see that the minimum number of theoretical trays is independent of the feed composition and is only determined by the separation
requirements. As the separation requirements increase (ie, the distribution ratio of light key components increases, the distribution ratio of heavy key components decreases), and the relative volatility between key
Chapter 3 Methodology
components approaches 1, the minimum number of theoretical trays required will increase.
Estimate top and bottom composition
To determine the distribution or concentration of other components in the top and the bottoms at total reflux, the equation is used for any other component i as follows.
𝑥𝑖𝐷𝐷
𝑥𝑖𝑤𝑊 = (𝛼𝐿,𝑎𝑣)
𝑁𝑚 𝑥𝐻𝐷𝐷 𝑥𝐻𝑊𝑊
The accuracy of Fenske equation obviously depends on the reliability of relative volatility data. The calculation methods of bubble and dew point introduced earlier in this paper can provide accurate relative volatility.
Minimum reflux ratio using Underwood
The Underwood shortcut method to calculate 𝑅𝑚 uses constant average 𝛼 values and also assumes constant flows in both sections of the tower. This method provides a reasonably accurate value. The two equations to be solved to determine the minimum reflux ratio are:
1 − 𝑞 = ∑ 𝛼𝑖𝑥𝑖𝐹 𝛼𝑖 − 𝜃 𝑅𝑚+ 1 = ∑ 𝛼𝑖𝑥𝑖𝐷
𝛼𝑖 − 𝜃 Where 𝛼𝑖 Relative volatility of component i
q Liquid fraction of feed 𝑅𝑚 Minimum reflux ratio
𝑥𝑖𝐹 Molar fraction of component i in feed mixture
𝑥𝑖𝐷 Molar fraction of component i in distillate at minimum reflux ratio 𝜃 The roots of equations
To solve 𝑅𝑚, the value of 𝜃 should be calculated first. 𝜃 value should be between a value of light and heavy key components. If the light and heavy key components are not adjacent components, two or more 𝜃 values can be obtained, and 𝑅𝑚 can be calculated separately, taking the larger one.
The composition of distillate at the minimum reflux ratio is needed for calculating 𝑅𝑚, but it is difficult to know the composition. In practice, the composition under the condition of total reflux is often used to replace the composition under the condition of total reflux.
Real reflux ratio and theoretical tray number
The minimum number of theoretical trays and the minimum reflux ratio are two limiting conditions under full reflux condition. They determine the allowable range of theoretical trays and operating reflux ratio, which is helpful to select specific operating conditions.
Chapter 3 Methodology
The optimal value of R/𝑅𝑚 is about 1.05, but it is close to the optimal condition within a certain range slightly larger than this value. In practice, if R/𝑅𝑚=1.10 is often required, many theoretical trays are required; if the value is 1.50, fewer theoretical trays are required. According to
experience, the median value is generally 1.30.
Gilliland’s shortcut method, which is developed into an equation by Molokanov, is an empirical correction considered as an approximation method.
Figure 3.5.1 Gilliland correlation
It is utilized at the operating reflux ratio R is correlated with the minimum 𝑅𝑚 obtained using the Underwood method, the minimum number of stages Nm obtained by the Fenske method, and the number of
stages N at the operating R, given 𝑁 − 𝑁𝑚 𝑁 + 1 = 1 − 𝑒𝑥𝑝 {( 1 + 54.4𝜓 11 + 117.2𝜓) ( 𝜓 − 1 𝜓0.5 )} Where 𝜓 = (𝑅−𝑅𝑚 𝑅+1 )
Estimation of Feed tray Location
The calculation of the theoretical tray number by the short cut method also includes determining the appropriate feed position. The principle of determining the suitable feed position is that the ratio of theoretical tray number of distillation section to stripping section is equal to the ratio of theoretical tray number of distillation section to stripping section
calculated by Fenske equation under the condition of full reflux. This empirical relation is as follows:
𝑙𝑜𝑔𝑁𝑅 𝑁𝑆 = 0.206 𝑙𝑜𝑔 [( 𝑥𝐻𝐹 𝑥𝐿𝐹) 𝑊 𝐷 ( 𝑥𝐿𝑊 𝑥𝐻𝐷) 2 ]
Where 𝑁𝑅 is the number of theoretical stages above the feed tray 𝑁𝑆 𝑖𝑠 the number of theoretical stages below the feed tray.
The combination of the above parts constitutes a FUG
(Fenske-Underwood-Gilliland) short cut method for a multicomponent distillation calculation.
Chapter 3 Methodology
3.6 Hypothesis and limitations of FUG method
It presumes the most basic assumptions that are generally made while designing that is constant molar flow of components, i.e., for each stage, molar latent heat of vaporization of liquid phase is equal to molar latent heat of condensation of vapour phase. Hence moles of liquid vaporized over each theoretical stage are equal to moles of vapour condensed on that stage. This implies that, molar flow rate of liquid and vapours in distillation section (L and V) and also in stripping section (Ĺ and Ṽ) remains constant.
It also assumes that the physical properties of components remain constant throughout the column.
It assumes system to be non-foaming, non-corrosive, non-azeotropic and well thermally insulated, i.e., no heat loss.
4 Case Studies and Results
4.1 Fitting of Antoni Equation Parameters
For the design of the distillation column, the Antoine equation parameters are the basis for calculating the phase equilibrium relationship in a
multi-component system. Since the feed components involved in this case are partially missing in the Aspen software property database, the
parameter source is divided into two parts: 1. Provided by DDB (Dortmund Data Bank). 2. Aspen physical property database.
The parameters of the Antoni equation for Dibenzofuran are as follows:
Table 4.1.1 Dibenzofuran Antoni equation parameters
Converted to the standard Antonio equation form as follows:
Table 4.1.2 Dibenzofuran standard Antoni equation parameters
The other five components of the Antoine equation are obtained from Aspen's physical property database. Since it is a five-parameter form, it
DDB format: log (P/Torr) = A – B / (C + T/°C)
A B C
Fluorene 6.94368 1885.05 178.793
Standard format: log (P/KPa) = A – B / (C + T/K)
A B C
Chapter 4 Case Studies and Results
needs to be processed by OriginPro and fitted to a standard three-parameter form.
For Aspen formal:Extended Antoine Equation
Parameters for many components are available for the extended Antoine equation from the Aspen Physical Property System pure component databank. ln 𝑝𝑖∗,𝑙 = 𝐶1𝑖 + 𝐶2𝑖 𝑇 + 𝐶3𝑖 + 𝐶4𝑖𝑇 + 𝐶5𝑖ln 𝑇 + 𝐶6𝑖𝑇 𝐶7𝑖 for 𝐶 8𝑖 ≤ 𝑇 ≤ 𝐶9𝑖 Biphenyl:
Table 4.1.3 Biphenyl Aspen Antoni equation parameters
By OriginPro fitting, it is as follows:
Table 4.1.4 Biphenyl standard Antoni equation parameters
Fitted curves plot:
Components Temperature Units Property Units
Biphenyl K KPa 1 2 3 4 5 6 7 8 9 62.6334 -9415.99 0 0 -6.41553 1.58601e-18 6 528.15 773 A B C Statistics Value Standard Error Value Standard Error Value Standard Error Value Standard Error 14.64311 0.00689 4532.69004 5.55163 -75.84895 0.22288 2.57785E-5 1
Figure 4.1.1 Biphenyl Antoni equation parameters fitted curves
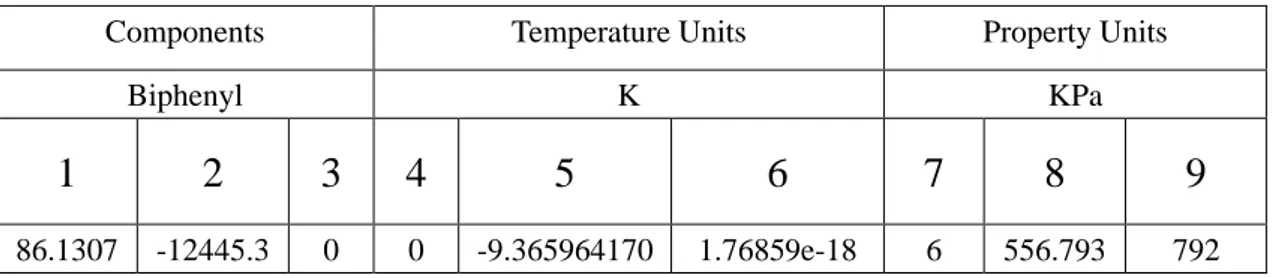
O-phenylphenol:
Table 4.1.5 O-phenylphenol Antoni equation parameters
By OriginPro fitting, it is as follows:
Table 4.1.6 O-phenylphenol standard Antoni equation parameters
300 400 500 0 20 40 B A
Components Temperature Units Property Units
Biphenyl K KPa 1 2 3 4 5 6 7 8 9 86.1307 -12445.3 0 0 -9.365964170 1.76859e-18 6 556.793 792 A B C Statistics Value Standard Error Value Standard Error Value Standard Error Value Standard Error 15.74237 0.00862 5124.21229 7.01682 -95.90413 0.24863 1.32878E-5 1
Chapter 4 Case Studies and Results
Fitted curves plot:
Figure 4.1.2 O-phenylphenol Antoni equation parameters fitted curves
Phenol:
Table 4.1.7 Phenol Antoni equation parameters
By OriginPro fitting, it is as follows:
Table 4.1.8 Phenol standard Antoni equation parameters
300 400 500 0 10 20 30 40 B A
Components Temperature Units Property Units
Biphenyl K KPa 1 2 3 4 5 6 7 8 9 61.0673 -8794.66 0 0 -6.822057360 3.14272e-18 6 454.99 694.25 A B C Statistics Value Standard Error Value Standard Error Value Standard Error Value Standard Error 15.62165 0.00753 4299.95098 5.18058 -63.99415 0.1852 7.87848E-6 1
Fitted curves plot:
Figure 4.1.3 Phenol Antoni equation parameters fitted curves
Toluene:
Table 4.1.9 Toluene Antoni equation parameters
By OriginPro fitting, it is as follows:
Table 4.1.10 Toluene standard Antoni equation parameters
200 300 400 0 10 20 30 B A
Components Temperature Units Property Units
Biphenyl K KPa 1 2 3 4 5 6 7 8 9 47.8456 -5962.51 0 0 -4.657420650 6.51866e-18 6 383.78 591.75 A B C Statistics Value Standard Error Value Standard Error Value Standard Error Value Standard Error 14.80654 0.0064 3533.12749 3.49026 -36.25931 0.12055 2.91969E-7 1
Chapter 4 Case Studies and Results
Fitted curves plot:
Figure 4.1.4 Toluene Antoni equation parameters fitted curves
4.2 Distillation column feed condition calculation
In the new OPP production process, the raw material is dibenzofuran produced by downstream refineries with an annual yield of 1000t. In the reaction for producing OPP, the selectivity was 72.7%.
The distillation column feed composition is:
Table 4.2.1 The distillation column feed composition
100 200 300 0 5 10 B A
component Formula Mole fraction
Dibenzofuran C12H8O 0.0196
Biphenyl C12H10 0.0021
O-phenylphenol C12H10O 0.006
Phenol C6H5OH 0.0003
Calculate the amount of feed by moles: 1000 × 1000 × 70%
365 × 168 × 24 /0.0196 = 24.2677 𝑚𝑜𝑙𝑒/ℎ The operating pressure of the distillation column is 110KPa, Feeding condition is bubble point feeding i.e. liquid fraction of feed q = 1 Calculate the feed bubble point temperature using the bubble point calculation program written in Matlab Tfeed = 386.8488 K.
The program uses Newton iteration method to calculate the bubble point of multi-component system, and uses the software of MATLAB to call the Antonio equation parameters in Excel file and the status of feed components.
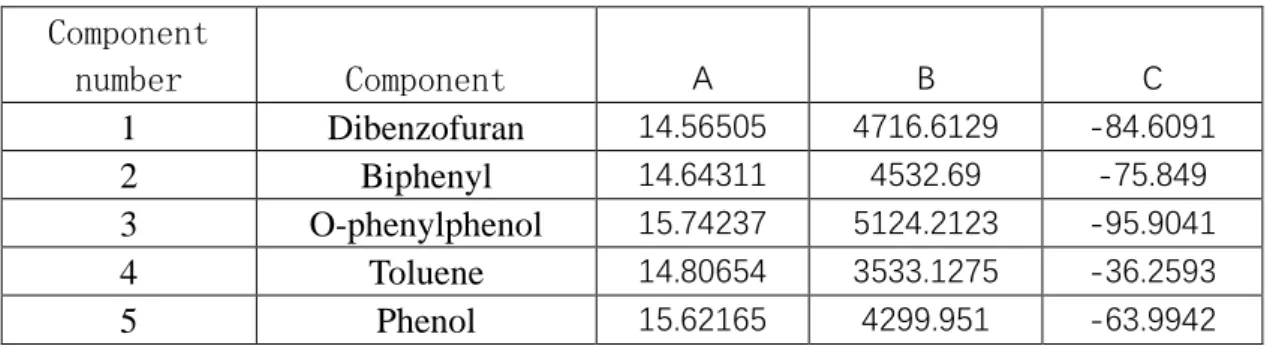
Table 4.2.2 components Antoni equation parameters
Table 4.2.3 The distillation column feed condition
4.3 FUG method by Matlab
Dibenzofuran was selected as the light key component (LK) and O-phenylphenol as the heavy key component (HK) according to the
Component number Component A B C 1 Dibenzofuran 14.56505 4716.6129 -84.6091 2 Biphenyl 14.64311 4532.69 -75.849 3 O-phenylphenol 15.74237 5124.2123 -95.9041 4 Toluene 14.80654 3533.1275 -36.2593 5 Phenol 15.62165 4299.951 -63.9942
Dibenzofuran Biphenyl O-phenylphenol Toluene Phenol P
Chapter 4 Case Studies and Results
bubble point temperature and separation requirements.
Using the Fenske equation to solve the minimum number of theoretical trays requires knowing the concentration of light and heavy key
components in the top and bottom of the column. That is, you must first calculate x1, D (top) and x3, B (bottom) by material balance.
The feed amount was 24.2677 moles. Assume that the division is clear and the following table is based on the material balance relationship: According to separation requirements, assume b1=0.85B, d3=0.003D
Table 4.2.4 The distillation column compositions
Solve D, B and complete the material balance as follows.
By mass: component Feed, fi bi di 1 Dibenzofuran 0.0196*24.2677 0.85B 0.0196*24.2677-0.85B 2 Biphenyl 0.0021*24.2677 0 0.0021*24.2677 3 O-phenylphenol 0.006*24.2677 0.006*24.2677-0.003D 0.003D 4 Phenol 0.0003*24.2677 0 0.0003*24.2677 5 Toluene 0.9719*24.2677 0 0.9719*24.2677 ∑ 24.2677 B D component Feed, fi bi di 1 Dibenzofuran 0.0196*24.2677 0.420970306 0.054676614 2 Biphenyl 0.0021*24.2677 0 0.05096217 3 O-phenylphenol 0.006*24.2677 0.074288878 0.071317322 4 Phenol 0.0003*24.2677 0 0.00728031 5 Toluene 0.9719*24.2677 0 23.58577763 ∑ 24.2677 0.495259184 23.77244082
Table 4.2.5 The distillation column feed condition by mass
By molar fraction:
Table 4.2.6 The distillation column feed condition by molar fraction
Calculating relative volatility
Firstly, the relative volatility of the key components, 𝛼D and 𝛼B, was calculated at the top temperature (dew point) and bottom temperature (bubble point).
𝛼D =1.780715592; 𝛼B = 0.937846241
Average Relative Volatility of Light and Heavy Key Components: 𝛼LH,av = √𝛼D ∗ 𝛼B = 0.835
Calculate the minimum number of trays:
𝑁𝑚 = 𝑙𝑔[( 0.0023 0.003)/( 0.15 0.85)] 𝑙𝑔0.835 = 12.89699009 ≈ 13
Calculating the Minimum Reflux Ratio:
In order to solve the minimum reflux ratio, the root 𝜃 of Underwood equation is first required: 𝜃 = 1.103709042
component Feed, fi bi di 1 Dibenzofuran 0.0196 0.85 0.0023 2 Biphenyl 0.0021 0 0.00214375 3 O-phenylphenol 0.006 0.15 0.003 4 Phenol 0.0003 0 0.00030625 5 Toluene 0.9719 0 0.992147917
Chapter 4 Case Studies and Results
Then 𝑅𝑚 = ∑𝛼𝑖𝑥𝑖𝐷
𝛼𝑖−𝜃 − 1 = 0.009868
Calculate the position of the feed tray:
𝑙𝑜𝑔𝑁𝑅 𝑁𝑆 = 0.206 𝑙𝑜𝑔 [( 0.006 0.0196) 0.4677 23.8 ( 0.85 0.003) 2 ] 𝑁𝑅 𝑁𝑆 = 3.57 𝑁𝑅 + 𝑁𝑆 = 13
Then 𝑁𝑆 = 2.84463895 ≈ 3. That is, the number of feeding trays should be the tenth tray.
4.4 Design of Aspen RadFrac Simulated Distillation Column
The results of FUG calculation are used as the initial design parameters of Aspen RadFrac simulation to simulate the distillation column design as follows:
Figure 4.4.1 Initial parameters of distillation column
The components composition of each tray was obtained by simulation of the distillation column by Aspen:
Table 4.2.7 The components composition of each tray of the distillation column
Stage Dibenzofuran Biphenyl O-phenylphenol Toluene Phenol
1 0.003345 0.002136 0.003115 0.991098 0.000306 2 0.249188 0.058601 0.26973 0.421566 0.000916 3 0.457276 0.050977 0.448741 0.042826 0.000181 4 0.515136 0.028792 0.43759 0.018444 3.82E-05 5 0.559515 0.01601 0.408442 0.016013 1.95E-05 6 0.600083 0.009039 0.375105 0.015756 1.69E-05 7 0.638335 0.005287 0.340612 0.015749 1.65E-05 8 0.674563 0.003278 0.306364 0.015779 1.63E-05 9 0.708731 0.002205 0.273232 0.015815 1.62E-05 10 0.740691 0.001632 0.241807 0.015854 1.61E-05 11 0.786695 0.000916 0.211664 0.000723 2.04E-06 12 0.818762 0.000505 0.1807 3.29E-05 2.55E-07 13 0.846901 0.000277 0.152821 1.50E-06 3.17E-08 Temperature:386.8488 K Pressure:110KPa
Total flow rate:14.1677 kmole/hr Number of stages: 13
Distillate rate: 23.8 kmole/hr Reflux ratio: 4
Feed stage: 10
Condenser pressure: 101.325 KPa
T-101 FEED
D
Chapter 4 Case Studies and Results
In the simulation results of distillation column, the temperature, pressure, heat condition and gas-liquid flow rate of each tray are as follows:
Table 4.2.8 the simulation results of distillation column
Stage Temperature Pressure Heat duty Liquid from (Mole)
Vapor from (Mole) K kPa kJ/hr kmol/hr kmol/hr 1 384.44 101.325 -4.5584E+06 119 0 2 413.948 102.025 0 45.0558 119 3 513.924 102.725 0 50.8413 68.8558 4 536.197 103.425 0 56.1777 74.6413 5 539.49 104.125 0 56.992 79.9777 6 540.565 104.825 0 57.2373 80.792 7 541.308 105.525 0 57.4234 81.0373 8 541.964 106.225 0 57.6008 81.2234 9 542.577 106.925 0 57.7715 81.4008 10 543.163 107.625 0 78.5491 81.5715 11 559.023 108.325 0 85.8658 78.0814 12 560.379 109.025 0 86.5409 85.3981 13 561.018 109.725 4.57E+06 0.4677 86.0732 Liquid feed (Mole) Liquid product (Mole) Liquid enthalpy
Vapor enthalpy Liquid flow (Mole)
Vapor flow (Mole) kmol/hr kmol/hr kJ/kmol kJ/kmol kmol/hr kmol/hr
0 23.8 26341.8 60299.3 95.2 0 0 0 13810.4 64648 45.0558 119 0 0 28280.8 84344.4 50.8413 68.8558 0 0 33773.3 88732.6 56.1777 74.6413 0 0 34876 88557.7 56.992 79.9777 0 0 36169.3 88782.9 57.2373 80.792 0 0 37823.2 89533.4 57.4234 81.0373 0 0 39655.8 90580.6 57.6008 81.2234 0 0 41531.1 91762.6 57.7715 81.4008 24.2677 0 43365.8 92981.7 78.5491 81.5715 0 0 50517.9 101877 85.8658 78.0814 0 0 52600.9 104056 86.5409 85.3981 0 0.4677 54282.7 105730 0.4677 86.0732
4.5 Summary and Check
Checking the preliminary simulation results of Aspen, the separation requirements were basically met. O-phenylphenol and Dibenzofuran were concentrated in the bottom liquid of the bottom of the column to achieve purification of the target product and recovery of unreacted dibenzofuran.
However, it is still necessary to optimize the operation conditions of distillation column, find the appropriate number of trays, reflux ratio, feed position, operation pressure, etc. to meet the separation requirements while controlling the energy consumption of distillation column, and determine the optimal design scheme of distillation column.
In addition, it is necessary to verify the accuracy of the matlab
programming method for the bubble point temperature calculation of each tray according to the composition, pressure and temperature results of each tray simulated by Aspen.
Number of plates
Aspen simulates the bubble point temperature of each
tray
Matlab calculates the bubble point temperature of each tray
according to the composition deviation 1 384.4400 383.3479 1.0921 2 413.9480 415.1417 -1.1937 3 513.9240 512.5010 1.4230 4 536.1970 535.8647 0.3323
Chapter 4 Case Studies and Results
Table 4.2.9 the deviation of the temperature of the tray obtained by the two methods
By verifying the deviation of the temperature of the tray obtained by the two methods, it is found that the deviation is basically maintained at about one degree (maximum of 1.73 degrees, minimum of 0.3 degrees), which proves that the previous bubble point calculation is correct, and the result is trustworthy. 5 539.4900 539.1873 0.3027 6 540.5650 540.0045 0.5605 7 541.3080 540.4507 0.8573 8 541.9640 540.8054 1.1586 9 542.5770 541.1240 1.4530 10 543.1630 541.4259 1.7371 11 559.0230 560.3528 -1.3298 12 560.3790 561.6877 -1.3087 13 561.0180 562.1261 -1.1081
5 Optimization Design of Distillation Case
Studies and Results
The optimization of the distillation process is based on the objective function to solve the optimal design parameters, such as the number of plates, the feed position, the reflux ratio, the operating pressure, etc., to solve the process and equipment design problems. Under the premise of ensuring product quality and stable operation, the yield is improved by changing the reflux ratio, feed position, feed state, etc., saving energy and reducing consumption.
5.1 Sensitivity Analysis of Tray Number
It presumes the most basic assumptions that are generally made while designing that is constant molar flow of components, i.e., for each stage, molar latent heat of vap
The most important design parameter of distillation column is the number of trays. The more theoretical trays, the better separation effect and the higher manufacturing cost. This needs to find a balance between separation effect and manufacturing cost, to meet the separation requirements of actual production, while reducing the number of trays is to reduce manufacturing costs.
Chapter 5 Optimization Design of Distillation Case Studies and Results
OPHEF represents the flow rate of the target product O-phenylphenol, and OPHEX is its molar fraction.
Analysis of these two data shows that when the number of trays varies from 9 to 15, with the increase of the number of trays, the molar fraction of the target product we hope to obtain decreases, but because the molar fraction of O-phenylphenol in the components is quite small, the effect of the change of the number of trays on the separation effect is negligible. Therefore, the number of trays is not the main factor to consider, only to meet the production requirements.
In addition, considering the need to recycle unreacted dibenzofuran and the separation requirements of solvent toluene, the number of trays in the distillation column should be kept at 13.
5.2 Sensitivity Analysis of Feed Tray Position
It is necessary to find the most suitable feed position at the same number of plates and reflux ratio so that the separation purity of the top and bottom products is highest.
At the same tray number and reflux ratio, the effect of feed position on O-phenylphenol content is shown in the figure below.
Chapter 5 Optimization Design of Distillation Case Studies and Results
It can be seen that the content of O-phenylphenol increases with the decrease of feed position. It is proved that in this distillation system, too high a stripping section will affect the efficiency of the column.
Therefore, in the actual production, under the premise of ensuring the production quality and within the range of possible feed trays, the feeding position can be lowered as much as possible to obtain a better separation effect.
5.3 Sensitivity Analysis of Reflux Ratio
For distillation column, optimizing reflux ratio and theoretical tray number can obtain reasonable temperature distribution in the column, so as to achieve the best separation effect. If the reflux ratio is too low, not only the dry plate of the distillation tray will appear, but also the
separation effect will be poor. Too high will result in waste of energy.
The effect of reflux ratio on O-phenylphenol content is shown in the figure below.
Chapter 5 Optimization Design of Distillation Case Studies and Results
It can be seen that as the reflux ratio increases, the content of the top O-phenylphenol decreases, and there is a tendency to decrease sharply between 1 and 1.6, so decreasing the reflux ratio increases the content of the target product. Simultaneously reducing the reflux ratio reduces the load on the overhead condenser and the bottom reboiler. However, it should also be noted that too small a reflux ratio will affect the normal operation of the distillation column. Therefore, under the premise of ensuring the normal operation of the rectification column, it is necessary to prevent the occurrence of dry plate conditions, moderately reduce the reflux ratio, separate the appropriate O-phenylphenol content and reduce the operation cost.
5.4 Sensitivity Analysis of Feed Pressure
The standard atmospheric pressure is 101 KPa, so for sensitivity analysis of the feed pressure, standard atmospheric pressure is selected as the initial value to find the feed pressure that is most suitable for the separation of the distillation column. Smaller feed pressures reduce operating costs and energy consumption but also require acceptable separation.
The effect of feed pressure on O-phenylphenol content is shown in the figure below.
Chapter 5 Optimization Design of Distillation Case Studies and Results
It can be seen that with the increase of feed pressure, the content of O-phenylphenol will increase until the pressure increases to 110 KPa. Therefore, the optimum feed pressure is to increase the pressure to 110 KPa instead of choosing the normal feed pressure in order to obtain the optimum separation effect.
Chapter 6 Concluding Remarks
6 Concluding Remarks
In the industrial design of the distillation column, it is often encountered that a certain physical property data of the component involved is missing. Therefore, besides the method of querying physical property database, it also needs to rely on reasonable mathematical model and separation theory of chemical engineering to simulate, obtain reasonable design scheme, and then use Aspen and other process simulation software to simulate and optimize the design parameters of distillation column.
For the design optimization of the rectification column, it is necessary to consider the separation effect and obtain the best separation effect, and also need to consider the operating cost of the equilibrium rectification column. Increasing the feed pressure, the number of trays, and increasing the reflux ratio tend to optimize the separation, but at the same time increase the energy consumption and cost of the distillation column. However, when reducing the reflux ratio, it is also necessary to prevent the occurrence of dry plates in the rectification column, affect the normal operation of the rectification column, and increase the risk factor.
In addition, this paper involves the use of Newton iteration to calculate the bubble point and dew point temperature of a multi-component system.
The calculation of bubble point and dew point temperature is the most basic problem that needs to be solved in vapor-liquid separation operation. However, this method requires accurate Antoni equation parameters as a prerequisite to ensure the accuracy of the calculated bubble point and dew point temperature.