POLITECNICO DI MILANO
Msc. In Electrical Engineering
School of Industrial and Information Engineering
CONNECTING PARKS TO THE SMART
GRID:
A Vehicle-to-Grid feasibility study in the
railway station car park of Ferrara.
Report of: Ruben Garruto
Supervisor: Prof. Michela Longo
Acknowledgments
A coronamento finale di questo di questo sfidante percorso di studi nonché di vita voglio qui approfittare per ringraziare di cuore tutte quelle persone che hanno contribuito, direttamente e non, al raggiungimento di questo importante traguardo.
Un sentito ringraziamento alla mia relatrice, la professoressa Michela Longo, per il tempo speso nella revisione di questo elaborato di tesi, per tutti i consigli formali ricevuti e negli spunti chiave fornitomi.
Ringrazio tutti i miei colleghi di Metropark presso cui ho svolto l’attività di stage, in particolare il mio responsabile, l’arch. Fabio Celentani Ungaro, per la fiducia nell’aver voluto investire su di me. Il mio coordinatore d’ufficio, l’arch. Marino Ciaffi per il suo grande spessore umano e professionale e avermi insegnato il semplice ma non per questo scontato concetto che per ogni cosa, nel lavoro e nella vita, “Ci vuole il tempo che ci vuole!”. Ringrazio la mia tutor Elena D’Angelo per la pazienza mostratomi nell’insegnarmi i rudimenti del mestiere, il tempo speso a correggermi e tutti i buoni consigli ricevuti. Gli altri due colleghi del team Gestione Progetti, l’ing. Simona Guidarelli e l’ing. Mario Posillipo, per aver dimostrato concretamente che l’acronimo GP, oltre che per Gestione Progetti stava anche per Grandi Persone. Un enorme ringranziamento va anche a i miei genitori, per tutto l’amore incondizionato riversato nei miei confronti in questi anni, per tutti i sacrifici spesi nel cercare di assicurarmi un futuro sopportando anche il fatto di avermi lontano e per avermi dato la granitica sicurezza che su loro potrò sempre contare. Un ringraziamento a mia sorella Miriam, non riuscirei neanche ad immaginare cosa voglia dire vivere senza aver avuto una sorella come te. Un ringraziamento ad ogni parente ed in particolare a mie zii “Milanesi”, zia Lia e zia Guido per avermi aperto le porte di casa loro e accolto come un figlio e ai miei “cugini-inquilini” Luca e Dario. Un ringraziamento agli “amici di banco” più stretti, Raffaele, Agostino, Nando, Ricardo, Matteo e tutti gli altri, siamo cresciuti insieme in questo percorso ma anche se le nostre strade si sono divise il ricordo di tutte le euforie,i patimenti, le maratone pre-esame, le ansie, i dubbi, le risate rappresenteranno quel filo conduttore che ci terrà uniti anche a distanza di anni. E in ultimo, visto che “la fine di una cosa vale più del suo principio” in ultimo ringrazio Te, Dio, ognuna di queste persone ed esperienze è stato un tuo dono, cosi come ogni singolo respiro. A Te, che sei il miglior Ingegnere, Maestro, Artista, che io conosca. A Te, Abbà.
Abstract
Scopo del presente lavoro è valutare l’impatto energetico apportato alla rete di distribuzione nel punto di allaccio dell’impiato elettrico di un parcheggio ferroviario nel quale sono stati predisposti alcuni punti di ricarica per veicoli elettrici. La prima parte presenta una summa circa l’attuale stato di sviluppo della mobilità elettrica, descrivendo le varie tipologie di veicoli elettrici, le infrastrutture di ricarica e le possibili applicazioni nelle Smart Grid. Nella seconda parte, invece, viene simulata una possibile curva di carico del parcheggio in esame e, sul principio della tecnologia Vehicle-to-Grid, è stato messo a punto un opportuno algoritmo che, sfruttando la possibilità di un flusso energetico bidirezionale tra i veicoli parcheggiati e la rete elettrica, va a ribilanciare la curva di carico dell’impianto sotto esame al fine di evitare pericolosi picchi di assorbimento, di norma difficilmente gestibili dal DSO. Il lavoro presenta anche l’accoppiamento con un impianto fotovoltaico progettato ad hoc per il parcheggio. The purpose of this work is to evaluate the energy impact on the distribution network at the point of connection of an electric plant of a railway car park where some charging points for electric vehicles have been installed. The first part presents a summary of the current state of development of electric mobility, describing the various types of electric vehicles, the charging infrastructure and the possible applications in Smart Grids. In the second part, instead, a possible load curve of the car park in question is simulated and, based on the principle of Vehicle-to-Grid technology, an appropriate algorithm has been developed. Such algorithm, exploiting the possibility of a two-way energy flow between the connected vehicles and the electricity grid, perform a Peak Shaving of the load curve of the plant under examination in order to avoid absorption peaks normally difficult to manage by the DSO. The work also presents the coupling with a photovoltaic system designed specifically for the car park.
Table of Contents
ACKNOWLEDGMENTS ... I ABSTRACT ... III TABLE OF CONTENTS ... V FIGURES INDEX ... VII TABLES INDEX ... XI
CHAPTER 1 ELECTRIC MOBILITY, BETWEEN PAST AND PRESENT ... 13
1.1THE “INNOVATION” OF THE ELECTRIC VEHICLES ... 14
1.2TYPES OF ELECTRIC VEHICLES ... 18
1.3CHARGING OF ELECTRIC VEHICLES ... 23
1.3.1 EV Charging Modes ... 24
1.3.2 EV Connectors type ... 26
1.4ELECTRIC MOBILITY: TOWARDS THE FUTURE ... 31
1.4.1 Smart cities and Smart grid ... 31
1.4.2 Benefits and constraints of the V2G implementation ... 33
1.4.3 A taxonomy of V2G applications ... 36
1.4.4 V2G Pilot Projects ... 38
CHAPTER 2 CASE STUDY: A POSSIBLE V2G IMPLEMENTATION IN THE CAR PARK OF FERRARA ... 43
2.1LOAD ANALYSIS AND ENERGY ABSOPTION OF THE CAR PARK ... 44
2.1.1 Introducing the setting... 44
2.1.2 Description of the electric loads of the car park ... 47
2.1.3 Analysis of the energy absorption of the car park ... 54
2.2DESIGN OF THE PHOTOVOLTAIC SYSTEM ... 57
2.2.5 Producibility of the designed PV plant ... 68
2.3SMART CHARGING OF THE ELECTRIC VEHICLES ... 70
2.3.1 “Green” Algorithm ... 71
2.3.2 “Peak shaving” algorithm ... 74
CHAPTER 3 CONCLUSION ... 77
BIBLIOGRAPHY ... 81
APPENDIX A GLOSSARY ... 85
A.1SOURCE CODE:GREEN ALGORITHM ... 85
Figures index
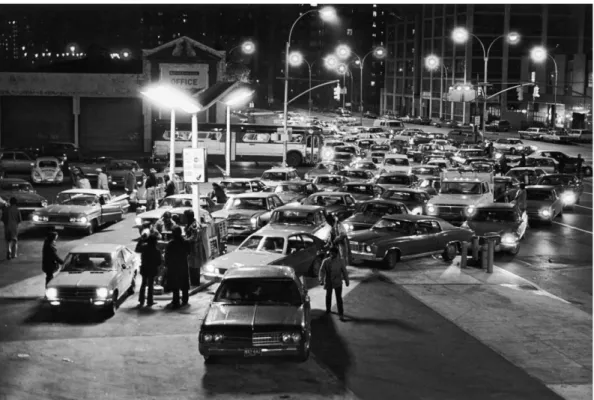
p. Figure 1.1 Cars lining up at a gas station during the 1973–74 oil shortage,
Brooklyn, New York, U.S. 13
Figure 1.2 Passenger electric car stock in major regions and the top-ten EVI
countries. 15
Figure 1.3 StreetScooter was the best-selling electric vehicle of 2017 in
Germany with a market place for 473 vehicles. 15
Figure 1.4 Electric car sales and market share in the top-ten EVI countries and
Europe, 2013-17. 16
Figure 1.5 Hibridization degree of different vehicles. 17
Figure 1.6 Non plug-in Hybrid veichle. 17
Figure 1.7 Plug-in Hybrid vehicle. 18
Figure 1.8 Series PHEV configuration. 18
Figure 1.9 Parallel PHEV configuration. 19
Figure 1.10 Series-Parallel PHEV configuration. 19
Figure 1.11 Extended range vehicle. 20
Figure 1.12 Battery electric vehicle. 20
Figure 1.13 Fuel Cell vehicle. 21
Figure 1.14 Example of a generic charging load for a generic EV. 21
Figure 1.15 Example of an uncontrolled public charging. 21
Figure 1.16 Example of different types of connections. 25
Figure 1.17 Example of shuko plug with a type-1 adapter. 25
Figure 1.18 Renault twizy connected to a domestic socket. 26
Figure 1.19 Type 1 plug. 26
Figure 1.20 Details of the pins configuration for type 1 connection. 26
Figure 1.21 Type 2 plug. 27
Figure 1.22 Details of the pins configuration for type 2 connection. 27
Figure 1.23 CHAdeMO plug. 28
Figure 1.24 Diffusion of the CHAdeMO charging type in Europe. 29
Figure 1.27 Conceptual architecture of a VPP aggregator. 32
Figure 1.28 Main aggregator functionality. 32
Figure 1.29 Example of the improvement due to a Load balancing. 33
Figure 1.30 G2V operation mode. 34
Figure 1.31 V2G operation mode. 34
Figure 1.32 H2V operation mode. (a) Combined with G2V. (b) Combined with
V2G. 35
Figure 1.33 V2H operation mode. (a) Operation in isolated system. (b)
Operation as offline UPS. 35
Figure 1.34 V4G operation mode. (a) Producing reactive power. (b)
Compensating current harmonics. 36
Figure 1.35 Wind power generation and demand during 3 weeks of January 2008 in the western Danish area with: a) current wind power penetration and b) when assuming 50% wind power penetration.
37 Figure 1.36 Bird-eye view of medium-sized virtual EV fleet. 38 Figure 1.37 EDISON Operator panel. 1) Selected vehicle 2) fleet summary stats 3) selected vehicle status 4) Veichle characteristics 5) EV’sGPS locations 6) recorden and predicted availability of the vehicle 7) energy prices 8) charging schedule.
38
Figure 2.1 Top view of the city of Ferrara. 42
Figure 2.2 Top view of the parking lot. 43
Figure 2.3 Parking statuts ante-operam. 43
Figure 2.4 Planimetry of the executive project of Ferrara parking area. 44
Figure 2.5 Detail of the lamp installed in the car park. 45
Figure 2.6 Load curve of the lighting system. 46
Figure 2.7 Access point of the car park. 46
Figure 2.8 Load curve of the entry/exit system. 47
Figure 2.9 Camera of the video surveillance system. 47
Figure 2.10 Load curve of the video surveillance system. 47
Figure 2.11 Technical room of Ferrara’s car park. 48
Figure 2.12 Load curve of the technical room. 48
Figure 2.13 Electric vehicle supply equipment. 49
Figure 2.14 Power absorption of EVSE at different power levels. 51
p. Figure 2.16 Overall daily energy absorption of the car park. 53 Figure 2.17 Data plate of the general electric panel of the car park. 54 Figure 2.18 Example of unctrolled charging of the 5 EVs implemented in the car park.
55 Figure 2.19 Bird-eye view for the site of interest, Ferrara car park. 56
Figure 2.20 Daily Irradiance in Ferrara for each Month. 57
Figure 2.21 NeON® 2 BiFacial panel. 58
Figure 2.22 Comparison between a conventional cell and a bifacial cell. 58 Figure 2.23 Albedo index for different surfaces and the relative bifacial gain. 59 Figure 2.24 Characteristic curves of NeON® 2 BiFacial panel. 59 Figure 2.25 Bifacial gain considering the mounting conditions. 61
Figure 2.26 Concept of installation (top view). 62
Figure 2.27 Concept of the installation. 62
Figure 2.28 Main topology of the PV system. 64
Figure 2.29 Arrangement of the strings. 64
Figure 2.30 Arrangement of the panels in series in one string. 65 Figure 2.31 Daily output power of the PV plant month by month. 67
Figure 2.32 Overall monthly producibility of the PV plant. 68
Figure 2.33 PV production and load curve of the car park compared. 71 Figure 2.34 PV production and load curve of the car park compared. 72 Figure 2.35 Comparison between the old load curve and the new one. 73
Figure 2.36 Net power production and Power absorption. 73
Figure 2.37 Final energy absorption of the car park. 74
Figure 2.38 Operating principle of the "Peak Shaving" algorithm. 75 Figure 2.39 Comparison between the Old Load curve and the New Load Curve generated by the Peak Shaving Algorithm.
76
Tables index
p. Table 1.1 Typical charging times for a generic medium-sized electric car. 24
Table 1.2 Pins configurations for type 1 connection. 27
Table 1.3 Pins configurations for type 2 connection. 28
Table 2.1. Technical data: lighting system. 45
Table 2.2 Technical data: Access point. 46
Table 2.3 Technical data: video surveillance system. 47
Table 2.4 Technical data: electric vehicle supply equipment. 50
Table 2.5 Technical data: Nissan Leaf 2018. 52
Table 2.6 Charging time of Nissan Leaf at different Power levels. 52
Table 2.7 Overall energy absorption of the car park. 55
Table 2.8 Technical data of NeON® 2 BiFacial panel. 60
Table 2.9 PV plant summary data. 63
Table 2.10 Technical data: Inverter. 63
Table 2.11 String/Inverter Matching conditions. 65
Table 2.12 String/Inverter Matching conditions (calculations). 66
CHAPTER 1
ELECTRIC MOBILITY, BETWEEN PAST
AND PRESENT
If compared to ten years ago, electric mobility is becoming a reality increasingly present in everyday life. However, we are still far away to talk about a real ‘electric revolution’ but the steps towards this new way of conceiving mobility are begun and to date, in 2019, we can already notice the developments undertaken by this sector. If we take a careful look around us, it is now common experience to notice the ever-increasing percentage of electric cars, especially those related to car sharing fleets. Moreover, as regards the recharging infrastructures, an attentive observer can note their major widespread in our city. The following chapter presents a general discussion of the panorama concerning electric mobility, particularly, in this chapter you will find:
▪ A brief introduction concerning the actual devolpment of electric vehicles in the world; ▪ the different types of Electric Vehicles (EVs) currently present according to their hybriditation degree, the various charging methods and the related infrastructure of the electric vehicle supply equipment;
▪ the concept of Smart Grid will be presented, a fundamental starting point in which the idea of Vehicle-to-Grid is grafted .
▪ the basic idea of the the Vehicle-to-Grid will be laid, describing the basic principles, the different possible applications and the different pilot projects started.
1.1 The “innovation” of the electric vehicles
Wanting to take a long step back in time, the debate about the use of electric mobility find its roots since the end of the 19th century. Even before the manifestation of the various problems related to the massive use of a type of transport related to fossil fuels, already in 1898, following a contest in which several prototypes of cars (both electric and with internal combustion engine) were presented, the jury of the time announced, almost with a prophetic vision that: " It seems clear that petrol coaches cannot sustain a public car operating system in a large city."1
In fact the first years of the '900 knew mainly the evolution of these means of electric transport [2]. Electric cars seemed preferable to petrol cars that were noisy, with the risk of fire and explosion, with annoying vibrations and smoky exhaust gases. Furthermore, manual gearbox and cranking made them difficult to use. It is true that, for the first electric cars, the distances that could be covered were small (up to 80-90 km) but since the mobility of the time was still confined to a purely citizen transport, this did not constitute an obstacle, at least in an initial phase. But then, the situation seemed destined to change in favor of means of transport with internal combustion engine, following:
▪ The advent of massive mass production introduced by Ford with the famous T model; ▪ the reduction of the oil price;
▪ the extension and improvement of the road network which allowed ever greater distances to be traveled.
All these factors turned the needle of the balance towards fossil fuel mobility which became predominant throughout the 20th century up to the present day.
The oil crisis of the 70s and the consequent economic crisis, however, put in evidence the fragility of an economic system based mainly on fossil fuels which, in addition to their obvious limitations and being heavily polluting the environment, find their main location in territories characterized by profound political instability. This crisis prompted world governments to radically change their assets with the aim of reducing the dependence of the western economy on Middle Eastern oil sources, through the reduction of consumption, the reorganization of industrial production, the search for alternative energy sources. The crisis obviously also
1Original version: “Il semble désormais acquis par l’expérience que le fiacre à moteur à essence de pétrole ne saurait constituer un système d’exploitation de voitures publiques dans une grande ville” [1].
The “innovation” of the electric vehicles
involved the transport sector and the switch to an electric transport mode, until then relegated to niche applications, began to be taken into consideration again.
Fig 1.1 Cars lining up at a gas station during the 1973–74 oil shortage, Brooklyn, New York, U.S. [2].
As mentioned in the introduction to this chapter it is not yet possible to talk about a real ‘electrical revolution’, although the environmental theme is becoming nowdays more prominent than ever, together with the fact that fossil fuels will become an increasingly rare resource2 so, the switch to an electrical type of mobility has become the hot topic of the last ten years. As stated in [3], currently, concerning the Europe panorama, the transportation sector occupy the fourth place as greenhouse gas emitter with a share of 14%. A greater diffusion of an electric type mobility could therefore reduce this portion by also going to mitigate the increasingly critical problem of pollution in urban centers. This diffusion is however discouraged, today, by factors of different nature including:
▪ the still high costs of electric vehicles available on the market compared to traditional vehicles with internal combustion engines (ICE);
▪ the charging times that are still too high;
2An oil reserve of 70-100 years is estimated, considering the current consumption rate and the oil fields known so far.
▪ the anxiety range as the energy that can be stored in the batteries allows to reach, in the average, a distance between 100 and 300 km;
▪ the charging points are present but still not so widespread;
▪ the production and disposal of batteries which raises various environmental and ethical problems.
On the other hand, cars powered exclusively by electricity have several advantages, such as: ▪ They do not need fossil fuels to work and therefore can be charged exploiting
renewable sources;
▪ introduce zero pollutants at the local level;
▪ they are much less noisy than their rivals with internal combustion engine; ▪ they enjoy many incentives that somehow go to buffer the initial purchase costs; ▪ Moreover, even the price per kilometer traveled is cheaper compared to petrol
transport.
Despite the initial problems and criticalities linked to the switch from thermal towards electric mobility, to accelerate and control the deployment of electric vehicles worldwide, since 2009 a multi-governmental3 initiative began, under the clean energy Ministerial, the so-called Electric Vehicles Initiative (EVI) [5]. The most recent initiative proposed by the EVI is the EV30@30 Campaign [6], launched at the Eighth Clean Energy Ministerial in 2017 in Beijing (China); the aspirational goal of this campaign is to reach 30% sales share for electric vehicles by 2030. The main actions to reach this include:
▪ Provide support to the governments in need of policy and technical assistance; ▪ Promote programs (such as Global EV Pilot City Programme) to facilitate the exchange
of experiences in the EVs field and propose the best practices for the promotion of EVs in cities;
▪ Encouraging public and private sector commitments for EV uptake in company and supplier fleets;
▪ Supporting the deployment of EV chargers and tracking progress.
According to [5] in 2017 the global stock of electric passenger cars reached 3.1 million (Figure 1.2), with a relevant increase of 57% with respect to 2016 and approximately two-thirds of the world’s electric car fleet are battery electric vehicles (BEVs). In addition to the 3.1 million
3 Governments currently active in the EVI include Canada, the People’s Republic of China (“China”), Finland, France, Germany, India, Japan, Mexico, Netherlands, Norway, Sweden, United Kingdom, United States, Chile and New Zeland.
The “innovation” of the electric vehicles
passenger electric cars, there were nearly 250,000 electric light commercial vehicles (LCVs) on the road in 2017. The largest electric LCV fleet is in China (170,000 vehicles), followed by France (33 000 vehicles) and Germany (11 000 vehicles). Electric LCVs are often part of a company or government fleet. For instance, the DHL Group, a major logistics company, operates with the largest electric vehicle fleet in Germany (16 000 electric vans, bicycles and tricycles). It has also undertaken in-house development and manufacturing of its own electric vans (see fig 1.3) tricycles and bicycles as part of this vision. Strong of the success obtained the company is now selling its electric vehicles to third parties (mainly municipalities and other businesses) [7].
Fig 1.2 Passenger electric car stock in major regions and the top-ten EVI countries [5].
Fig 1.3 StreetScooter was the best-selling electric vehicle of 2017 in Germany with a market place for 473 vehicles [7].
Regarding the sales of EVs, the 2017 was marked by over one million vehicles sold worldwide, an increase of about 50% compared to the previous year even if the total number of sales is still modest to be able to talk about an electric mobility revolution. As it is possible to see from figure 1.4 the two leading nations in this sector are Norway and China, for different merits. Regarding China, it has the largest car market and nearly 580.000 electric cars were sold there in 2017. On the other hand, Norway can boast greater market penetration for electric vehicles as about 39% of vehicles sold in 2017 were electric.
Fig 1.4 Electric car sales and market share in the top-ten EVI countries and Europe, 2013-17 [5].
1.2 Types of electric vehicles
So far we have analyzed the evolution and current spread in the world of electric vehicles, but as we will see in the following paragraph, their typology is quite varied. So let's start by draw out a possible definition of an electric vehicle. In general, an electric vehicle is that vehicle that exploit some form of energy to fed electric motor for the propulsion. Not all electric vehicles are all the same but differ according to the so-called hybridization degree (Figure 1.5), the ratio between the secondary source and the total power. it is therefore possible to recognize 5 main categories based on the type of power supply:
▪ Hibrid electric vehicle (HEV)
▪ Plug-in hybrid electric vehicle (PHEV)
▪ Extended Range hybrid electric vehicle (EREV) ▪ Battery electric vehicle (BEV)
Types of electric vehicles
Fig 1.5 Hibridization degree of different vehicles [8].
▪
Hybrid Electric Vehicle
(H-EV)
HEV exploit, simultaneously or separately, the combination of the internal combustion engine (ICE) and the electric motor. The presence of the electric powertrain is intended to achieve either better fuel economy than a conventional ICE vehicle or better performance. For instance, Many HEVs reduce idle emissions by shutting down the engine at idle and restarting it when needed (start-stop system). the electric powertrain is used to deliver a high Fig 1.6 Non plug-in Hybrid veichle [9].
torques during the vehicle start-up phase reducing fuel consumption. The batteries are not rechargeable from mains, but only by the regenerative braking system and from the ICE equipped with a suitable generator. A hybrid-electric produces less tailpipe emissions than a comparably sized gasoline car, since the hybrid gasoline engine is usually smaller than a comparably sized, pure gasoline-powered vehicle and if not used to directly drive the car, can be geared to run at maximum efficiency, further improving fuel economy.
▪
Plug-in
Hybrid
Electric
Vehicle (PH-EV)
PH-EV is based on the same concept of HEV. but, while in a normal hybrid vehicle the battery cannot be recharged from the outside, in the case of a PH-EV the vehicle is also equipped with a socket that allows the recharge of the battery from an external source. This allow to increase the driving range of the vehicle and decrease the cost of charge (wrt. HEV) since the Fig 1.7 Plug-in Hybrid vehicle [9].
electric energy produced by the main network is cheaper than the electric energy produced on board. running on electricity until their battery pack is depleted: ranges vary from 15 kilometers to over 65 [11].
However, depending on the type of connection it is possible to recognize three different arrangement: Series PHEV, Parallel PHEV and Series-Parallel PHEV. Figure 1.8 shows schematically the configuration of PHEV series. In this example the vehicle has one electric traction motor. The energy is provided by the generator linked to the ICE or by the storage system.
Fig 1.8 Series PHEV configuration [8].
Figure 1.9 shows, instead, a Parallel PHEV configuration. It is possible to have three different arrangement:
▪ In Case A, the mechanical transmission receive power both from the ICE and the electric motor.
▪ In Case B, ICE and electric motor are mounted on the same shaft. This configuration allows also to recharge the storage system when the car is stopped, since the motor can act also as generator.
Types of electric vehicles
▪ In Case C the two motor are decoupled. The rear wheel-set is driven by an ICE while the front wheel-set is driven by an electric motor feeded by a storage system. This configuration doesn’t allow the recharge of the battery with the ICE as in the case B.
Fig 1.9 Parallel PHEV configuration [8].
Finally, it is also possible to have a combination of series and parallel configuration, as shown in figure 1.10. In this example both electric motor and ICE are linked to the same shaft, but the ICE can be decoupled from the shaft through a clutch allowing series or parallel configuration depending on the need. When decoupled, the ICE can feed the electric motor through a generator and AC/DC-DC/DC stages. Or can also recharge the battery when the vehicle remains stopped. In this case, just one system supplies the electric motor at a certain instance. In parallel configuration the traction is guaranteed both from mechanical power provided by the ice and the electric motor feeded by the storage system.
▪
Extended Range Electric Vehicle
(ER-EV)
ER-EV can be considered a kind of hybrid vehicle even if this definition is not completely correct. in fact, the traction of the vehicle, in any case, relay on the electric motor. the difference between a hybrid vehicle lies in the fact that a ER-EV, is equipped with a small ICE that allows the recharge of the battery to extend the driving range. In some application it is also possible to have a fuel cell generator. The drawback is an increase of the weight of the vehicle.
Fig 1.11 Extended range vehicle [9].
▪
Battery Electric Vehicle (B-EV)
BEV is an electric vehicle powered integrally from the battery pack, often coupled with a regenerative braking system.
The battery is recharged by connecting the vehicle to the electric grid. BEVs don’t have any tailpipe emissions and possess the highest value of hybridization degree.
Fig 1.12 Battery electric vehicle [9].
▪
Fuel Cell Electric Vehicle (FC-EV)
In the case of FC-EV the electric energy is produced on board by a fuel cell generator, eventually coupled with batteries to exploit the regenerative braking and help the vehicle during the start-up phase. However, the FC-EVs presents some criticalities to overcome, such as: lack of a dedicated infrastructure, high costs of the overall system and a relative low thank-to-wheel efficiency (≈ 40%).
Charging of electric vehicles
Fig 1.13 Fuel Cell vehicle [10].
1.3 Charging of electric vehicles
Obviously, when we talk about electric vehicles, beyond the vehicle itself, we cannot ignore even the "fixed" infrastructure part, represented by the Electric Veichle Supply Equipment (EVSE). It is clear that the batteries inside the EVs, necessary for storing energy for propulsion, have to be somehow recharged.
Fig 1.14 Schematic of a charging load for a generic EV [22].
And it is absolutely not to be underestimated the critical impact that such systems could determine in the distribution network. An EV, taking into account the ever increasing levels of both power and storage capacity of the various models proposed by the manufacturers, can be assimilated, from an energy point of view, a full-flegged small apartment "on wheels" [20]. It therefore appears evident that the installation of the various EVSEs, whether in a
Fig 1.15 Uncontrolled public charging [22].
public or private environment, deserve special attention in the design stage in order to ensure optimal coordination with the distribution network as it directly impacts the power demand [21]. As an example, figures 1.14-1.15 show, respectively, a generic power curve of a battery in charge and the impact on the daily load demand in a public parking lot with an uncontrolled charge of electric vehicles at different penetration level [22].
In the remainder of this paragraph than, we will go on to analyze the various ways of recharging foreseen by the standards and the various types of connections that are currently affirming in the market of EVSEs.
1.3.1 EV Charging Modes
Let’s now analyze the the various modes of recharging foreseen by the standards. The European standard IEC 62196 [13] sets four different charging modes based on different power charging levels, protection systems and connector types:
▪ Charging mode 1 (home charging without PMW) it is the simplest way of connection. The EV is directly connected to the AC supply network (single-phase or three-phase) without any control contacts, using standardized socket outlets with a maximum current allowed of 16 A and not exceeding 230 V (single-phase) or 400 V (three-phase).
▪
Charging mode 2 (home/company charging with PWM) The EV is connected to the AC supply network (single-phase or three-phase) not exceeding 32 A and not exceeding 230 V (single-phase) or 400 V (three-phase) using standard socket (max. 22 kW). The cable is equipped with a Control Box (PWM safety system) that ensures the safety of operations during recharging.▪ Charging mode 3 (public spaces charging) this type of connection is mandatory for public places. The EV is connected to the AC supply network using Electric Vehicle Supply Equipment (EVSE). Therefore, the control pilot has also to control the safety equipment of the EVSE, permanently connected to the AC supply. The communication cable between the vehicle electronics and the charging station enables integration with smart grids (See par. 1.4).
▪ Charging mode 4 (FAST DC connection) The EV is connected to the AC supply network using an off-board charger where the control pilot is responsible also for safety of the equipment permanently connected to the AC supply. In mode 4 the charger is no longer in the vehicle but in the charging station.
Charging of electric vehicles
Below, the main characteristics of the various charging modes are summarized.
Charging mode 1 Charging mode 2
EV directly connected to the AC supply network. No control contact.
the safety depends on the presence of adequate protections on the system side: protection against overcurrents, earthing system, protection against contacts,etc.
Ev connected to the a.c supply network. Presence of in-cable control box to ensure safety.
Charging mode 3 Charging mode 4
EV directly connected to the grid through dedicated supply equipment. existence of a pilot control contact between the supply equipment and the EV performing different functions:
▪
Correct inserting of the connectors.▪
monitoring of the continuity of theprotective conductor.
▪ Performing an active control on the recharge.
EV indirectly connected to the grid through an off-board charger installed directly in the dedicated supply equipment.
1.3.2 EV Connectors type
In order to recharge the batteries present on board of the EVs a suitable connection must be made between the vehicle and the supply network. The fundamental parameters to take into account that can drastically affect the recharging time are:
• The rated battery capacity installed on-board (typically 20-80 kWh). • The initial state of charge of the EV (SOC).
• Rated charging power of the Electric Vehicle Supply Equipment (EVSE). • The actual power that can be withdrawn from the network.
Depending on these factors, the charging time can range from few minutes up to 10 hours or more. Table 1.1 shows typical charging times for a generic medium-sized electric car.
Tab. 1.1 typical charging times for a generic medium-sized electric car [12]. Recharge Power Autonomy reinstate in Times required to
reinstate 10 km 1 h 15 min AC Slow 3.3kW 13-15 km 3-5 km 40-45 min Fast 22 kW 90-100 km 25-30 km 6-7 min 43 kW Complete 50-60 km 3-4 min
DC Fast 50 kW Complete 60-70 km 2-3 min
Concerning the modes of charging and the connectors currently available, as often happens when a new technology begins to develop, as there are no standards or predefined protocols, there is always a first initial phase in which different products that perform the same function take place, often independently. The same applied to electric vehicle charging systems that have experienced the development of a varied amount of connectors and protocols promoted by the various companies that have worked in the development of this new technology. But once the technology is developed, the main objective must be to achieve the interoperability of the charging systems without neglecting performance, safety and economy. At present, the European standard, which contains the requirements for charging electric vehicles, is the CEI EN 61851-1: 2012-05 Standard: "Conductive charging system for electric vehicles - Part 1: General requirements" [13].
Charging of electric vehicles
Basically, as figure 1.16 shows, there may be three different connection configurations: ▪ Configuration A: the electric vehicle is connected to the charging point by using a
power cord and a plug permanently attached to the vehicle itself.
▪ Configuration B: the electric vehicle is connected to the charging point by using a removable power cord provided with the relative plug.
▪ Configuration C: the electric vehicle is connected to the charging point by using a power cord and a plug permanently attached to the supply equipment.
Fig 1.16 Type of connection for the recharge [12].
Beyond the type of connection, regarding the connectors, nowdays in the electric vehicle market it is possible to find different models and brands with different configurations and technical characteristics. Below, some type of connector are described:
▪ Schuko plug is the common name for a system of plug and socket for alternating current, defined as CEE 7/4, present in many European countries. It has a ground connection, two terminals and supports current of up to 16 Amps, so it is only compatible with slow recharges. It is common in some motorcycles and electric bicycles, even in some electric car like the Twizy (fig 1.18).
Fig 1.18 Renault twizy connected to a domestic socket.
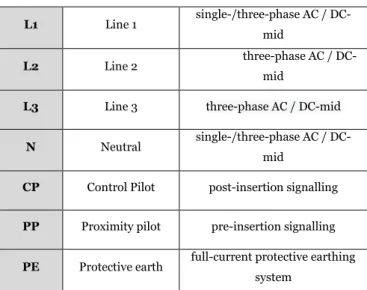
▪ Type 1 (SAE J1772) also known as "J plug" (fig.1.19), is a North American standard for electrical connectors for electric vehicles. It is characterized by five pin-and-sleeve, two active conductors (L1-N), one for the earthgrounding (PE) two for the signaling (PP and CP). The type 1 connector can also have an additional configuration that implements the Fast Recharge trough a DC connection (fig.1.20) allowing the recharge of the vehicle up to 200 A (90 kW) [17]. The power pins do not carry energy until the proximity and control pins are inserted. The latter are structured in such a way as to be the first to slip off when you want to interrupt the charging process. The physical button of the connector instead acts on the proximity pin that commands the vehicle's onboard charger to open up. Once the vehicle charger is open, the control pin cause the power relay in the charging station to open cutting all current flow to the J1772 plug. This prevents any arcing on the power pins, prolonging their lifespan [14].
Fig. 1.19 Type 1 connection. Fig.1.20 Details of the pins
configuration for type 1 connection [14]. N L1 PE PP CP DC connection
Charging of electric vehicles
Tab 1.2 pins configurations for type 1 connection. L1 Line 1 Single-phase AC
N Neutral Single-phase AC
CP Control Pilot post-insertion signalling
PP Proximity pilot pre-insertion signalling
PE Protective earth full-current protective earthing system
▪ Type 2 (Mennekes) also known under the name of Mennekes, from the name of the company specialized in industrial plugs and connectors, that proposed this configuration in 2009. Type 2 connector is a connector widely used especially in Europe. Generally, the cars that mounting this type of connector present male vehicle inlet, whilst charging station are fitted with a female outlet, either directly on the outside of the charging station, or via a flexible cable with permanently attached connector on the end. As figure 1.21 shows the type 2 connector presents 7 different pins, 4 pins for the power supply (L1,L2,L3,N), one for earth grounding (PE) and two for signaling (PP, CP).technically, this type of plug can support a maximum voltage of 480 V and absorb a maximum current of 300 A for a theoretical charging power up to 144 kW [15].
Fig.1.21 Type 2 connection. Fig. 1.22 Details of the pins configuration for type 2 connection.
Tab 1.3 pins configurations for type 2 connection. L1 Line 1 single-/three-phase AC /
DC-mid
L2 Line 2 three-phase AC / DC-mid
L3 Line 3 three-phase AC / DC-mid
N Neutral single-/three-phase AC / DC-mid
CP Control Pilot post-insertion signalling
PP Proximity pilot pre-insertion signalling
PE Protective earth full-current protective earthing system
▪ CHAdeMO is the trade name of a quick charging method proposed by an association of the same name in 2010. The origin of the name come from a Japanese phrase “O cha demo ikaga desuka“ that literally means, “How about a cup of tea?" in order to remark the quick charge nature of this connection. Most electric vehicles have an on-board charger that uses an AC/DC rectifier in order to recharge the EV's battery pack but, since CHAdeMO works at very high power (up to in 400 kW in some tests experiments [19]) for thermal issues limit, the charger is installed directly in the EVSE, dropping the CHAdeMO charging protocol in mode 4 recharge.
Figure 1.23 shows the design of this type of connector while figure 1.24 shows the diffusion of the EVSE that mount this technology in some part of Europe.
Electric mobility: towards the future
Fig. 1.24 Diffusion of the CHAdeMO charging type in Europe [16].
1.4 Electric mobility: towards the future
In paragraph 1.1 we analyzed the potential and criticality of electric mobility and its current level of penetration.
In paragraph 1.2 we discovered that the world of electric vehicles is not unique but has a varied classification within it.
In paragraph 1.3 the main charging methods and charging systems were analyzed, presenting the major technologies currently available.
In this concluding paragraph instead, we close the path focusing attention on possible future developments that electric vehicles could bring to the distribution network. Conceiving them therefore not only as mere passive loads but as active devices able to bring benefits to the electric network to which they are connected. This possible use, now established with the acronym of V2G (Vehicle-to-grid), goes directly to the more general concept of Smart Grid of which a brief summary is proposed below. Once this has been clarified, we will see what exactly is meant by the term V2G, what are its potentials and what are the current pilot projects.
1.4.1 Smart cities and Smart grid
As already underlined, electric mobility represents a necessary transition to get rid from a mode of transport still too dependt to the use of fossil fuels, harmful to the environment and whose discharges make urban centers increasingly unlivable. Electric mobility, being one of the branches of the "Smart Mobility", is therefore part of one of the pillars of the so-called "Smart Cities", that set of urban planning
strategies and plans aimed at ensuring sustainable economic development and high quality of life through a skilful management of available resources (food, mining, energy, services etc.). The fundamental pillars of a Smart City are six as shown in figure 1.25 [23].
Fig. 1.25 The six pillars of a Smart City.
The pillar we are interested in is, therefore, that of the "Smart Mobility". However, it would be reductive to limit the issue of "Smart Mobility" to the mere switch from a type of transport with an internal combustion engine to one with an electric motor. In reality, the "Smart Mobility" is a much broader concept involving different stakeholders (Public administrations, private,public or mixed companies, end users etc.) and technologies/services (car sharing, autonomous drive, trip planni app etc.) but whose specific treatment is outside the scope of the following work. In this work we will deal instead with the aforementioned concept of Vehiclel-to-grid. Nowdays, in reality, the concept of the electric vehicle is still of the "passive" type, of the Grid-to-Vehicle type (G2V), coinceved to mere electric load However, this paradigm could be destined to change in the immediate future. The idea of the V2G fits into the more general concept of the so-called "Smart Grid". A possible and exhaustive definition taken from [24] of Smart Grid is the following: “A smart grid is an electricity network based on digital technology that is used to supply electricity to consumers via two-way digital communication. This system allows for monitoring, analysis, control and communication within the supply chain to help improve efficiency, reduce energy consumption and cost, and maximize the transparency and reliability of the energy supply chain.”
The current electrical system has its origins since the beginning of the 20th century and was conceived as an exclusively unidirectional system [27], consisting of relatively few production centers and many users, with all the limitations and disadvantages that this entails, including :
Electric mobility: towards the future
▪ High Joule losses due to the long distances that connecting production centers and end users; ▪ Difficulties in managing energy flows caused by the high uncertainty of the distributed
generation (wind, photovoltaic, etc.) and lack of protocols in dynamic energy management; ▪ Response times too long in case of failures or malfunctions with consequent inefficiencies. Therefore, its evolution in the "Smart Grid" foresees the overcoming of these limitations with the introduction in the electric network of real-time embedded sensors and automatic control systems in order to:
▪ realize a real time grid monitoring to have a permanent awareness of the network’s parameters, voltage and current measurements, grid events detection etc;
▪ detect any malfunctioning, reducing repair times and maintenance costs;
▪ optimize the energy consumption of the end user who becomes more aware of his own consumption and act accordingly, even remotely;
▪ exploit and better coordinate the various small distributed production centers.
Fig. 1.26 Evolution from a traditional grid to a Smart grid [25].
1.4.2 Benefits and constraints of the V2G implementation
On the possible benefits and limitations imposed by a possible implementation of V2G there are researches on research, many of them even reaching results that are in contradiction with each others (see for instance [28]), but what are the advantages given by a possible exchange of energy between electric vehicles and the distribution network?
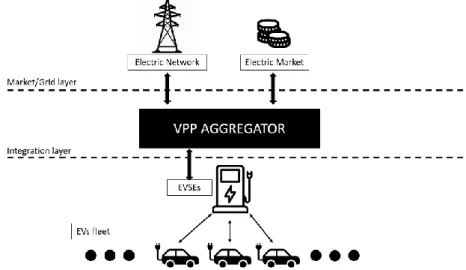
Let's start by saying that a hypothetical fleet of electric vehicles connected to the network could be managed as a virtual power plant (VPP). In this case an aggregator would be interfaced simultaneously with the electricity grid, market and connected fleet in order to maximize recharge performance (see [33] for more in-depth informations about this topic). This aggregator should therefore be able to:
▪ Have access to historical data concerning market prices and fleet behavior to forecasting purpose;
▪ Manage these data in order to achieve the fleet charging cost minimization and fulfill grid constraints;
▪ Interface with the EVs through the EVSE in order to analyze user preferences also and generate the optimum charging schedule.
Fig. 1.27 Conceptual architecture of a VPP aggregator.
Fig. 1.28 Main aggregator functionality.
Optimum charging schedule
Users preferences Grid constraint Grid/fleet Historical/actual data
Electric mobility: towards the future
Therefore, the ultimate goal of the aggregator would be to:
▪ On the user side, guarantee the most convenient charging option in accordance with his charging needs.
▪ From the side of the network manager (DSO & TSO) should be able to exploit the VPP in order to provide ancillary services such as voltage and frequency regulation, peak shaving etc. [29]
Fig. 1.29 Example of the improvement due to a Load balancing [32].
As we can guess, the V2G represents a complex systemic reality that involves different stakeholders and that today faces many challenges including, first of all, the degradation of the batteries which obviously can perform a limited number of charge/discharge processes but also the costs related to the infrastructure to be implemented and the correct management of the data to be processed to make the system reliable, secure and scalable. In particular, according to what is written in [31] to make V2G economically feasible the following must happen:
▪ The local utility jurisdiciton must have a need for ancillary services; ▪ An ancillary market should be in place;
1.4.3 A taxonomy of V2G applications
The following section presents the main operational cases in which an EV could perform depending on the different connection characteristics. These differences are detailed in [26] and [28], a brief but comprehensive taxonomy is proposed.
▪
Grid-to-Vehicle operation mode (G2V)
It represents the simplest case you can imagine applied to the recharge of an electric vehicle. Essentially, it consists of recharging the battery that is connected to the Power network without considering any other operation. The EV is simply conceived as a load to the system.
Fig. 1.30 G2V operation mode [23].
▪
Vehicle-to-Grid operation mode (V2G)
Although the G2V mode is the main operation mode for an EV, the possibility of a bidirectional energy flow can be helpful for the grid during some periods of time (i.e. stabilize the load profile and support large-scale renewable energy resources). In V2G operation mode the battery charger can be used to deliver part of the energy stored in the batteries back to the power grid. In a smart grid scenario, this operation mode is supposed to be controlled by the power grid manager and in accordance with the EV driver.
Electric mobility: towards the future
▪
Home-to-Vehicle operation mode (H2V)
Figure 1.32 shows the H2V operation mode applied both in G2V (a) that V2G (b) operation mode. In the first case the power absorbed by the EV battery take in to account the power absorbed by the electrical appliances of the home, in accordance with the maximum power signed in the contract with the electricity service provider. Therefore, a communication between the Smart-Meter of the home and the Charger of the EV must be provided. The measured signal is used by the control system of the charger to adjust its own instantaneous current in accordance with those values. This functionality aims to prevent overcurrent trips of the main circuit breaker installed in the home. Of course, the H2V operation mode can be perfectly integrated with V2G operation mode.
Fig. 1.32 H2V operation mode. (a) Combined with G2V. (b) Combined with V2G [23].
▪
Vehicle-to-Home operation mode (V2H)
In this case the electric vehicle connected to the home network acts as a voltage generator powered by the EV’s battery. Two different operating modes can be recognized. The first operational mode (a) is that of an isolated system with respect to the power grid and all the Home appliances are fed by the EV. In the second one operational mode (b) the EV battery charger is used to operate as offline UPS.
Fig. 1.33 V2H operation mode. (a) Operation in isolated system. (b) Operation as offline UPS [23].
▪
Vehicle-for-Grid operation mode (V4G)
In this operation mode the EV can perform ancillary services for the grid such as the production of inductive or capacitive reactive power, or to act as a filter to compensate current harmonics. The great advantage of this operation mode is that the total rated power of the EV battery charger can be used without using any energy from the batteries, therefore it doesn't cause age nor reduces the life span of the battery.
Fig. 1.34 V4G operation mode. (a) Producing reactive power. (b) Compensating current harmonics [23].
1.4.4 V2G Pilot Projects
“We proved the technical feasibility of vehicle-to-building five years ago. The next challenge is economics”
(Project representative, Mitsubishi Corp.)
At the end of this chapter we will now go on to list the main projects that have been carried out in various parts of the world in order to assess the feasibility and impact of V2G
▪
EDISON Project - Denmark
In 2007 [34] the Danish government decided to implement a long-term environmental policy with the aim to obtain a complete independence from fossil fuels, coal and natural gas. One of the various objectives to achieve was the increase of at least 30% in the penetration of renewable sources with respect to the overall production by 2025. The instability linked to renewable sources (in fig. 1.32 can be noted that in some periods of the year even exceeded the load demand) made the idea of developing and increasing the penetration of electric mobility attractive for several reasons, including:
Electric mobility: towards the future
▪ The low average driving distance of Danish motorists (about 40 km) ; ▪ The high costs of ancillary services to stabilize production from renewable
sources;
▪ The high cost of fuel due to very high taxes.
It was estimated that if all Danish road transport had been covered by electric vehicles, total electricity demand would have seen an increase of at least 10-14 TWh / year (total Danish electricity demand was 34 TWh in 2007). It is therefore evident that the benefits promised by the implementation of the V2G represented a possibility to be examined.
Fig. 1.31 Wind power generation and demand during 3 weeks of January 2008 in the western Danish area with: a) current wind power penetration and b) when assuming 50% wind power penetration [34].
For this purpose, in 2009 [31], EDISON project was launched with an investment of approximately EUR 6.5 million. The project conceived the fleet operator as third part among the market, the grid and the EVs as already seen in fig. 1.27. The island of Bornholm has been chosen as test site since, as an island, it was an isolated environment capable of running independently from the surrounding power system. Since at the time the penetration of vehicles was practically nil, for the EDISON project, a simulator was set up that was going to generate a virtual fleet based on statistical data representing the driving habits of the inhabitants of the island (fig. 1.32). every single vehicle connected could therefore have been constantly monitored and characteristic data viewable through an HMI such as the one in fig. 1.33.
Fig. 1.32 Bird-eye view of medium-sized virtual EV fleet [31].
Fig. 1.33 EDISON Operator panel. 1) Selected vehicle 2) fleet summary stats 3) selected vehicle status 4) Veichle characteristics 5) EV’sGPS locations 6) recorden and predicted availability of the vehicle 7) energy prices 8) charging schedule [31].
Electric mobility: towards the future
▪
ENEL-Mitsubishi Project - Netherland
According to [35] The Netherlands presents an EVSE installation of around 40,000 of which 3,000 only in the capital, Amsterdam, which make the Netherlands the European leader in terms of car charging points: one per square km. In October 2017 [36] the Italian company ENEL, in a partnership with the Japanese Manufacturer Mitsubishi, the dutch grid operator TenneT and the American company Nuvve, started a V2G pilot project near Amsterdam. The project involved the installation of 10 EVSEs of 10 kW each for a total power of 100 kW. Mitsubishi motors provided 10 PHEV out-lander SUVs for the purposes of the project while the charging units was provided by NewMotion, a leading European supplier of smart charging solutions for electric vehicles. The intelligent management of energy flows was instead entrusted to the team of Nuvve who developed the “Grid Integrated Vehicle platform” (GIVe™ ) in order to controls the power flow to and from the cars, ensuring that the driver’s mileage needs are always met and optimising the power available to the grid.
▪
ENEL-Nissa Project – United Kingdom
The British government has allocated about 10 million pounds of funds to be able to put in place perhaps one of the biggest projects in favor of V2G, foreseeing the installation of 1,000 V2G charging points during about three years:
“The project falls back on 9.9 million pounds in funding through the Office for Low Emission Vehicles and the Department for Business, Energy and Industrial Strategy. V2G provider Nuvve, the National Grid as well as UK Power Networks and Northern Powergrid are on board as well. It is not the only V2G project funded by the government at Westminster. The Octopus trial is running as well that wants to install more than 130 V2G chargers throughout 2018” [37].
▪
ENEL-IIT – Italy
The only project know in italy is ones described in [38]. The agreement between Enel X and the IIT (Italian Institute of Technology) was signed in 2016 for the development of projects related to electric mobility and energy efficiency and was implemented in 2017 with the launch of the first electric car sharing company at the Institute. A service created thanks to the
collaboration of Nissan that supplied two Leaf, and with the installation of the first charging point with "Vehicle to Grid" technology.
Although the Italian legislation still does not provide the biredictional net metering for electric vehicles, recently [39] the Ministry of Economic Development [39] would have published a draft decree addressed to this issue. Future developments are expected.
Electric mobility: towards the future
CHAPTER 2
CASE STUDY: A POSSIBLE V2G
IMPLEMENTATION IN THE CAR PARK OF
FERRARA
In Chapter 1 we analyzed the main notions about electric mobility and what are the possible applications in the "Smart Grid" field. In the following chapter, instead, a case study about the V2G technology will be analysed. In particular we will going to simulate a possible application of a "peak shaving" algorithm applied on the load curve of the plant of interest. The following chapter is structured as follows:
▪ Paragraph 2.1: the site of interest is presented, the parking lot adjacent to the railway station of Ferrara, which will be the site of the simulations of this work. The various electrical utilities included in the parking project designed by Metropark s.p.a. will be listed and described and a plausible daily trend of the parking energy absorption will be presented;
▪ Paragraph 2.2: the energy producibility from solar source in the site of interest is analyzed and the sizing of the relative photovoltaic power plant is carried out; ▪ Paragraph 2.3: A possible smart recharging system is implemented, following two
different principle. In the first algorithm the recharge is perfomed only if the renewable resource are present in order to not impact the distribution network. The second algorithm, based on the energy absorption of the car park perform a “Peak Shaving” application exploiting the EVs bidirectional flow.
2.1 Load analysis and energy absoption of the car park
2.1.1 Introducing the setting
Ferrara is a city in Emilia-Romagna of about 132.000 inhabitants located 44 km northeast of Bologna near the river P0 (fig 2.1) . The setting of the current work is the car park adjacent to the Ferrara train station (fig 2.2). The area is marked by an intensive one modal exchange for the presence of the railway station, bus stops and terminals, bike parking and taxi stops. Recently, Metropark s.p.a., a company of Ferrovie dello Stato group, will open a new parking lot adjacent to the railway station consisting of 115 parking spaces, 5 of which predisposed for charging electric vehicles. The total area occupied is 4300 m2.
Fig 2.3 shows the ante-operam condition of the car park, while in fig 2.4 it is possible to appreciate the plan of the executive project.
Fig 2.1 Top view of the city of Ferrara.
Load analysis and energy absoption of the car park
Fig 2.2 Top view of the parking lot.
Load analysis and energy absoption of the car park
2.1.2 Description of the electric loads of the car park
In order to be able to estimate the energy consumption of the car park an then derive the relative load curve, it is necessary to determine the electrical loads belonging to the parking lot. Then, for each utility, a hypothetical load curve will be developed in the most unfavourable conditions from a grid absorption point of view. The mash up of the various load curves will represent the effective parking absorption curve which will ultimately be the reference energy consumption used during the successive analysis.
Fig 2.5 Detail of the lamp installed in the car park.
▪
Lighting system
The optimal parking lighting is guaranteed by the presence of 18 lampposts (fig 2.5) that run along two main backbone along the entire length of the parking lot. Each lamp presents a power of 74 W for a total power of 1.3 kW.
As the most unfavourable case, it was chosen December 21st as it represents the shortest day of the year and therefore it has been hypothesized a continuous operation that goes from 16:30 p.m. at 8:00 a.m.
[40].
The resulting power curve is shown in fig 2.4 The technical data useful for what concerns the lighting system are summarized in table 2.1
Tab. 2.1 technical data: lighting system
N° of lamps 18
Rated Power 74 [W]
Fig 2.6 Load curve of the lighting system.
▪
Entry/exit system
Fig 2.7 Access point of the car park. Tab. 2.2 technical data: Access point
N° of entry 2 N° of access 1 Entry/exit system rated power 650 [W]
The parking access points (fig. 2.7) consist of an input gate and an output gate with a rated Power of 650 W each. For the realization of the load curve it is assumed that the greater frequency of use of the entrance gates is in the time slot 6:30-9:00 a.m.
Similarly, the second peak was assumed to be in the time slot 16:30-20:30 p.m. This hypothesis is quite plausible if we consider that railway car parks are mainly visited by commuters, so the access/exit to the car park is conceivable to be greater in the time bands where people move to reach their place of work and when they return to go home.
The graph in Figure 2.8 shows the relative load curve.
Load analysis and energy absoption of the car park
Fig 2.8 Load curve of the entry/exit system.
▪
Video surveillance system
The parking is equipped with a 24-hour video surveillance system. The total number of camera is 9; each camera absorbs a rated power of 5 W for a total absorption of 45 W, obviously, it represents a very modest load when compared to the previous loads analysed. The load curve is characterized by a constant trend as shown in figure 2.10. The technical data useful for what concerns the video surveillance system are summarized in table 2.3.
Tab. 2.3 technical data: video surveillance system
N° of camera 9
Rated Power 5 [W]
Overall Power 45 [W]
Fig 2.9 Camera of the video surveillance system.
Fig 2.10 Load curve of the video surveillance system. ▪
Technical room
The parking area has a technical room at the service of parking operators (fig 2.11). The main load that can be hypothesized is the air conditioning system that is attested on a power of about 800 W. Therefore, in order to taking into account any accessory loads, is assumed a constant absorption of 1000 W over the entire period of service of the car park. fig. 2.12 shows the expected load curve.
Load analysis and energy absoption of the car park
Fig 2.12 Load curve of the technical room.
▪
Electric vehicle supply equipment
Another load to introduce is the one constituted by the electric vehicle supply equipment (fig 2.13). the car park in question allows charging for 5 vehicles at a time. As we will see later, an uncontrolled connection of 5 electric vehicles, albeit modest in number, goes to engage the distribution network. in figure 2.18, for example it is supposed the worst case, that is, the simultaneous presence of 5 vehicles that require a complete recharge (substantially, from 0% to 100%) in the load peak Fig 2.13 Electric vehicle supply equipment [41].
phase of the car park. Concerning the electric vehicle supply equipment, the one analysed in this work is the one owned by Enel, the MC V2G Station. Hereafter is cited the main qualities of this EVSE taken from the brochure of the product:
“The MC V2G bidirectional equipment is based on CHAdeMO protocol. It was designed to provide energy to the vehicle and supply energy to the grid or to the house, allowing getting benefits from different grid applications:
➢ Time shift ➢ Power balancing ➢ Power quality support
With MC V2G, you may store energy in your vehicle and use it later, getting benefits in terms of energy costs, CO2 optimization, autonomy, or demand profile faltering. In addition the equipment has the possibility to be managed remotely and integrated into e-mobility or in-house control systems according to context and business model.”
Therefor, the EVSE transforms the EVs in an atypical load since it allows a bidirectional energy flow. In particular, during tha charging phase the EVSE absorbs 10.5 kW of power, while, during the discharge phase, the power is 9 kW. Table 2.4 shows the technical datasheet that characterize the supply equipment.
Tab. 2.4 technical data: electric vehicle supply equipment INPUT (AC,3 phase)
Rated input power 10.5 [kW] Input Voltage 400 [V] ,3 phase Voltage range ± 10 %
Frequency 50 [Hz]
Max AC current per phase 16 [A]
OUTPUT CHARGING (DC)
Output Power 10 [kW]
Output Voltage 0-500 [V], DC Maximum output current 31 [A]
Efficiency 95 %
Power factor 0.99
THD (measured at maximum power) 3%
OUTPUT DISCHARGING (AC,3 phase)
Output Power 9 [kW]
Output Voltage 400 [V], 3 phase
Efficiency 90 %
Power factor 0.99
THD (measured at maximum power) 5%
Load analysis and energy absoption of the car park
▪
Electric vehicle
Regarding the electric vehicle, the reference car used in this work is the Nissan Leaf 2018. The reason for this choice is that the Nissan Leaf is , for now, one of the few electric car certified to be used in V2G applications [42]. Table 2.5 shows some technical characteristics of the car. The Nissan Leaf features two charging sockets, Type 2 and CHAdeMO. The on-board charger has a rated power of 6.6 kW. The CHAdeMO socket, instead, supports a rated output up to 50 kW.
Tab. 2.5 technical data: Nissan Leaf 2018 [43]. NISSAN LEAF 2018 - ELECTRICAL SPECIFICATIONS
Battery Capacity 40 [kWh]
Charge Power / Type 2 6.6 [kW], 1 or 3-phase Fastcharge Port / CHAdeMO type 50 [kW], DC Input Voltage 360 [V] Vehicle Consumption 1 236 [Wh/km]
1'worst-case' based on -10°C and use of heating along an higway.
Concerning the effective charging power, it is important to keep in mind that the discriminant is the minimum value of the power between the supply equipment and the charger of the vehicle itself in according of this relation (Eq. 2.1):
𝑃𝑐ℎ𝑎𝑟𝑔𝑒= min(𝑃𝐸𝑉𝑆𝐸, 𝑃𝐸𝑉) Eq. (2.1)
With:
![Fig 1.2 Passenger electric car stock in major regions and the top-ten EVI countries [5].](https://thumb-eu.123doks.com/thumbv2/123dokorg/7524401.106344/19.892.221.697.411.722/fig-passenger-electric-stock-major-regions-evi-countries.webp)
![Fig 1.4 Electric car sales and market share in the top-ten EVI countries and Europe, 2013- 2013-17 [5].](https://thumb-eu.123doks.com/thumbv2/123dokorg/7524401.106344/20.892.149.728.334.627/fig-electric-sales-market-share-evi-countries-europe.webp)
![Fig 1.10 Series-Parallel PHEV configuration [8].](https://thumb-eu.123doks.com/thumbv2/123dokorg/7524401.106344/23.892.238.685.825.1039/fig-series-parallel-phev-configuration.webp)
![Tab. 1.1 typical charging times for a generic medium-sized electric car [12].](https://thumb-eu.123doks.com/thumbv2/123dokorg/7524401.106344/28.892.152.747.498.676/tab-typical-charging-times-generic-medium-sized-electric.webp)
![Fig. 1.19 Type 1 connection. Fig.1.20 Details of the pins configuration for type 1 connection [14]](https://thumb-eu.123doks.com/thumbv2/123dokorg/7524401.106344/30.892.109.794.625.1133/fig-type-connection-fig-details-pins-configuration-connection.webp)
![Fig. 1.26 Evolution from a traditional grid to a Smart grid [25].](https://thumb-eu.123doks.com/thumbv2/123dokorg/7524401.106344/35.892.194.718.502.850/fig-evolution-traditional-grid-smart-grid.webp)
![Fig. 1.32 H2V operation mode. (a) Combined with G2V. (b) Combined with V2G [23].](https://thumb-eu.123doks.com/thumbv2/123dokorg/7524401.106344/39.892.176.752.872.1043/fig-h-v-operation-mode-combined-g-combined.webp)
