POLITECNICO DI MILANO
Scuola di Ingegneria Industriale e dell’Informazione
Master of Science in Ingegneria Informatica
Automatic Modeling System: a
database based infrastructure to
develop, validate and evaluate
scientific models. An application
to combustion kinetic models
CandidateAlice Rigamonti
Student Id. number 820018
Thesis Supervisor Prof. Barbara Pernici
Assistant Supervisor Prof. Tiziano Faravelli Ing. Matteo Pelucchi
els
Master thesis. Politecnico di Milano c
2017 Alice Rigamonti. All rights reserved
This thesis has been typeset by LATEX and the smcthesis class. Author’s email: alice1.rigamonti@mail.polimi.it
iii
Abstract
Scientific data repository is a concept which has been developed in the past few years. All digital libraries used until now are tied to a specific context and cannot develop or share their resources with other scientific communities, making cultural growth difficult. Over the past few years, research has been aimed towards creating a universal digital library, not just for textual documents, but also scientific and experimental data sharing. These data must have certain authentication, documen-tation and formatting elements, to allow sharing and conversion. The Chemical Reaction Engineering and Chemical Kinetics Group of the Politecnico di Milano is experimenting sharing and formatting issues for the experimental data in its research field. There are several data formats and data repositories in the Reaction Engineering and Chemical Kinetics field, but none of these can be used by the community as a whole. This paper explores the idea of a universal structure for data archiving for all European universities. The main goal is to create a data repository to manage internal data and chemical simulations studied within the Politecnico di Milano. This software automates all study processes of simulations and unifies the use of current programs such as OpenSMOKE++, Gnuplot e CurveMatching. A database has been created to save and manage data and an interface has been developed to make the researcher’s study process quicker and more efficient. This database is the starting point for sharing data and creating formats to extend sharing to other universities , allowing the exchange of structured and easily importable information in the various repositories.
v
Abstract in Italiano
Scientific data repository community é un concetto sviluppato negli ultimi anni. Le librerie digitali diffuse negli anni passati sono tutte relative ad un contesto specifico e non possono svilupparsi e condividere le loro risorse con altre comunitá scientifiche bloccando cosí la crescita culturale. In questi anni molte ricerche stanno cercando delle soluzioni per la creazione di un’ unica biblioteca digitale non solo per documentazioni testuali, lo studio si estende sulla gestione e l’interscambio di dati scientifici e dati sperimentali. Questi dati devono avere diverse caratteristiche di formattazione, specifica delle risorse, autenticazione e documentazione per poter permettere la condivisione e la conservazione. Il Chemical Reaction Engineering and Chemical Kinetics Group del Politecnico di Milano ha verificato questo problema di condivisione e formattazione dati sperimentali nel proprio campo di ricerca. Esistono tanti data format e data repository nel campo ”Reaction Engineering and Chemical Kinetics” ma nessuna delle proposte esistenti é utilizzabile dall’ intera comunitá. Alcuni data format come ReSpecTh hanno una buona struttura ma molto generalizzata. Questa tesina é nata per proporre una struttura comune per tutte le universitá europee che lavorano in questo contesto. Lo scopo principale é quello di creare un scientific data repository interno al Politecnico di Milano per la gestione dei dati e delle simulazioni chimiche. Il software automatizza tutti i processi di studio delle differenti simulazioni e raggruppa l’utilizzo di tutti i programmi utilizzati come OpenSMOKE++, Gnuplot e CurveMatching. É stato creato un database per la memorizzazione e gestione dei dati ed é stata sviluppata un’interfaccia per rendere piú veloce ed efficace possibile tutto il processo di studi dei ricercatori. Il software sviluppato é stato esteso per supportare la collaborazione con differenti universitá per poter scambiare informazioni strutturate e facilmente importabili nei differenti repository utilizzati.
vii
Contents
1 Introduction 1 1.1 The content . . . 1 1.2 Data Sharing . . . 3 1.3 Solution strategy . . . 4 1.4 Curve Matching. . . 52 State Of The Art 7 2.1 Context . . . 7
2.2 State of the art . . . 7
2.3 PriMe . . . 13
2.3.1 Prime data models . . . 14
2.3.2 Software Infrastructure . . . 14
2.3.3 PrIME criticisms . . . 15
2.4 Respecth . . . 15
3 Software Analysis 21 3.1 Feasibility Analysis . . . 21
3.2 Requirement Analysis and Specfication Document . . . 25
3.2.1 Introduction . . . 25
3.2.2 Description of product . . . 27
3.2.3 Function of the product . . . 29
3.2.4 System Model. . . 30 3.2.5 Use Cases . . . 37 3.2.6 Design Document. . . 50 3.2.7 Application Design . . . 55 3.2.8 Navigation Model . . . 55 4 Software changes 59 4.1 Ignition Delay Time . . . 59
4.2 Curve Matching. . . 62
4.2.1 Entity RelationShip changes. . . 69
1
Chapter 1
Introduction
1.1
The content
The Chemical Reaction Engineering and Chemical Kinetics Group (CRECK) at Politecnico di Milano works on the development of new fuels and new combustion technologies. The group is mostly focused on the development of chemical kinetic models to describe pollutant formation and to explore the viability of new fuels in new and conventional combustion systems.
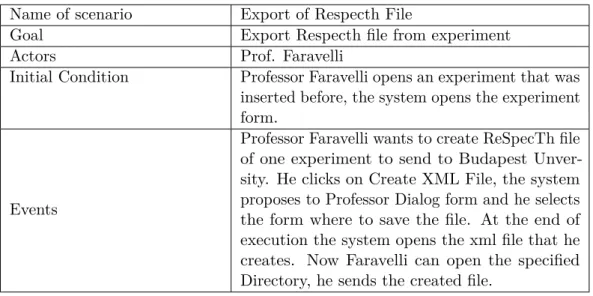
Standard procedures in the development of scientific models requires an iterative process, summarized in Figure 1.1
Figure 1.1. Iterative process flow
From a first state of the art analysis of the scientific literature, the second step requires the collection and organization of experimental data. Such experimental data constitute the targets for model validation, i.e. they are used to prove the accuracy of model predictions through extensive comparisons with results from
numerical simulations. Despite this approach applies to any scientific area, there exist disciplines where the daily users would particularly benefit from a systematic organization of both the large amount of experimental data available and of the evolution of models in time. A clear example of this is combustion science and engineering, and in particular the branch dealing with the development of kinetic mechanisms to describe the chemistry involved in the combustion of a given fuel. Correctly assessing the efficiency and the pollution potential of a fuel is mostly a chemical kinetics problem. A deep understanding of details in chemical kinetics allows the tailoring of a fuel or fuel blend for an existing technology (engine, gas turbine, industrial burner etc.) or the tuning of an engine for a given fuel [1]. The reliability of such models, and the advances achieved over the last 30/40 years due to the advent of high-end computing facilities and to the implementation of fundamental theories [2], have driven a dramatic increase in the number of models available and, more dramatically, in the number of experimental targets (ignition delay times, laminar flame speeds, pollutant formation etc.).
The Chemical Reaction Engineering and Chemical Kinetics (CRECK) group of the Department of Chemistry and Chemical Engineering at Politecnico di Milano has been playing a major role in the field of chemical kinetic modelling since the dawn of this science [3]. An enormous amount of data and different versions of the CRECK model have been stored over these decades, and their organization and implementation in a fully automated system strategically constitutes a key step for future developments, extensions and investigations. The complexity of such models also motivates the need of a smart system to manage and control its daily update and refinement. As an example, the CRECK model, known for its particularly "small" size contains about 500 chemical species and 20000 reactions. Overall, this roughly translates into 100,000 parameters, strongly interacting with one another.
In general, a user collects new experimental data from a new publication, saves the data in text (txt), comma separated values (csv) or excel (xls) format. The second step requires the identification of the parameters needed for the numerical simulations. Once the input is compiled, kinetic simulations are performed with the OpenSMOKE++ framework of Cuoci et al. [4]. The numerical simulations produce output files that have to be compared with experimental data, according to the standard graphical visualization. At this point an evaluation procedure is used to discriminate between a "good" model and a "bad" model. In the last 2 years two different methods have been proposed to automatically evaluate the performances of combustion kinetic models [5] [6], in order to avoid subjective graphical evaluations. This procedure not only applies to the cases where new experimental data have to be considered, but also to the more common situation where a new release of the CRECK model has to be produced. Theory driven updates and refinement of model parameters happen on a daily basis, to improve model performances at a given condition. Due to the strong interaction between the different parameters, it is important to verify that the modification meant to improve the model reliability at some specific condition, did not make it worse for some other target.
The aim of this thesis is to implement a fully automatic method translating all these steps in a well constrained routine, of use for kinetic modelers and of easy extension to scientific modelers in general.
1.2 Data Sharing 3
1. Data Storage, Formatting and Sharing.
2. Compilation of input file for numerical simulation 3. Execution of numerical simulation with OpenSmoke++ 4. Graphical comparison of model and experiments
5. Evaluation of model performances
The following section describes in detail point 1,2 and 4. Concerning point 3 and 5, a detailed description of openSMOKE++ numerical framework and of model performances evaluation [6] are out of the scope of this thesis However, the two steps are implemented in automatic tool described in the following.
1.2
Data Sharing
1. Experimental data file reading
The User firstly needs to obtain data from scientific papers, or from the attached supporting information. Different issues are associated with this:
(a) Time needed to recover the data, if not already well organized in the supporting information to the paper
(b) Risk of replicating work already done
(c) Need of improving the data altready stored by someone else (d) Formatting of Experimental data
2. Compilation of OpenSMOKE++ input files
The step requires the correct interpretation of experimental data in order to assign the proper parameter for the numerical simulation(reactor configuration, fuel composition, temperature, pressure, time etc.)
3. Execution of Numerical simulations and output files analysis
Depending on the reactor configuration and on the size of kinetic model the time for simulation can range from seconds to hours. Therefore it is important to store and share the results from numerical simulations, avoiding replication of work.
4. Evaluation of results
Results obtained by one user, if not shared, might be repeated by another user causing avoidable time costs. If performances evaluation were shared, users could use previous results. If matching were shared, Users could access results of previous users. This way they could improve different results and compare their opinions or studies
5. Experimental data from other repositories
Another issue is the exchange of experimental data with already available repositories or sources (other laboratories, other databases etc.). Such data might not be structured in the same way as different reserach groups might be
interested in storing different information or the same information in a different way. This constitutes an issue mainly because the information contained in an experimental data from another sources might fit the requirements of other solvers similar to OpenSMOKE++ (CHEMKIN [7], Canterra etc.) but not OpenSMOKE++ format. Properly storing the needed information is useful to avoid the risk of running simulations using wrong specifications in the future.
Format of file of experiment
Experimental data files and OpenSMOKE++ outputs might have different structures. Differnt series of points can be contained: (X1, Y1)(X2, Y2) etc. series and (X, Y1)(X, Y2) etc. series. Different separators between the values can also be used: comma(,) , space, tab etc.
Agreeing on a shared format and rules for formatting data facilitate data sharing.
Graph creation method
Different tools can be used to graphically compare experimental data and model results: Excel, Origin, Gnuplot, R.
1.3
Solution strategy
After having analysed the work flow and the issues of kinetic modelers we can elaborate a strategy to solve such criticism. The first step is to build a database essential to store data and input files and create a software managing all the data in the database. It is necessary for the user to be able to insert data to create the OpenSMOKE++ input file without mistakes and with the proper structure. It is necessary that all these operations, currently executed manually, become automated. Automation of the processes has been fundamental to save all the data in the database, and to structure the information needed by OpenSMOKE++ simulation and in the experimental data. Three important steps are: the insertion the pdf format file of the scientific paper with its experimental data and standard reference information (title, authors, year, journal, volume, issue, pages, figures of interest). The second step deals with managing the experimental data, the OpenSMOKE++ input parameters (mixture condition, reactor type, reactor configuration, temperature, pressure etc.).
The input file is then linked to the experimental data and its reference paper. Clearly, both the input information and the experimental data can be modified at any time if needed. The third step is the execution of the simulation with OpenSMOKE++ and the comparison of the results with the experimental data previously stored. This step has the very important feature of allowing the user to search for particular fuels, conditions, targets of interest to be executed through a filter. Such a filter will limit or extend the validation targets according to the user specifications. Diagrams comparing experiments and models are automatically generated and stored together with the output files.
1.4 Curve Matching 5
Respecth experimental file
Other research groups use different formatting formats: as Matlab, Excel and XML. In the combustion community, the Chemical Kinetics Group at ELTE Budapest University, developed an extremely useful XML format (ReSpecTh [8]), containing the data points together with the conditions needed to run the simulations. It was decided to adopt the same format, making it applicable to OpenSMOKE++ requirements.
The XML file contains:
• File paper name and references • Type of experiment
• Initial Condition
• Data point of experiment
• Column name and unit measure of columns data point
The ReSpecTh database already contains 968 dataset [8] of experimental data of interest for combustion mechanism validation. The format was slightly modified to be able to directly include such data into the framework developed herein. To converge to a common format a collaboration with ELTE Budapest University was activated within the COST CM 1404 Action (SMARTCATs, www.smartcats.eu). The group from POLIMI needed to introduce specific fields within the ReSpecTh format to describe experimental data and to carry out simulation in OpenSMOKE++ . The joint effort was promoted through COST Short Term Scientific Missions and the outcomes were presented at the 2nd General Meeting and Workshop on Smart Energy Carriers in Industry of SMARTCATs Action held at Instituto Superior Tecnico, Lisbon, Portugal. [9]
1.4
Curve Matching
The recent years have observed an increase of the experimental and theoretical data of combustion processes. The new experimental techniques, together with the increase of the measurement accuracy, produced wider and wider sets of experimental data. The continuous and fast growth of the computer performances enhanced the development of modeling activity. As in the development of any scientific models, extensive and frequent comparisons with experimental data have to be performed. All these comparisons are usually performed using plots in which the experimental data and the calculated curves are plotted together. This is a very effective approach, which has been used since the dawn of science, whenever a model had to be compared with empirical observations. In some cases the qualitative result is not sufficient. Moreover, when a very large number of comparisons has to be done, the procedure could result in impractical times. An agreement evaluated on a quantitative basis can better highlight measurements or models limits, but it becomes strictly necessary if an automatic procedure of comparison is required. The first step in this complex process of assessing models validity is the definition of a standardized and quantitative
approach to estimate the agreement between models and experimental data, and especially to compare the performances of different models in reproducing the same set of measurements [6]. To pursue this goal, a novel framework named Curve Matching was introduced by the CRECK group at POLIMI. This innovative method was introduced in the automatic modeling system developed in this study.
Implementation of CurveMatching integration and automatization is described in this document in section 4. In this document you can find in section 1 a general introduction to the context. The document continues with the state of the art in section 2 where existing studies about different scientific data repository and chemical reactor and kinetics repository are described. In section 3 is a the analysis of the software describing initial proposal, costs analysis and the creation of the database.
7
Chapter 2
State Of The Art
2.1
Context
The Chemical Reaction Engineering and Chemical Kinetics group (CRECK) at POLIMI had the necessity to implement a structure to manage research data and to build a shared repository to store and manage models and experiments. Two types of information have to be managed: a) experimental data, b) inputs and outputs from OpenSMOKE++ simulations. To build the repository in the most efficient way, an analysis of existing Research Data Repository structures and Digital Libraries in the context of chemistry and chemical kinetics had to to be carried out.
2.2
State of the art
The concept of Digital library and Data Repository has been widely used for many years to collect data and to manage large amount of information about specific sectors [12]. A Digital library is an important structure for distribution of information and to promote culture diffusion. The same concept is applicable to scientific data repositories related to specific areas of research. In the last years many proposals have been made in terms of expansion and sharing of digital libraries, given the key role played by data in our society. There is a universal agreement on the benefits of ”data sharing and reuse” as a mean to accelerate science performances [13].
It is possible to identify six main ways that explain how a Data repository can increase performances [12]:
• Support, dissemination and quick exchange of experimental research. • Contribution to collect larger number of information
• Improve the productivity of scientists, engineers and students. • Encourage new discoveries and innovations.
• Speed up technological transfer
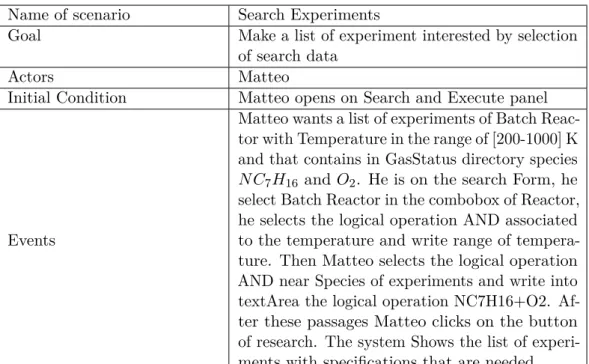
Lars Mayer presented an analysis about the changing of digital space and about how digital libraries and data repositories should reallocate resources to innovation, publishing and research [15]. Single digital libraries exist and required acquisition of good digital storing, in single digital libraries the storing is well managed and well formatted. It has been necessary extend storing of digital and metadata at community libraries. In this case preservation of the work is more complex. From these conditions Mayer creates a life cycle stage of resources represented in figure 2.1.[15]
Figure 2.1. Life cycle Digital Libraries [15]
There are five steps related to digital data, where the first one represents the creation of it. The second step is the Description where Specific of metadata and their preservation are stored and linked to digital data, next the two steps are storing in the repository. Data storing can be reused thanks to open access policy. Data reused can be modified or updated and inserted again in the data repository restarting cycle from first step.
Attempts to structure the community are under investigation, like for example OAIS (Open Archivial Information System) [16] and TRAC (Trusted Repositories Audit and Certification) [17]. OAIS defines information as ”any type of knowledge that can be exchanged, and this information is always expressed (i.e., represented) by some type of data” [16]. In the OAIS model, the represented information contains semantic and structural information. OAIS defines PDI (Presentation Description Information) as a story of information. PDI contains creation, modifications and association about an information stored. Four types of information compose a PDI: • Provenance: describes the source of the Content Information. The provenance helps to have a clear understanding to where provenance data should be mantained in the digital environment.
• Context: describes how the content relates to other information outside the in-formation package, including why it was produced. It facilitates understanding and interpretation of the Content Data.
2.2 State of the art 9
• Reference: provides one or more identifiers, or systems of identifiers, by which the content information may be uniquely identified.
• Fixity: provides a wrapper or protective shield that protects the content information from undocumented alteration. With provides of file measurements such as byte count, record count, and record length a system can calculate and associate checksums for each data file has recently been deployed. TRAC formalizes libraries and long-term management of digital assets. The main concepts are preservation and sustainable accesses. TRAC defines elements and actors of nine Digital Preservation Policies. The main elements are: Mandate, Categories of commitment, Level of preservation and Access and use criteria. Firstly mandates are defined as commitments and stakeholders that are involved in the digital content, in this way long-term goal is supported. Another main element is Categories of commitment that provides a scope for the types of materials that will be digitally preserved and made accessible. Levels of Preservation supports long-term adherence to an established digital preservation conceptual model. Finally Access and Use Criteria identify what elements affect proper implementation of the policy: infrastructure, feasibility of solutions, standards adoption, and evolution of standards and best practices. Community data repository present immature system and presence of single digital library. A new structure is needed for single libraries to take part in the community. Digital libraries have to shifting from ”content-centric” system of simple organise and with personal structure that provide access to particular collections of data to ”person-centric” system that provide facilities for communication, collaboration and any kind of interaction among scientists, researchers, and the general audience interested in topics of pertinence. [18] Concept of person-centering extends to the research data publishing contest. ”Research data” is the very broad and heterogeneous range of materials produced during a research activity [14]. Science repository is called to manage research datasets produced in different contexts and by different teams. Digital Libraries are used by different sets of stakeholders that represent academia, industry, founding agencies and publishers. For certain types of important digital objects there are well-curated, deeply-integrated, special-purpose repositories such as 3TU.Datacentrum(http://datacentrum.3yu.nl, CSIRO Data Access Portal , Dryad, Figshare(https://figshare.com/) , Zenodo (http:// zenodo.org/ ). These repository accept a wide range of datatypes in a wide
variety of formats.
Analysing these repositories Candela and Castelli proposed a flexible method to create more robust repositories that contain and manage a wider heterogeneity of data. The paper describes the main features [18]
• Formatting
the structure of a dataset must be in a certain format to maintain usability. A dataset is a unit of information. There are two types of format associated to it, the file format and the content format. Having data properly formatted is a pre-requisite for any use of the dataset. To create a general repository it has been studied generalization of formatting. Generalist repositories cannot make any assumptions on the data and content formats. This has lead to the development of approaches that aim to be generic and as much formatted as possible. This makes the management of the system difficult.
Table 2.1. Foundation
Name Type Founded Country Context
3TU. Data-centrum
Institution 2008 NLD Cooperation between 3 University, It provide to community a research data archive
CSIRO DAP
Institution 2011 AUS Manage, discover and share data across different research fields. Dryad Organization 2008 USA Initiative of a group of journals.They
set up a community-governed infas-tructure for data archiving and pol-icy.
Figshare Company 2011 GBR Created by PhD student as a way to store manage and freely disseminate any kind of research output.
Zenodo Organization 2013 CHE Enable researches to preserve and share any kind of research output. It focuses on produced in the context of the long-tail (in the context of those scientific domains in which activity is performed in a large number of rel-atively small labs and by individual researchers who collectively produce the majority of scientific results) of science.
• Documenting
a dataset has to be retrieved, understood and reused. The goal is to make datasets available for validation and reuse both within the scientific community that has produced it and other community. It is necessary to create auxiliary data to datasets to provide contextual information about them. This infor-mation can be what the dataset is about - descriptive metadata - and how it has been obtained - provenance. This documentation influences dataset discoverability, understandability, verification and pratical re-use. Finding a complete documentation to apply to datasets is very difficult because existing repositories have a large heterogeneity auxiliary data to datasets.
• Licensing
Two licences are involved, the one agreed between the repository and the data owner, and the second one agreed between the repository and the data consumer. The main licence is relative to data owner, a re-use license concerns at least attribution and control on commercial exploitation. Moreover the data-owner must check whether the licence is compatible with one of those supported by the repository. The goal is to find a progressive orientation to establish common licences and not only proprietary ones. Usually access licences are publics but in some cases require data consumer registration.
2.2 State of the art 11
• Publication cost
the value of founding for guarantee an open access to dataset. There are two type of costs: the first one is a monetary cost, the second focuses on the use of services. All repositories have the tendency to charge data owners when publishing their dataset rather than data consumers. The costs depend on the level of curation or preservation for a given number of years or a given level of quality. Another cost relates to the use of service. The direction to take is to reduce the repository operation cost. There are many techniques to reduce the costs of curation by automatically extracting parts of necessary information through analysis and mining of related artefact, e.g. papers.
• Validation: cogency and soundness of published data to ensure quality of repository. Scientific data repositories help the dataset validation phase by offering practices and services for both dataset pre-publication and post-publication. In the contest of generalist data repositories, dataset validation is at an initial stage. It is characterized by the definition of ”data-quality”, through validation criteria and general revisions.
• Availability
Availability guarantees that published datasets are at consumer’s disposal. Most repositories store multiple copies of the datasets, either on their own premises, or in third party service providers. For preservation of repositories the use of migration practices is common, but becomes a challenging feature to preserve for open ended sets of data. Some repositories do not guarantee usability and completeness of deposited objects over time, in some case the migration to another format can not preserve the original information. If migrated files do not contain all the information available in the original file format, then can be excluded from migration. In order to guarantee current and future availability the repository has to address both technical and economic challenges.
• Discoverability and access
Dataset discovery and access is the facility enabling consumers to find out about the existence of dataset, and to be able to get access to them, namely to the dataset content and the associated documentation. This facility is called metadata and includes user-driven functions and semi-automatic function. The main discovery facility is search on database by query on fields of entities, this is called database discovery. The main approach is based on keywords and fields, the set of supported fields is repository specific. Discovery is a service that can be provided by third party for example through API.
• Citation
Is the practice to provide a reference to datasets intended as a description of data properties that enable credits and attribution, discover, interlinking and access. Communities often have their own way to cite their data. It would be very useful that repositories offer facilities enabling specific communities to customize the way their own data should be cited, preserving interoperability at the same time.
Comparing different repositories it has been underlined that a large variety of metadata exist, some metadata schemes have common features in terms of types of data across different disciplines [14]. In order to give a general information attribute of metadata are specify main attribute necessary:
• Availability: enabling access to the dataset and its content. • Bibliometric data: report dataset statistic.
• Coverage: describing spatial, temporal and taxonomic coverage. • Date: when dataset was created.
• Format: formatting perspective including the size. • License: policies ruling.
• Minimal description.
• Paper reference: references to related pubblications. • Project: initiative leading to production of the dataset. • Subject: including keyworks, tags and subject headings.
One of the issues previously raised had to deal with dataset formatting, a pre-requisite for any use of datasets. To create a community data library it is necessary to create a standard approach to save dataset and, at the same time, to create a generalist data repository. This condition restricts the facilities that repository can offer to data publication [14]. It is important that the user can upload the type of data used for research and experiments, and that the dataset is ”intelligibile” to permit cross disciplinary reuse of datasets. The second main criticism is the validation and reuse of datasets by other organization and in other disciplines. Usually a dataset is associated with a data paper. Eleven classes have to be included in a paper for metadata : availability, bibliometric, coverage, data, format, license, minimal description, paper references, project, provenance and subject [14]. To connect and manage dataset and documentation, the concept of ”data paper” has been defined. Each overlay documentation was expected to contain (a) metadata about the overlay document (b) information about and from the quality process for which the document was constructed, and (c) basic metadata from the referenced resource to aid discovery and identification [13]. Journals now contains different types of data papers. Two types of journals content have been identified, the ”pure journal” is the journal that contains only data paper, the ”mixed” journal contains any type of paper including data paper. The data paper is identify as a set of two elements that have to be materialized into concrete and identifiable information objects: the data set (the subject of the data paper) and the data paper itself (the artefact produced to describe the data set). Data Paper is important to build a coherent data repository because contains more information about documentation Data Paper can solve or reduce costs of curation and research, it can be added fields of research and with this type of file the link with citations is not a problem. [13]. By Analysing existing templates the following classes of data set have been identified before:
2.3 PriMe 13
• Availability: provide data set access attributes, namely, a DOI or a URI. • Provide explicit declaration of any factor that might influence the related
dataset.
• Coverage: to provide data set ”extent” attributes.
• Format: to provide information oriented to promote the actual reuse. • License to provide information oriented data set policy.
• Microattribution to provide appropriate credits to each author of the paper by capturing in detail the contribution of each author
• Project
• Provenance: to provide information describing methologies • Quality: qualitative aspect of information
• Reuse to provide information promoting potential uses.
Different tools to create a correct data paper exist. For example GBIF network, specifically conceived to support metadata for datasets and to have an interface to add all classes of documentation.This tool is specifically conceived to support the production of metadata for data sets of primary biodiversity data to be published through the GBIF network [19]. However, the tool is also equipped with a facility for automatically generating a data paper manuscript from the data set metadata. The author is requested only to produce the Introduction section of the data paper. The general data format is still one of the main criticisms, as metadata in science might have different structures. The dataset paper in science, which promote ”hybrid” model, metadata associated to dataPaper can have different formatting and different standard. In many repositories there is an extension to allow publication of metadata as a zip file that contains supplementary material.
2.3
PriMe
Chemical kinetic models rely on a large amount of experimental and theoretical information and methods, commonly used to develop and validate such models [21]. These data are spread over different data repositories and often they cannot be effectively used due to different formatting. Commonly these data have to be transformed and rearranged by subjects having an expert knowledge. Frenklach et al. at the University of California at Berkeley, firstly highlighted and investigated such issues in combustion kinetics and studied a process to store data, creating a repository to store combustion experiments and models, the PrIMe Kinetics framework [21]. This repository is open to any type of organization and institution that treat these models. First of all PriMe defines concept of Process Informatics asa data-centric approach to developing predictive models for chemical reaction systems. It will deals with all aspects of integration of pertinent data of complex systems (industrial processes and natural phenomena) whose complexity originates from
chemical reaction networks. The goal of Process Informatics is to build targeted knowledge from the entire community and to provide the wealth of information in its entirety to every user [21]. As specified in the PrIMe report in August 2002 [22] two types of accesses and actors exist. In fact, the main consumers are data providers and model users. The first one deposits her/his new observations or new computational results, the second one can peruse the entire database. About licenses, the report firstly specifies ”Open Membership”: access is open to any scientist who wants to be involved (data provider). The second license defines ”Open Sources” access: all data and models submitted to the project or created by the project will become ”public domain”,mostly for model users. Finally PrIMe rely on ”Democratic Governance”, i.e. the project management follows a rational leadership guided by the combustion community consensus. Clearly PrIMe represented a pioneering approach to combustion kinetic modelling, based on the scientific collaboratory paradigm, through a data-centric system framework. The main elements of PrIMe include: a data Warehouse which is a repository of data provided by the community, a data Library which archives community evaluated data, and computer based tools to process data and to assemble data into predictive models [23]. To build the structure of the database and to store all data, PriMe starts by defining chemical reactor models. Different reasons justify this first categorization: the first is that the modelling of a combustion process requires a reaction model. Most disagreements are between models and experiments and most controversies begin with and trace to the selected reaction model. Secondly chemical kinetics has accumulated much needed data and the missing data can be evaluated using quantum and reaction rate theories [23].
2.3.1 Prime data models
The data Model includes entities allowing the creation of a simulation case and storing PriMe information about its results. Relevant entities are: bibliography for referencing data sources, chemical element and chemical species involved in the simulation, reactions and reaction rates (rate expression and parameters), the model associated to the reactor, experimental data to compare with the simulation output and data attribute used to specify features of the experimental data. Experimental data, data attribute and initial status (mixture composition, temperature, pressure etc.) are specified in the PrIMe XML file format. XML formatting allows exchanging experiments between researchers within the community.
2.3.2 Software Infrastructure
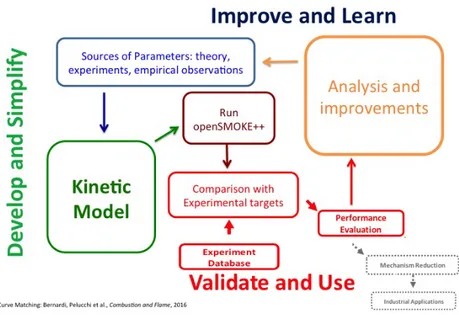
PrIMe is an online application. The central feature of PrIMe is the PrIMe Workflow Application (PWA) that links all components together and create an automation of dataflow. The infrastructure enables interaction with different users, having diverse objectives and varying roles. An overall diagram of the software infrastructure is shown in Fig. 2.2
The PrIMe Workflow Application (PWA) is a web based application that unifies the components of PrIMe into a single interface. Workflow Components are the features that allow every operation on the data. Such features also permit sharing of data-analysis and scientific simulation codes, providing to the community the
2.4 Respecth 15
Figure 2.2. Software Infrastructure [24]
capability of applying different methods of analysis on the same data, thus allowing meaningful comparisons and interpretations.
2.3.3 PrIME criticisms
The combustion kinetics community has found some difficulties using PrIMe. First of all it was observed that the insertion of new experimental data presented some criticism: firstly for the usability of its features. The community has observed [25] that is not easy add new experimental data because all active parameters are not recalculated, the operator of the active database provides new releases from time to time. A bug about details of experimental data was also found: it does not provide any information on how the data should be interpreted, easily generating misunderstandings within the users. Other difficulties are related to the references. A large amount of literature references are contained in PrIMe, preventing the possibility of finding a specific single file or experimental dataset. Finally, PrIMe does not specify what is required to complete the simulation in case of failure, requiring a very expert user.
Following these considerations, the Chemical Kinetics Laboratory of the Eótvós University created a data structure improving PrIMe XML formatting. Eótvós Uni-versity builded a data repository (http://respecth.hu/) containing XML experiments with additional information compared to PrIMe.
2.4
Respecth
ReSpecTh has several unique and noteworthy features. Some of the datasets contained in ReSpecTh are built upon data mining, using discrete mathematics
methods. ReSpecTh includes a searchable bibliographical chemical kinetics data collection, a database of high-temperature gas kinetics elementary reactions with information on the available experimental data, and capacity for a detailed assessment of derived quantities. ReSpecTh, in the portion concerning combustion chemistry, contains experimental data on specific reactions, experimental data used for model validation, and detailed reaction mechanism of exemplary combustion system and utility programs [23]. ReSpecTh set up a dedicated database http://respecth.hu, indirect experiments are searchable according to the type of experiment, experimental conditions and the type of fuel and batch gas. In this way ReSpecTh can easily be used to locate all experimental data at a given set of experimental conditions, which can be of great benefit for mechanism developers. The direct experiments and the theoretical determinations can be searched according to the stoichiometry of the elementary reaction and the range of temperature and pressure [8]. Table 1.2 shows experimental and theoretical data related to combustion available in ReSpecTh
All combustion data are stored according to the ReSpecTh Kinetics Data (RKD) Format Specification. This data format consists of a set of specifications, aiming to provide an unambiguous definition of the storage of combustion experimental data and rate coefficient determinations [8]. The RKD format specification defines an XML data format to provide flexible data representation and allows for an easy extension of the format specification [23].
The ReSpecTh kinetics data format is an XML based format. All data are stored in XML elements and attributes. The main element of the XML file (root element) contains all the data elements that characterize an experiment. It has been possible to divide XML data Element in three types:
1. Reference of experiment
It contains a reference about the file paper and the type of experiment to simulate as ”fileAuthor”, ”fileVersion”, ”ReSpecTh version”, ”bibliography link”, ”Experiment type” and ”apparatus”. The main Data Element is the ”Experiment type” that is mandatory. ”Experiment type” specifies the model of reactor and the type of experiment. For instance, ignition delay times (i.e. autoignition propensity of a given fuel) are measured typically in shock tubes and rapid compression machines, for which the simulation requires the solution of a batch reactor. Other important DataElements are references about paper, fileAuthor, bibliography link specific references, DOI and name of the file paper. Data element apparatus is specifically about the Reactor (e.g. batch, plug flow, jet stirred rectors) but simulation of ReSpecTh already contains this information in ”Experiment Type”, making the apparatus not mandatory. The structure is:
<ReSpecThVersion> <major></major> <minor>0</minor> </ReSpecThVersion>
<fileAuthor>Tamas Varga, ELTE - Alice - Matteo</fileAuthor> <bibliographyLink preferredKey="Mueller 1999"/>
<experimentType>Concentration time profile measurement</experimentType> <apparatus>
2.4 Respecth 17
<mode>A</mode> </apparatus>
2. Initial Condition
”Common properties” represents initial condition of experiment. It is fun-damental for the execution of experiment simulation. ”Common properties” contains Data Element ”property” that specify species link or component associated to its value. For example species=H2 has measure=’Mole fractions’ and value=0.2. Example of the structure:
<commonProperties>
<property name="pressure" units="atm"> <value>0.3</value>
</property>
<property name="temperature" units="K"> <value>880</value>
</property>
<property name="initial composition"> <component>
<speciesLink preferredKey="H2"/>
<amount units="mole fraction">0.0050</amount> </component>
<component>
<speciesLink preferredKey="O2"/>
<amount units="mole fraction"> </amount> </component>
</property> </commonProperties>
3. Data group Data group contains experimental data points. In the first part there are the definition of experimental data columns and in the second one rows about experimental data.
<dataGroup>
<property name="time" units="s" id="x1" label=""/>
<property name="composition" units="mole fraction" id="x2" > <speciesLink preferredKey="H2"/>
</property>
<property name="composition" units="mole fraction" id="x3" > <speciesLink preferredKey="O2"/>
</property>
<property name="composition" units="mole fraction" id="x4" > <speciesLink preferredKey="H2O"/> </property> <dataPoint> <x1>3.680000e-003</x1> <x2>4.965400e-003</x2> <x3>9.588880e-006</x3> <x4>4.965400e-003</x4>
</dataPoint> <dataPoint> <x1>6.610000e-003</x1> <x2>4.255800e-003</x2> <x3>6.730000e-004</x3> <x4>4.597100e-003</x4> </dataPoint> <|dataGroup>
Starting from the large amount of experimental information stored in the Re-SpecTh database the CRECK group at POLIMI proposed a collaboration to the ELTE group with the goal of exchanging data, thus speeding up the recovery of experimental data. Modifications to the ReSpecTh format have been necessary to efficiently interface ReSpecTh and OpenSMOKE++ for simulations. Added information are:
• Type of Experiment: in ”apparatus” data Element add child of ”reactor” and ”model” of experiment to simulate.
• Equivalence ratio/fuel/oxidizer
In specification of Initial status the ReSpecTh XML format provides only one method for the insertion of components, openSMOKE++ input can specify the Initial Status component as an association between equivalence ratio, fuel component and oxidizer component. It has been proposed to add these name types to the property of initial status. Fuel and oxidizer contain in data element childs that represent components involved for each of them.
• Axis to data point
ReSpecTh XML format does not specify axis on data point column specification. This is because only experimental data with the structure XY1Y2 are managed. It has been proposed to add an attribute axis on the specification of columns. In this way it is much more simple to identify the structure of the experimental data.
2.4 Respecth 19 Table 2.2. experimentalData hydrogen combus-tion syngas combus-tion ethanol combus-tion related publica-tions [14, 15] [16, 17] [18] ignition delay times - measured in shock tubes 770 datapoints in 53 datasets 732 datapoints in 62 datasets 444 datapoints in 39 datasets ignition delay times - measured in RCM 229 datapoints in 20 datasets 492 datapoints in 47 datasets 20 datapoints in 3 datasets laminar burning velocities 443 datapoints in 73 datasets 2116 datapoints in 217 datasets 1011 datapoints in 124 datasets concentration
pro-files in flow reac-tors 152 datapoints in 17 datasets 443 datapoints in 73 datasets 1674 datapoints in 22 datasets concentration profiles in shock tubes - 436 datapoints in 4 datasets 8871 datapoints in 14 datasets concentration pro-files in JSR 631 datapoints in 9 datasets 90 datapoints in 3 datasets 328 datapoints in 4 datasets direct measure-ments 1749 datapoints in 56 datasets for 10 elementary reac-tions 589 datapoints in 29 datasets for 5 elementary reac-tions 725 datapoints in 58 datasets for 11 elementary reac-tions theoretical deter-minations - - 41 datasets for 13 elementary reac-tions total number of data points
3974 data points 4462 data points 13114 data points total number of
data sets
21
Chapter 3
Software Analysis
3.1
Feasibility Analysis
Starting point
Before starting the analysis and development of the project the Department of Chemistry CMIC discussed about different possibile solutions to reach the final goal. The goal is create a software that stores all data used to study kinetics mechanism and automates all the steps of work that the researcher do manually.
Database has been build a unified to retrieve and work on the Data in order to automate the mechanism. It has been needed build coherent database because of the structure of experimental data file and the connection between experimental data and openSmoke simulation.
The first step was observing how a student works on the Data. It has been necessary observe how the researcher analyses the contents of file and how he executes different cases of model.
The following main steps have been identified
1. Recovery of file Paper. The paper is read,the experimental data is individuated 2. If the file Paper has attached files of experiment data points in question it is necessary to take this Data. Otherwise it needed read associated graph and extract data points.
3. When the student has experimental data he creates the input of openSmoke. It is been necessary specify initial condition and species of output. These species are the same contained into the data experiment file. OpenSmoke is executing. 4. At the end of openSmoke execution the student takes the output and reads
interesting species of output.
5. Finally he compares species of experimental data with output values and creates graphics for each species for compare the experiment and the model. After this observation a list of possible solution is created for reach the goal. In the next section we list all proposals that we think up.
Proposed Solutions
Different solutions were proposed, and experiencing the different scenarios itera-tively led to the final proposal.
• FIRST PROPOSAL: Managing files
The first need is to limit the information stored, to avoid additional costs in terms of memory and working time. It is necessary to focus on essential features of the experiments. Therefore only the connection between the experimental data file, OpenSMOKE++ and the pdf format scientific paper was kept. In this way there is a reduction of memory costs, the space occupy is the files size. This solution solves problem about space, OpenSMOKE++ execution time and output comparison time.
On the other side this solution presents some criticisms. The first one has to deal with searching for specific experimental data in the database. If only the files are saved it is impossible to search for them in an efficient way (by fuel, temperature or pressure conditions). The second issue is that the input file cannot be updated and a new input file needs to be uploaded every time. • SECOND PROPOSAL: Create Database and Search
Implementation of OpenSMOKE++ input insertion fields has been necessary. In this way the input file is created before its execution. Search data insertion is needed, so we add fields to search data. It has been necessary to insert these data into Database and create attributes about search. Search data makes selection in the database easier than a search on file names. The search can be complete and the selection can be limited.
• THIRD PROPOSAL: Create a Database for Experimental data, References OpenSMOKE++ and Data Search
The third proposal was to add to the second one features about managing experimental data and references to the scientific paper. It has been necessary to save all the data to be compared with model results and to modify exper-imental data directly in the database without visualizing the file. The user can change the specification using only the software without modifying the original file. The pdf format paper is attached to keep track of the data. After having defined a strategy, its costs and the schedule to its implementation were assessed. The first solution has lower time costs than second one. In the first proposal it is necessary to upload reference files in the database. For the second proposal it is necessary to read all the fields of OpenSMOKE++ simulation and create input file for each run of OpenSMOKE++. At the end of execution it is required to read output files and compare them with experimental data.
Costs of the second proposal are higher than the first one, due to the complex structure of the database. It is necessary to save, for each experiment, all fields required in the simulation input. Moreover, it is necessary to save general information (fuel, temperature, pressure) about the experiment used for the data search.
The third solution is similar to the second solution, as only the information about the pdf paper is added. Clearly not many differences are obtained in terms of
3.1 Feasibility Analysis 23
space. This proposal allows secure management of the data and gives a structure to data experimental data and File paper.
Function Point Analysis
To carry on analysis it has been needed evaluate the cost of third proposal by the Function Point analysis [20]. FPA is based on the number of functions that have to developed in the software. We start identifing Functional User Requirements for each proposal explained before. It has been necessary divide Transactional functions to Data functions, apply rule by table of FP and estimate results. For the transactional function we identify three types of data [20]
• External Inputs (EI) that is an elementary process that processes data or control information sent from outside the boundary;
• External Output (EO) an elementary process that sends data or control information outside the boundary and includes additional processing logic beyond that of an External Inquiry;
• External Inquire (EQ) a form of data that is leaving the system. However, since automated counting tools cannot distinguish between External Inquiries and External Outputs, all External Inquiries will be included in and counted as External Outputs.
For Input translation, File Types Referenced shall refer to the number of file referenced read or updated. Data function can divide in External Interface Files(EIF) a user recognizable group of logically related data or control information, which is referenced by the application being measured, but which is maintained within the boundary of another application. Internal logical file (ILF) user recognizable group of logically related data or control information maintained within the boundary of the application being measured. For the data function it is needed to identify Data element types and Record element types and compare them with Data Function Complexity for evaluating the Data Function Size. Before starting we define the object DET as data element type. It is a unique user recognizable, non-repeated attribute that is part of an ILF, EIF, EI or EO.
When we have identify FTR (data function read and/or maintained by a trans-actional function) we can compare it with following tables:
With this consideration we can start by identify DET component involved. We can identify 4 ILF that are data search runtime, experimental data, OpenSmoke Data and file paper. These are the four most important inputs that we want to save and manage in our database. For each of them we can define DET contained in. For research Data we have seven observable DET: Component of experiment, Keyword, Range of pressure, range of temperature, reactor, model and equivalence Ratio. For the experimental Data we manage in database Ignition Time Specie, Ignition time output, reference page about the experiment, type structure, file paper, experiment rows and experiment columns. We soffirm on OpenSmoke data, these data are manage in dynamic and extended way, so we identify major data that are Reactor, model, eleven dynamics element that depend on reactor selected as the subDictionary. We can have eight subDictionaries to manage openSmoke data
Table 3.1. External Input complexity
1-4 DET 5-15 DET >15 DET
<2 FTR 1 1 2
2 FTR 1 2 3
>2 FTR 2 3 3
Table 3.2. External Output complexity
1-5 DET 6-19 DET >19 DET
<2 FTR 1 1 2
2 FTR 1 2 3
>2 FTR 2 3 3
Table 3.3. External Input complexity
External Input Complexity External Input weights
1 3
2 4
3 6
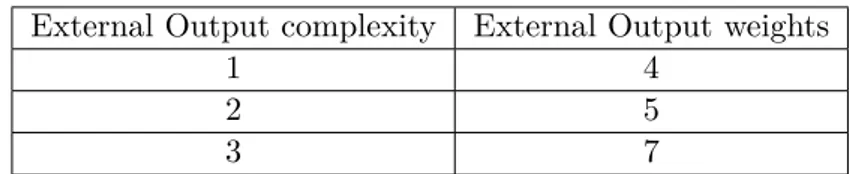
Table 3.4. External Output complexity
External Output complexity External Output weights
1 4
2 5
3 7
with a total of 41 fields to manage. In the end we evaluate File Paper ILF that involve nine DET as Name of file paper, references, authors, file associated to it and experimental data associated with its references and image. In the analysis we have a EIF file that use after the execution of openSmoke are OpenSmoke output that involve one file with dataPoint of simulation. Below we show the table with Data Function and complexity:
Table 3.5. Data Function evaluation
TYPE RETs DETs COMPLEXITY
Data of Research ILF 2 7 Low
Experimental Data ILF 3 7 Low
OpenSmoke Data ILF 11 41 High
File Paper Data ILF 3 9 Avarage
Open Smoke Output EIF 1 1 Low
We can calculate Function point size for each Type of Data Function by these operations ILFs= 7 X ILFDF C=1+ 10 X ILFDF C=2+ 15 X ILFDF C=3 EIFs= 5 X EIFDF C=1+ 7 X EIFDF C=2+ 10 X EIFDF C=3
3.2 Requirement Analysis and Specfication Document 25
We make refereces to Table 3.5 and we calculate our functions point
ILFs= 7 · 1 + 10 · 1 + 15 · 1 = 46
EIFs= 5 · 2 = 10
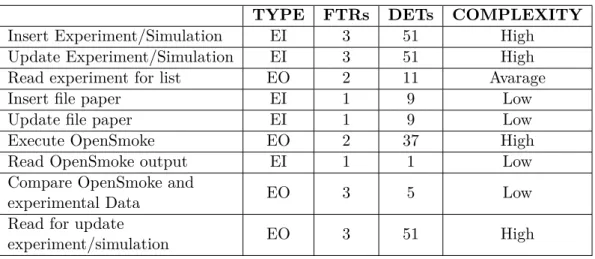
For the Transactional Data we find the operations that the software can have that involved use of Data Function, in the table 3.6 we show the operations and their relative FTR and DET. In the last column we can see the complexity relative to operation.
Table 3.6. Transactional Function evaluation
TYPE FTRs DETs COMPLEXITY
Insert Experiment/Simulation EI 3 51 High
Update Experiment/Simulation EI 3 51 High
Read experiment for list EO 2 11 Avarage
Insert file paper EI 1 9 Low
Update file paper EI 1 9 Low
Execute OpenSmoke EO 2 37 High
Read OpenSmoke output EI 1 1 Low
Compare OpenSmoke and
experimental Data EO 3 5 Low
Read for update
experiment/simulation EO 3 51 High
As the Data function we calculate the Transactional point size by these expression:
EIs= 3 X EIEIC=1+ 4 X EIEIC=2+ 6 X EIEIC=3 EOs= 4 X EOEOC=1+ 5 X EOEOC=2+ 7 X EOEOC=3
We make reference Table 2.2 and we execute calculation
EIS = 4 · 3 + 6 · 2 = 24
EOs= 5 · 1 + 7 · 2 = 19
Finally we can calculate the Automated Function Point size
AF P s = ILFs+ EIFs+ EIs+ Eos
AF P s = 46 + 10 + 24 + 19
3.2
Requirement Analysis and Specfication Document
3.2.1 Introduction
Section goal
The goal of this section makes a definition to functionality and definition about the software in question, this section specifies the condition and precondition to use the product. We start with the definition of dictionary and the analysis of
different scenarios to explain the goal and different study. In next sections we can find different example to applications of this software. Major beneficiaries of this section are customer, teams of developing and testing team.
General goal
The Department of Chemistry wants automate processes of execution of simu-lation and comparison with openSmoke simusimu-lation output and experimental data. Goal of this software is to give to students the possibility to manage all data with interface and the possibility to store these data in a common structure to share with all students. Students can insert, update and execute simulation of openSmoke and manage it in the specific form. Moreover students can associate and modify experimental data for each simulation insert. Students can execute more simulation in one time and they can check the results of all of them at the end of process. Other goal is propose to client a confortable and intuitive interface and speed up the process of simulation and study of old insert data.
Definitions
• OpenSmoke++ : is software that the Department use to create an output of reactor from initial condition and changes in the simulation. These conditions are signal in the input file that changes depending on reactor.
• Experiment: is the association between Experimental data, Simulation Data and research data.
• Experimental data: are data taken from the Paper. These represent data take from graphs of experimental experiment. Experimental data represent data point of species of experiment with a variable as time, temperature or pressure. Variable rapresents X-axis and the species are on Y-Axis.
• Simulation Data: are data used for creating input of openSmoke.
• File Paper: is the file where researchers take experimental data. In File paper there are all information about experiments in study as Initial Condition, changes in runtime and Reactor or model used. Students start from these file to take a data and information about these.
• Research Data: are data associated to experiment and simulation used for the research of it. These data are also use to give general information to the experiment.
• Reactor: vessels designet to contain chemical reactions. In our case is the core of the simulation of openSmoke. The interface and input file of openSmoke depends on reactor.
• Specie: species mass fractions used from Reactor to track variation in chemical composition.
3.2 Requirement Analysis and Specfication Document 27
• PreProcessor: is the specification of kinetics use. PreProcessor is executing with openSmoke but is independent from the experiment. It is specify and execute at execution time.
• OpenSmoke output: is file output generated by openSmoke. This is tabular file with column with output value from execution of openSmoke. OpenSmoke output contains all species or only species specify in input and variable as temperature, pressure and time depending on the case of reactor.
• Graphics: is graph that represents comparison between experimental data and OpenSmoke output.
3.2.2 Description of product
Present situation
The Department of Chemistry doesn’t have a software to manage data. The students store experimental data, input of openSmoke and output of OpenSmoke in a local directory. The researchers create and store in the same place graph of comparison between output of openSmoke and experimental data. The Department has openSmoke software to generate the simulation and creates output file to analyse. This software has a documentation with rule of use and explanation of the structure of input file. These structure depend on the Reactor of simulation and for each reactor there are different filed and SubDirectory of input. Before doing an analysing of the software we study the rule of openSmoke and different input types of it. We must also keep to rules of input and we examine structure of output of it. Beyond openSmoke documentation we have also different type of experimental data and we must create a structure and standards to manage these data and insert it in the database in the correct way. Finally we have to consider an easy way to insert these data and search it. In this way the researcher don’t have difficulty to manage his data, use correctly his software and lose his time.
Stakeholders
• The data entry researcher: interested to a system easy to use. This researcher wants an easy system to insert data of simulation, experimental data, research data and file paper. The researcher inserts huge quantities of data for create experiment association. This researcher wants an easy interface. The insert fields must be simple to find and organized in a linear mode. The researcher expects that the association between simulation of OpenSmoke++ and exper-imental data is easy to do. He expects the same from association between experimental data and File paper.
• The evaluating researcher: is the researcher that research simulations to execute and check comparison between OpenSmoke++ output and experimental data. This researcher must have the possibility to research interested experiments so he expects wide research and he wants personalize the research based on his expectation. The research has to be with general and fundamental field, the student must be able to do all logical operations between fields proposed.
The evaluating researcher can execute PreProcessor so he can select different file of kinetics, termodinamics etc to create PreProcessor’s folder used for the simulation. Other important functionality that the evaluating researcher use is the execution of OpenSmoke++, after the selection of experiments the researcher starts the execution and at the end he expects to find in the selected folder graph with comparison between experimental data and OpenSmoke++ output.
Software interface and requirements Server
Other software products required to hardware for support application are • DBMS( Database Management System):
– Name: MySQL – Mnemonic: MySQL – Version number: 5.6.14
– Source: http://dev.mysql.com/downloads/mysql/
• Java Virtual Machine:
– Name: Java virtual Machine – Mnemonic: JVM
– Version number: 8
– Source: https://www.java.com/it/download/
• JDK:
– Name: Java development kit – Mnemonic: JDK
– Version number: 8
– Source:
http://www.oracle.com/technetwork/java/javase/downloads/jdk8-downloads-2133151.html • Operating system:
It is not necessary a specific operating system but it must be able to support DBMS MySql and it must have java virtual machine install on it.
Software interface and requirements Client
For this version of the software Client must be a user of the server where is save the software. They must have a link of the software and install on this account following software:
• OpenSmoke:
– Name: OpenSmoke++ – Mnemonic: OS++
3.2 Requirement Analysis and Specfication Document 29 – Source: • Gnuplot – Name: gnuplot – Mnemonic: gnu – Version Number: 5 – Source: http://www.gnuplot.info/download.html
3.2.3 Function of the product
Functional Requirements
In the system there is one actor that is the researcher. He is the user of the software and he executes all the function of the system. We describe all requirements below
• Mange of experiment
– Insert/update simulation
– Insert/Update experimental data
– Insert/Update references paper for each experimental data – Insert/Update search data
• Manage of File Paper
– Insert/Update name and authors of File Paper – Insert/Update pdf of file Paper
– Insert/Update references and Image of experimental data of file Paper
• Execution of Simulation
– Search and selection of experiments – Execution of Pre Processor
Non functional requirements
Design that instructs choices to interface is create a logical flow of the work. For doing this we create different form for each data type to insert or update. The main form is the form that include Simulation data and search data, we make this form dynamics respect the selection of the Reactor. In this way the researcher doesn’ t have one form for each reactor to choose. The design allows the insert on experimental data linked to the simulation and it allows associating reference paper specification to every experimental data inserted. The design is composed by a form for data search used to simplify to the user the selection and for give a complete visualization of the operation to make. For the output of simulation and comparison of the experiment we organize in hierarchical way all the directory.
3.2.4 System Model
This Section describes all scenarios of functional Requirements. We identify the main scenario and describe it with different actors present in the Department.
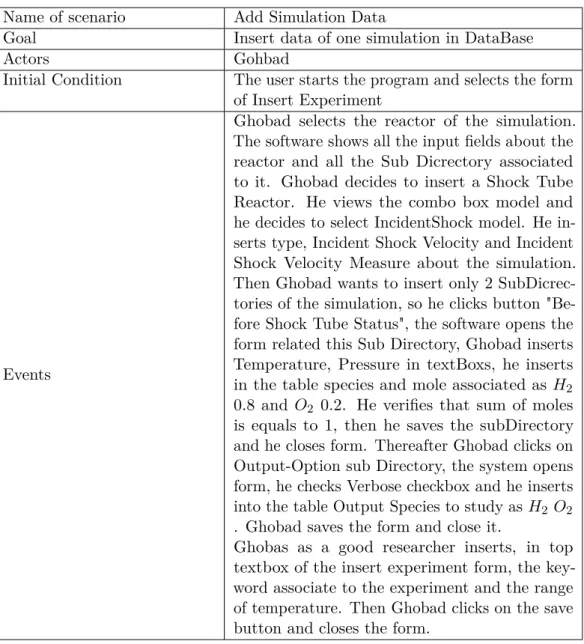
Table 3.7. Scenario1
Name of scenario Add Simulation Data
Goal Insert data of one simulation in DataBase
Actors Gohbad
Initial Condition The user starts the program and selects the form of Insert Experiment
Events
Ghobad selects the reactor of the simulation. The software shows all the input fields about the reactor and all the Sub Dicrectory associated to it. Ghobad decides to insert a Shock Tube Reactor. He views the combo box model and he decides to select IncidentShock model. He in-serts type, Incident Shock Velocity and Incident Shock Velocity Measure about the simulation. Then Ghobad wants to insert only 2 SubDicrec-tories of the simulation, so he clicks button "Be-fore Shock Tube Status", the software opens the form related this Sub Directory, Ghobad inserts Temperature, Pressure in textBoxs, he inserts in the table species and mole associated as H2 0.8 and O2 0.2. He verifies that sum of moles is equals to 1, then he saves the subDirectory and he closes form. Thereafter Ghobad clicks on Output-Option sub Directory, the system opens form, he checks Verbose checkbox and he inserts into the table Output Species to study as H2 O2 . Ghobad saves the form and close it.
Ghobas as a good researcher inserts, in top textbox of the insert experiment form, the key-word associate to the experiment and the range of temperature. Then Ghobad clicks on the save button and closes the form.
![Figure 2.1. Life cycle Digital Libraries [15]](https://thumb-eu.123doks.com/thumbv2/123dokorg/7513115.105408/16.892.310.685.328.563/figure-life-cycle-digital-libraries.webp)

![Figure 2.2. Software Infrastructure [24]](https://thumb-eu.123doks.com/thumbv2/123dokorg/7513115.105408/23.892.251.559.131.463/figure-software-infrastructure.webp)